
Abstract
The success of drug development is greatly influenced by the efficiency of drug screening methods. Recently, phenotype-based screens have raised expectations, based on their proven record of identifying first-in-class drugs at a higher rate. Although fluorescence images are the data most commonly used in phenotype-based cell-based assays, nonstained cellular images have the potential to provide new descriptive information about cellular responses. In this study, we applied morphology-based evaluation of nonlabeled microscopic images to a phenotype-based assay. As a study case, we attempted to increase the efficiency of a cell-based assay for chemical compounds that induce production of nerve growth factor (NGF), using lyconadin B as a model compound. Because the total synthesis of lyconadin B was accomplished very recently, there is no well-established cell-based assay scheme for further drug screening. The conventional cell-based assay for evaluating NGF induction requires two types of cells and a total of 5 days of cell culture. The complexity and length of this assay increase both the risk of screening errors and the cost of screening. Our findings show that analysis of cellular morphology enables evaluation of NGF induction by lyconadin B within only 9 h.
Keywords
Introduction
In the field of drug development, the success of new drug discovery is greatly affected by the efficiency of drug screening methods. Currently, two methods of drug screening are in wide use: (1) target-based screening, in which molecules are screened based on their interactions with target proteins, including structure-based screening and virtual screening, and (2) phenotype-based screening, in which molecules are screened based on cellular phenotype or behavior, including cell growth, cell death, and other biological functions in cell-based assays.
Target-based drug screening has been possible since the 1980s, following the widespread adoption of molecular biology techniques and the availability of recombinant proteins. Target-based screening has effectively contributed to the discovery of drugs, especially second-generation drugs, by combining the advantages of having a clinically validated target with all the tools and information available with a defined mechanism of action. Recently, phenotype-based screening has been reported to yield a higher rate of first-in-class drugs resulting in heightened expectations for this approach. To date, 28 first-in-class molecules have been discovered using phenotype-based screening. 1 Phenotype-based screening may be facilitated compared to target-based screening because the former does not require prior understanding of the molecular mechanism of action (MMOA); nonetheless, many drugs discovered in this manner have been successfully connected with their physiological effects. Even when MMOAs remain unknown, drugs can be identified through phenotype-based screening; successful examples include rufinamide (an antiepileptic), ranolazine (used to treat angina pectoris), and zonisamide (a drug that could be used to treat Parkinson and Alzheimer diseases). 1
However, to meet the existing demand, phenotype-based screening technology must still overcome several disadvantages in cell-based assays: (1) limited throughput relative to target-based screening, (2) high cost of exhaustive experiments for each assay; (3) limited conditions for cellular evaluation, resulting in emphasis on end-point assays; and (4) the practical complexity of maintaining cells for exhaustive assays.
High-content analysis (HCA) is a powerful, highly automated approach that combines image processing and high-dimensional bioinformatics analysis of image data to evaluate the results of cell-based assays. 2 Image-based assays enable rapid and exhaustive evaluations of detailed cellular responses. However, because most HCA requires invasive fluorescent staining, such assays tend to be limited to end-point measurements. Consequently, the aforementioned disadvantages of phenotype-based assays are not completely overcome by HCA.
To address this issue, we developed a real-time cellular evaluation method based on morphologies of nonstained cells.3–5 Our method evaluates changes in cellular responses by quantifying morphological features of all cells in time course images, yielding multivariate data that are subsequently subjected to bioinformatics analyses. Such assays offer several advantages: (1) high speed and exhaustive throughput of cellular screening, including single-cell analysis; (2) cost efficiency, due to the absence of staining; and (3) nondestructive real-time evaluation of images acquired over a time course. Moreover, such multiparametric analysis is the key analysis concept that has been exploited in other advanced HCA projects.6–9 We applied this technique to evaluate the quality of cultured cells, including the differentiation potential of stem cells.3–5 Our morphology-based evaluation method provided not only the three aforementioned advantages but also enabled daily evaluation of rapidly changing cellular conditions. In this report, we verified the ability of our method to evaluate the cellular response to potential drug lead compounds. Specifically, we selected lyconadin B as a model organic compound that stimulates the expression of nerve growth factor (NGF) messenger RNA (mRNA) in neurons. The total synthesis of lyconadin B has recently been described; this molecule is a member of the lycopodium alkaloid family of compounds, which are related in that they regulate various biological responses.10–12 NGF, the molecule stimulated by lyconadin B, regulates the differentiation, survival, and growth of neurons and plays central role in neurological diseases such as Alzheimer and Parkinson diseases. Rescuing cholinergic neurons by inducing NGF is a promising strategy for the treatment of Alzheimer disease.13,14 In addition, elevated levels of NGF are associated with improved learning ability. 15 Because neurodegenerative disease has become one of the most lucrative markets for drugs, effective cell assays for such new seed compounds will be important in screening related compounds or intermediates.
To date, cell-based assays for detecting the ability of drugs to stimulate NGF expression or production have primarily used classic methods. The most sensitive conventional method for identifying NGF inhibitors/activators is an assay for measuring elongation of neuron cells in response to NGF production. For example, researchers have reported an efficient method for the identification of NGF-regulatory molecules, which resulted in the identification of CAD (5, 19-cyclo-9 beta, 10 xi-androstane-3, 17-dione), complanadin B, and lyconadin B.16–18 Kikuchi et al. 16 also reported the successful evaluation of PC12 cellular elongation. In both of these studies, two types of cells (1321N1 and PC12) were used in the assay. After stimulation of 1321N1 cells, which express NGF in the supernatant, NGF production and function were assayed by observing neurite outgrowth of PC12 cells exposed to 1321N1 supernatant. The greatest advantage of this cell-based assay is its ability to sensitively detect NGF functionality in the 1321N1 supernatant, which can be confirmed quantitatively even in a small number of responding cells. Several studies16–18 have combined reverse transcription (RT)–PCR or enzyme-linked immunosorbent assay (ELISA) with such phenotypic outcomes. However, although these assays provide quantitative results, their results are limited to confirmation of an intermediate biological response (e.g., mRNA expression or protein production of NGF). Moreover, because these assays return averaged results from a heterogeneous population of cells, their sensitivity is sometimes reduced. To meet the growing demand for evaluation of molecules as treatments for neurodegenerative diseases, technologies for enhancing the screening efficacy of such cell-based assays are urgently required. In previous cellular assays, two types of cells and a minimum of 5 days of cell culture were required to visualize neurite outgrowth under the microscope. Such complexity and length can increase both the risk of screening errors and the cost of the screen. Here, we describe a morphology-based cellular evaluation method that can quantify the effect of lyconadin B, an NGF mRNA stimulator, with shorter assay time and lower cost. Our results demonstrate that a cell-based assay for the NGF stimulating effect of lyconadin B can shorten the total assay to only 9 h, 13 times faster than the 5 days required for the conventional method.
Materials and Methods
Cells and Cell Culture
Human astrocytoma (1321N1) cells and rat pheochromocytoma (PC12) cells were purchased from DS Pharma Biomedical Co., Ltd (Osaka, Japan). 1321N1 cells were maintained in Dulbecco’s modified Eagle’s medium (DMEM) (Wako, Osaka, Japan) supplemented with 10% fetal bovine serum (FBS) (Nichirei Biosciences, Tokyo, Japan), penicillin (100 U/mL), and streptomycin (0.1 g/mL). PC12 cells were maintained in DMEM supplemented with 10% FBS, 5% horse serum (HS) (Thermo Fisher Scientific, Waltham, MA), penicillin (100 U/mL), and streptomycin (0.1 g/mL). The cells were cultivated at 37 °C in an incubator containing 5% CO2 and at 85% humidity.
Evaluating the Ability of Lyconadin B to Induce NGF
The overall assay procedure is illustrated in Figure 1A . 1321N1 cells were seeded in 12-well plates at a density of 2.0 × 10⁵ cells/well and cultured for 24 h. Before the cells were incubated with lyconadin B, the medium was replaced with serum-free DMEM. Lyconadin B was administered at four concentrations: 0 µM (PBS control), 10 µM, 100 µM, and 250 µM. As a negative control, the compound that induces a cytotoxic effect on cell growth, phorbol 12-myristate 13-acetate (PMA), was administered at a concentration of 0.1 µM. After the cells were incubated with lyconadin B for 24 h, the supernatant was collected and filtered using filter vials (0.45-µm pore size; GL Sciences, Tokyo, Japan) to eliminate cross-contamination. PC12 cells were seeded into 12-well plates coated with Collagen Type IV (Corning, Corning, NY) at a density of 2.4 × 10⁴ cells/well; the low density was chosen to facilitate image analysis. After 48 h, the PC12 medium was aspirated and replaced with supernatant from 1321N1 cells supplemented with 10% FBS and 5% HS. Cells were incubated for an additional 4 days, and their elongation morphology was evaluated by microscopy. Our method, using human 1321N1 cells for NGF production combined with rat PC12 cells for phenotypic detection, is based on a neural outgrowth assay established in previous work.16–18 For all following assays, triplicate wells were evaluated.
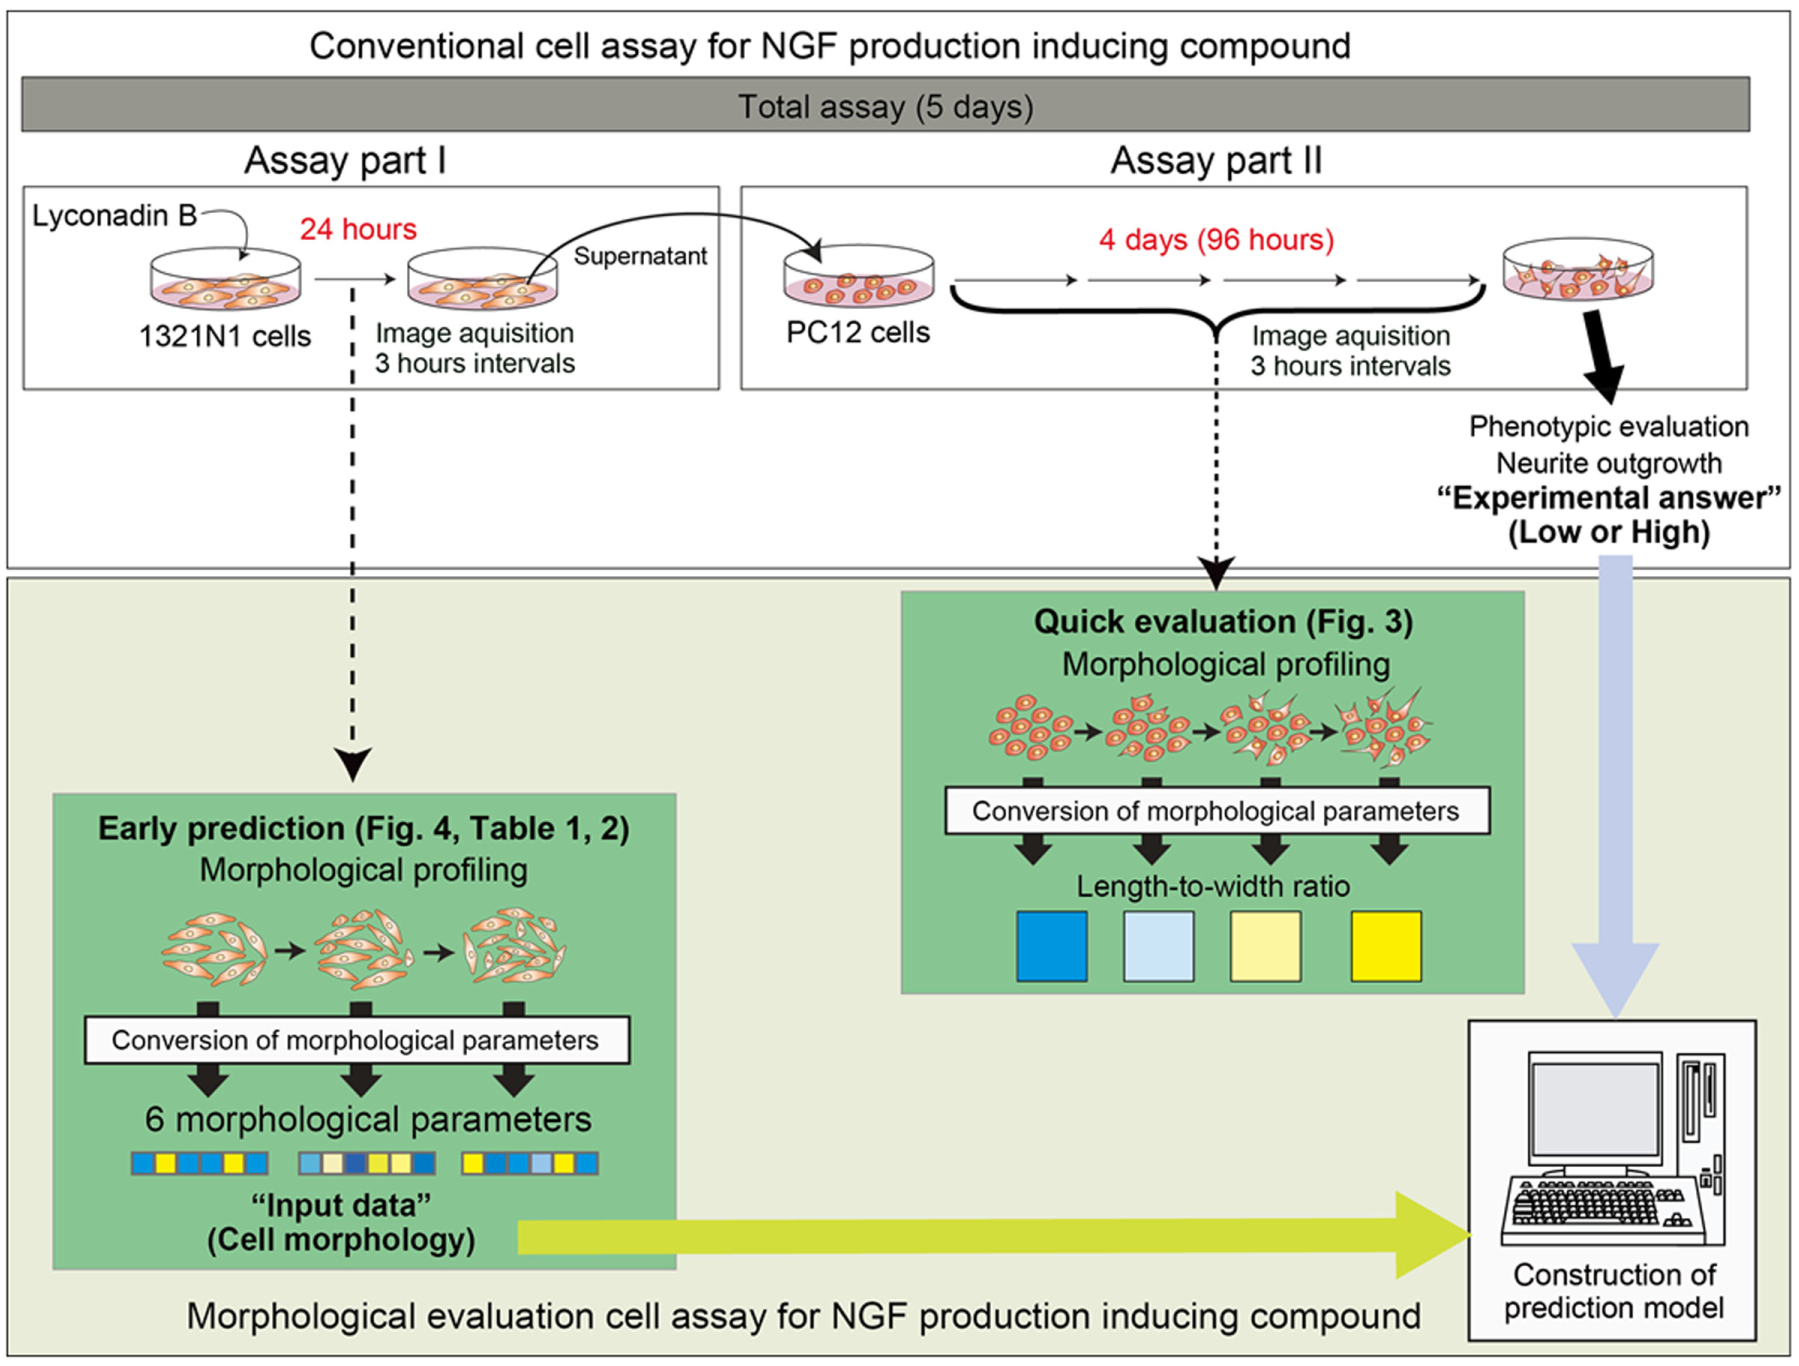
Study design for image-based cellular evaluation of a conventional cell assay. A conventional scheme for evaluating induction of nerve growth factor (NGF) is shown at the top of the figure. This conventional assay can be divided into two parts. NGF protein is released from 1321N1 cells, which are stimulated by chemical compounds in the supernatant (assay part I) and evaluated by assessing neurite outgrowth of PC12 cells (assay part II). To shorten the PC12 assay, image-based cellular evaluation was applied to assay part II, in which cellular morphology is known to be an important indicator. In the second trial, to further shorten the overall assay, our evaluation method was applied to assay part I, in which the importance of cellular morphology was unknown. Linear discriminant models were constructed for prediction of PC12 neurite outgrowth rate (high/low) of assay part II, using cellular images from assay part I.
Cell Image Acquisition
Phase-contrast microscopic images of 1321N1 and PC12 cells were obtained using the BioStation CT (Nikon Corporation, Tokyo, Japan) with slight modifications. Briefly, five view fields (center position and four positions 2.2 mm from the center) of phase-contrast images were acquired from each well with fully automatic focusing. For all assays, images were acquired once every 3 h (10× magnification). Time points were designated as time 1 to time 8 for 1321N1 cells and as time 1 to time 32 for PC12 cells.
RT-PCR
To measure the level of NGF mRNA produced in response to lyconadin B, total RNA was extracted from 1321N1 cells using the RNeasy Plus Mini kit (Qiagen, Valencia, CA) 24 h after addition of lyconadin B. Complementary DNA (cDNA) was synthesized using the ReverTra Ace qPCR RT kit (TOYOBO Co., Ltd., Osaka, Japan) on a T100 Thermal Cycler (Bio-Rad Laboratories, Hercules, CA). The reverse transcription reaction ran for 15 min, and the enzyme deactivation reaction ran for 5 min. NGF mRNA (cDNA) was measured by qPCR using the following primers: NGF sense, 5′-CTTCAGCATTCCCTTGACAC-3′; NGF antisense, 5′-AGCCTTCCTGCTGAGCACACA-3′ (Hokkaido System Science Co., Ltd., Hokkaido, Japan). GAPDH, a housekeeping gene, was amplified as an internal control: GAPDH sense, 5′-GCACCGTCAAGGCTGAGAAC-3′; GAPDH antisense, 5′-ATG GTGGTGAAGACGCCAGT-3′. qPCR was performed in 20-µL volumes containing THUNDERBIRD SYBR qPCR RT Mix (TOYOBO Co., Ltd., Osaka, Japan). Amplification conditions were as follows: 95 °C for 15 s and 60 °C for 1 min for 40 cycles. The level of NGF mRNA was normalized to the level of GAPDH mRNA in the same sample.
Cell Image Processing
All images were processed and quantitated using the CL-Quant software (Nikon Corporation). Five original filter processes were designed: (1) background adjustment, (2) cell recognition, (3) noise removal, (4) filling in blank regions in cell objects, and (5) removal of incomplete cells in peripheral areas of images (
Clustering Analysis
The morphological profiles of cells subjected to each dose condition were analyzed by hierarchical clustering. To obtain morphological profile data, multiple parameters (area, compactness, length, perimeter, length and width ratio, width) and their median values were collected from 200 to 300 cells (PC12) or 500 to 800 cells (1321N1) obtained from 10 images for each sample. Hierarchical clustering was carried out in Cluster 3.0 (http://bonsai.hgc.jp/~mdehoon/software/cluster/software.htm) using complete linkage by Euclidean distance.
Construction of Prediction Models
The effect on NGF production was predicted from morphological parameters obtained from cellular images. For such predictions, linear discriminant models trained with input parameters (morphological parameters) were used in combination with experimental results (NGF production effect). In this work, the NGF production effect was defined as the experimentally evaluated PC12 growth after a total of 5 days (measured after 4 days of exposure to 1321N1 supernatant, which was collected from 1321N1 medium after 24 h of drug exposure). Each sample (an image from one field of view) was labeled as “high” or “low” based on the experimentally determined NGF production effect. The threshold between high and low was determined based on the difference in mRNA expression, previously determined by RT-PCR. The median value of morphological parameters in each image (one field of view) was used as the morphological parameter for that image. Consequently, a total of 35 data sets were acquired (low group: 10 data sets each for control and 10 µM; high group: 10 data sets for 100 µM and 5 data sets for 250 µM). From the distribution of the data sets, the maximum random prediction accuracy, which is the threshold of effective prediction, was 57.1%. Based on a consideration of multicollinearity, time points 1 to 8 (3–24 h) and 2 to 3 (6–9 h) were not analyzed together in the parameter selection steps. In addition, the predictive performance of models was calculated by leave-one-out cross-validation (LOOCV). R (version 3.1.0) (R Development Core Team, https://www.r-project.org/) was used to construct all prediction models.
Results
Morphological Quantification of Phenotypic Changes in PC12 for Evaluating Lyconadin B Effect
To investigate the performance of our morphology-based cell evaluation method as a phenotypic cell-based assay method, we selected lyconadin B, previously shown to induce NGF mRNA expression, 17 as a model chemical compound.
First, using a previously developed assay protocol, 19 we confirmed the concentration of lyconadin B that induces NGF expression ( Fig. 1 ). Quantitative PCR (qPCR) measurement of NGF mRNA levels in 1321N1 cells (assay part I in Fig. 1 ) indicated that the effective lyconadin B concentration was higher than 100 µM ( Fig. 2A ). Similarly, morphological observation of PC12 cells stimulated by the supernatant of 1321N1 cells (assay part II in Fig. 2 ) confirmed that concentrations above 100 µM effectively induced production of NGF ( Fig. 2B ). Hence, we categorized doses of lyconadin B as low (control and 10 µM) or high (100 µM and 250 µM). These observations were in accordance with previous results. 20
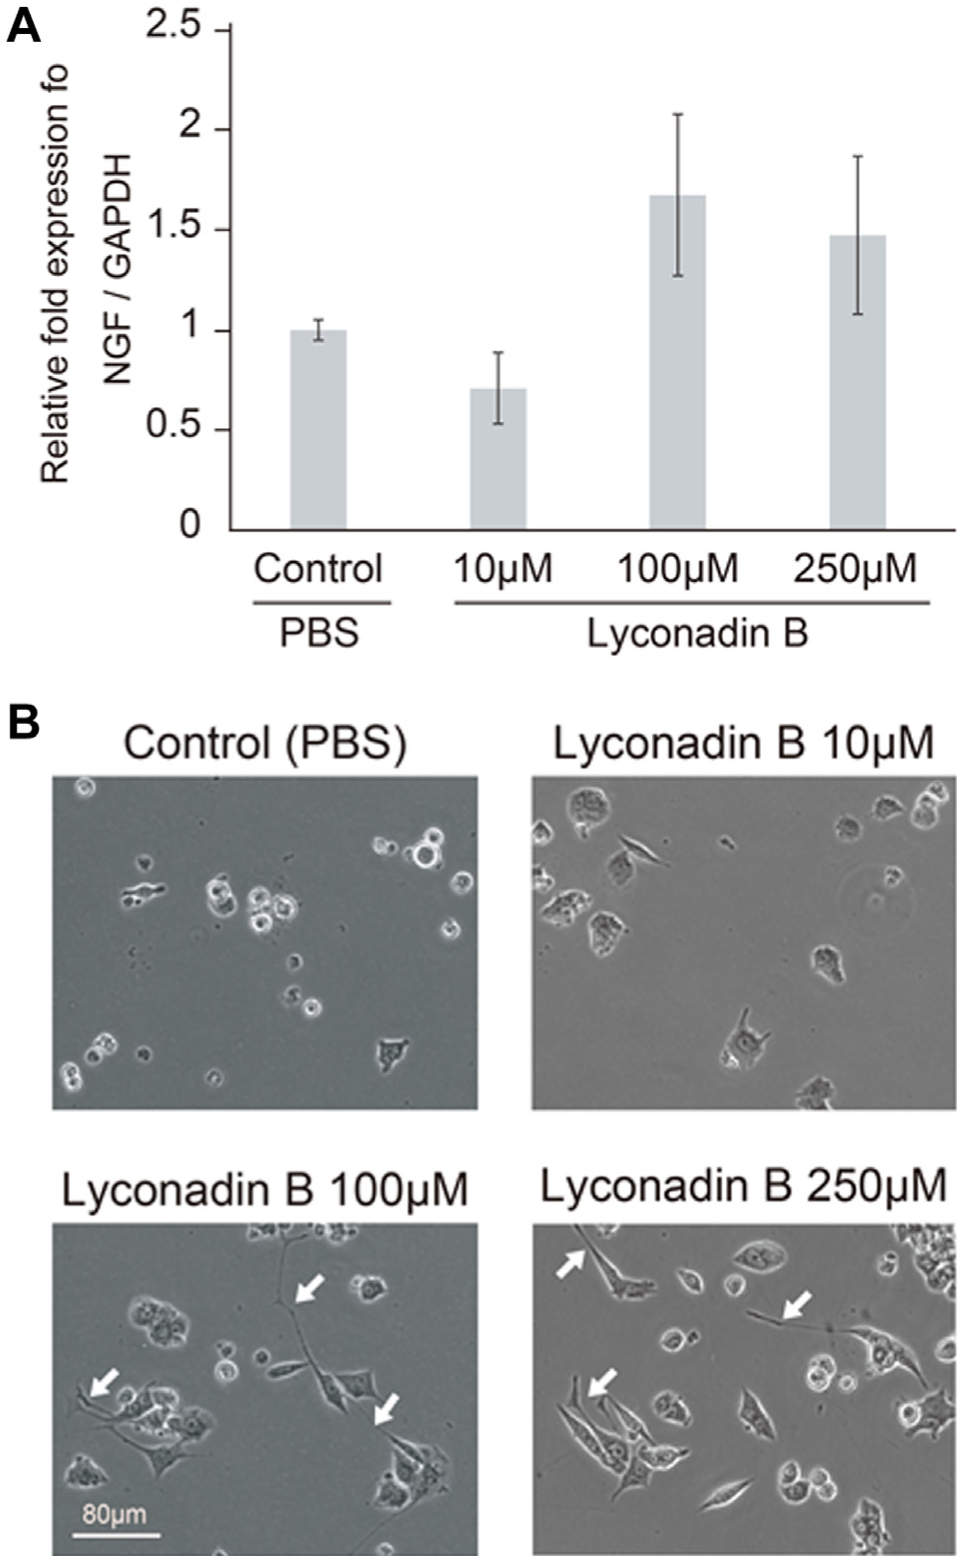
Detection of nerve growth factor (NGF) upregulation using phenotype of PC12 cells and reverse transcription–PCR. (
Second, we performed the morphological evaluation in assay part II (
Fig. 1
) using our image-based cell evaluation method. Ten images were acquired per condition, and the time course morphological changes of PC12 cells (1280 images over 4 days, acquired at 3-h intervals) were quantitated to yield the morphological profile (
Fig. 3
). In contrast to the timing of phenotypic evaluation in previous reports (varying between 2 and 4 days), our regularly scheduled image acquisition revealed that neurite outgrowth starts at 72 h or earlier (
Fig. 3A
; see also
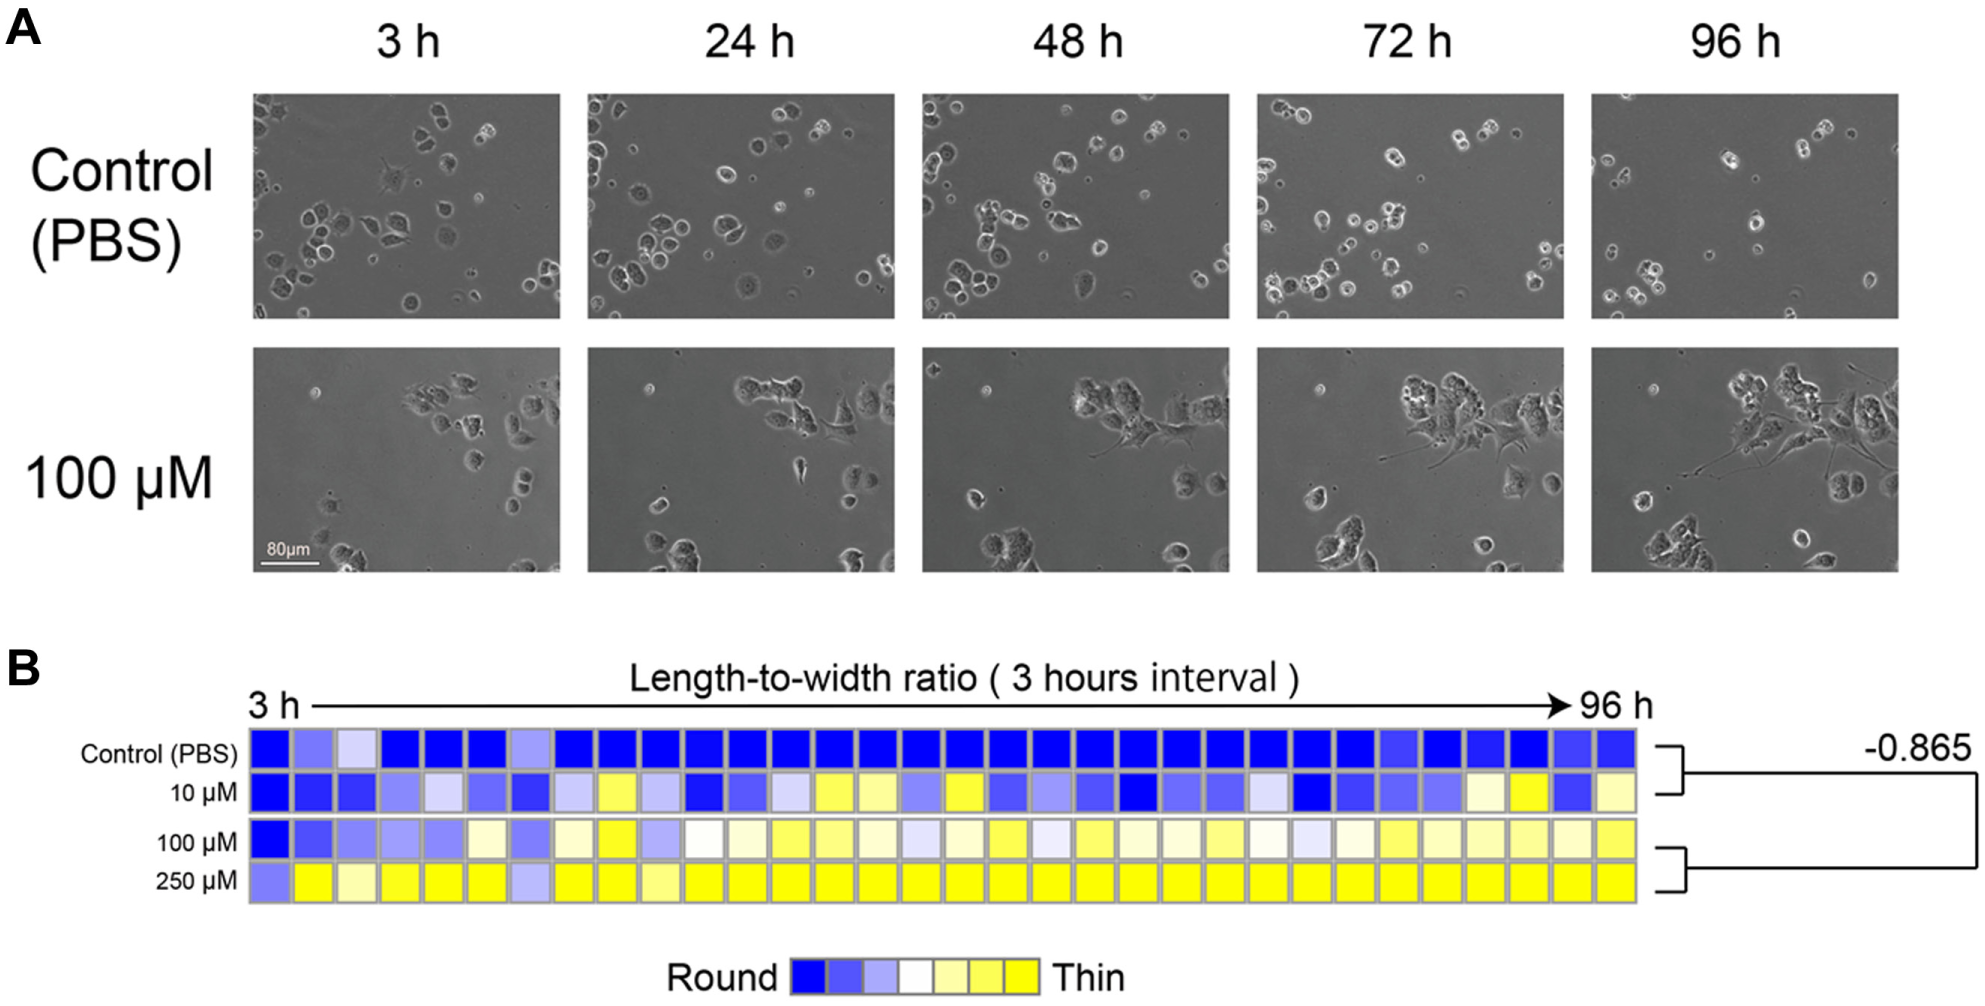
Quantification of cell morphology over a time course using an image-based cellular evaluation method in PC12 cells. Acquired images of PC12 cells were quantified using CL-Quant, and cell morphology was compared between dose conditions. (
Morphological Quantification of 1321N1 Cells for Early Detection of Lyconadin B Effect
Following the evaluation of PC12 cells (assay part II in
Fig. 1
), we used the image-based method to identify a morphological parameter that correlated with the rate of NGF production in 1321N1 cells (assay part I in
Fig. 1
). Following exposure to lyconadin B, 1321N1 cells were profiled by time course image analysis. In contrast to PC12 cells, in which it was easy to observe neurite outgrowth, in 1321N1 cells, it was difficult to manually recognize cellular morphological changes that correlated to lyconadin B dosage (
Fig. 4A
; see also
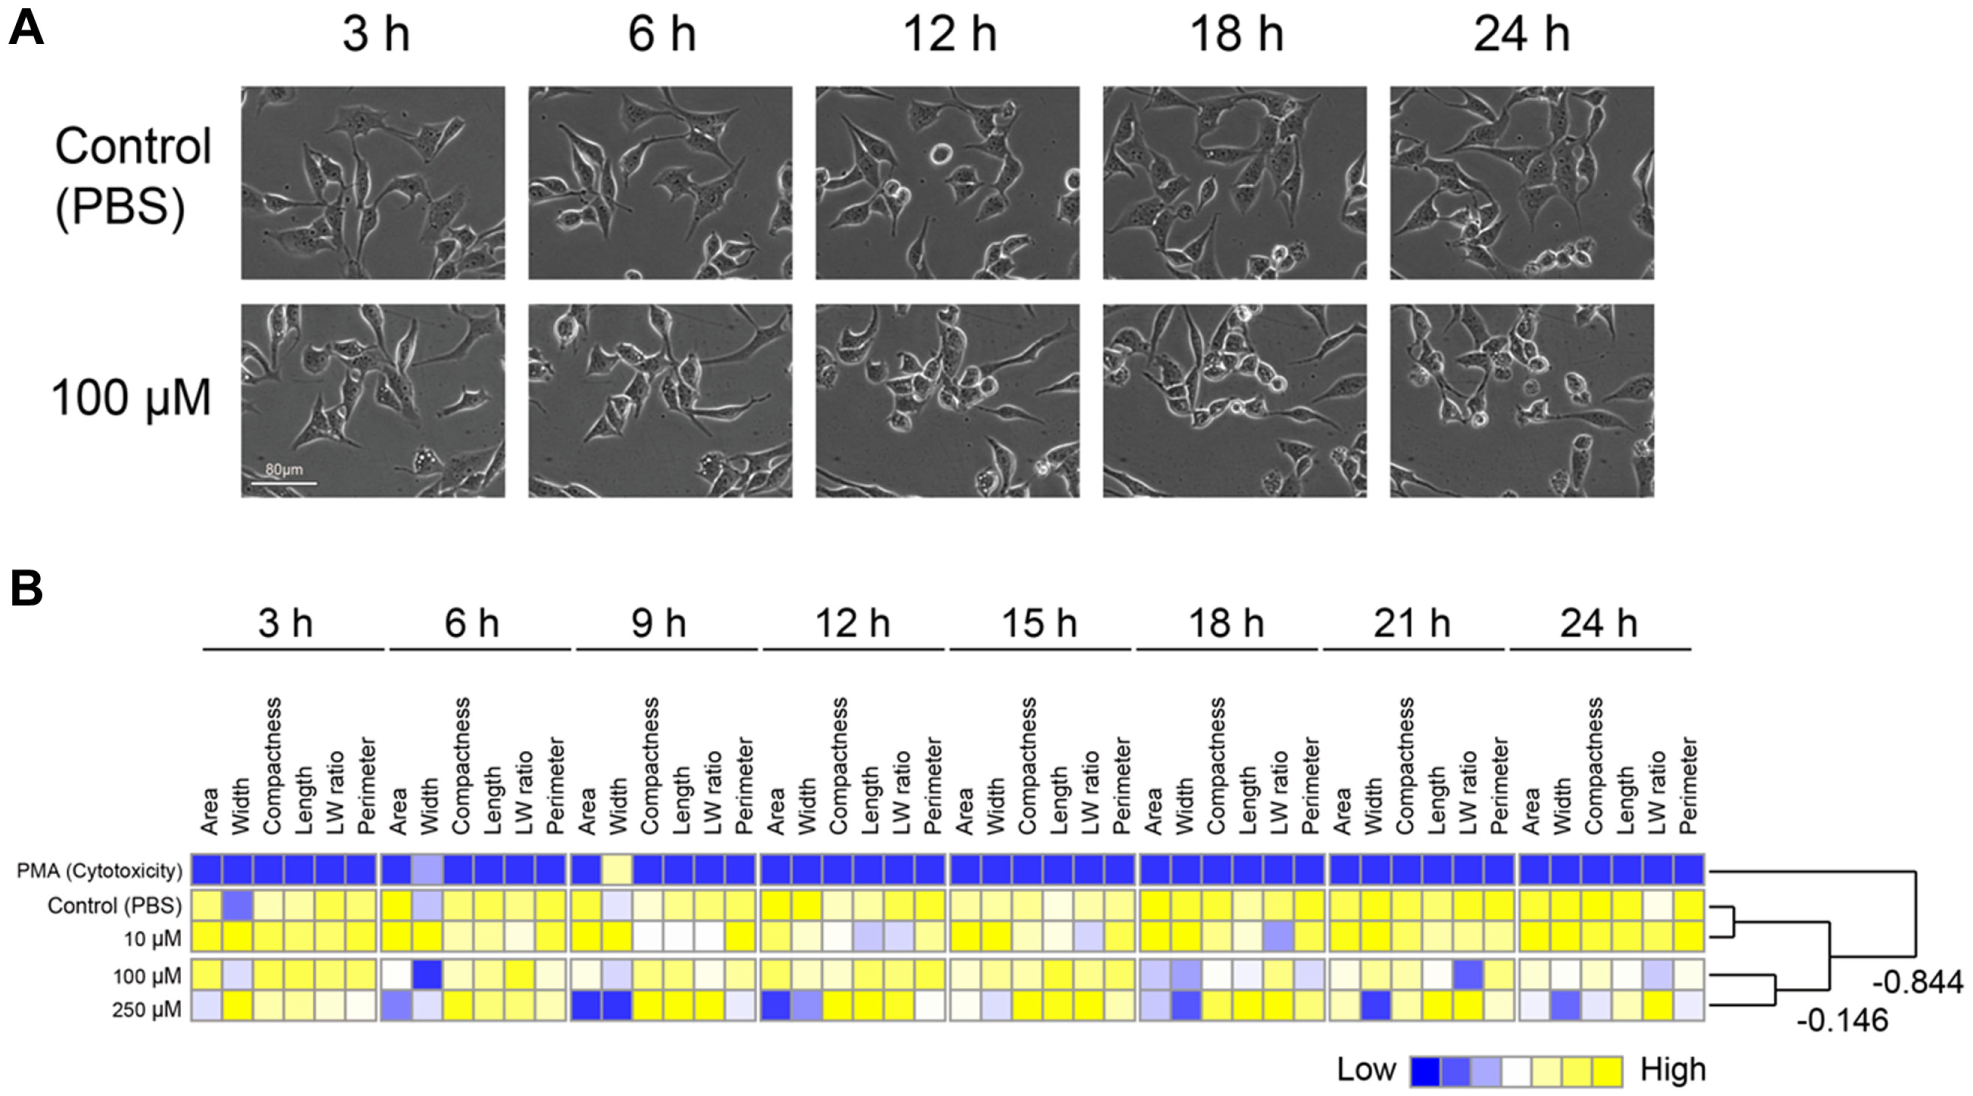
Quantification of cell morphology over a time course using the image-based cellular evaluation method in 1321N1 cells. Acquired images of 1321N1 cells were quantified using CL-Quant, and cell morphology was compared between dose conditions. (
Prediction of PC12 Neurite Outgrowth from Early Morphological Information of 1321N1 Cells
To minimize the overall process, including its complexity and the time required, we attempted to use the cellular morphological information obtained in this cell assay to predict the result of the neurite outgrowth assay. Using a profile consisting of six morphological parameters from nonstained phase-contrast images (assay part I) as input data, we constructed models to predict the NGF production effect of lyconadin B (high/low) by discriminant analysis ( Tables 1 and 2 ).
Accuracy of Prediction Model Using Cell Morphology over a Time Course.
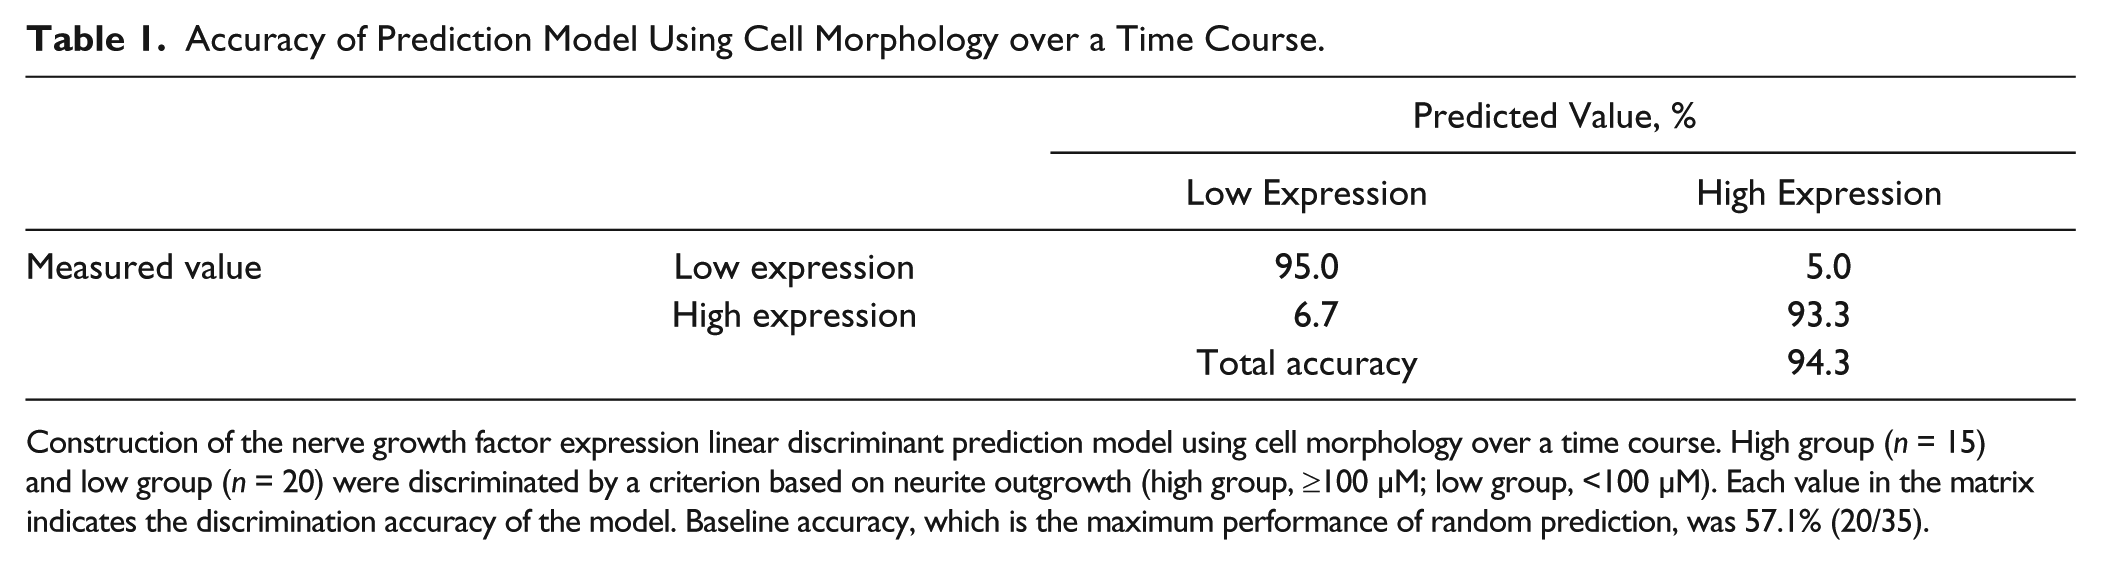
Construction of the nerve growth factor expression linear discriminant prediction model using cell morphology over a time course. High group (n = 15) and low group (n = 20) were discriminated by a criterion based on neurite outgrowth (high group, ≥100 µM; low group, <100 µM). Each value in the matrix indicates the discrimination accuracy of the model. Baseline accuracy, which is the maximum performance of random prediction, was 57.1% (20/35).
Accuracy of Prediction Model Using Only Cell Morphology between 6 and 9 h.
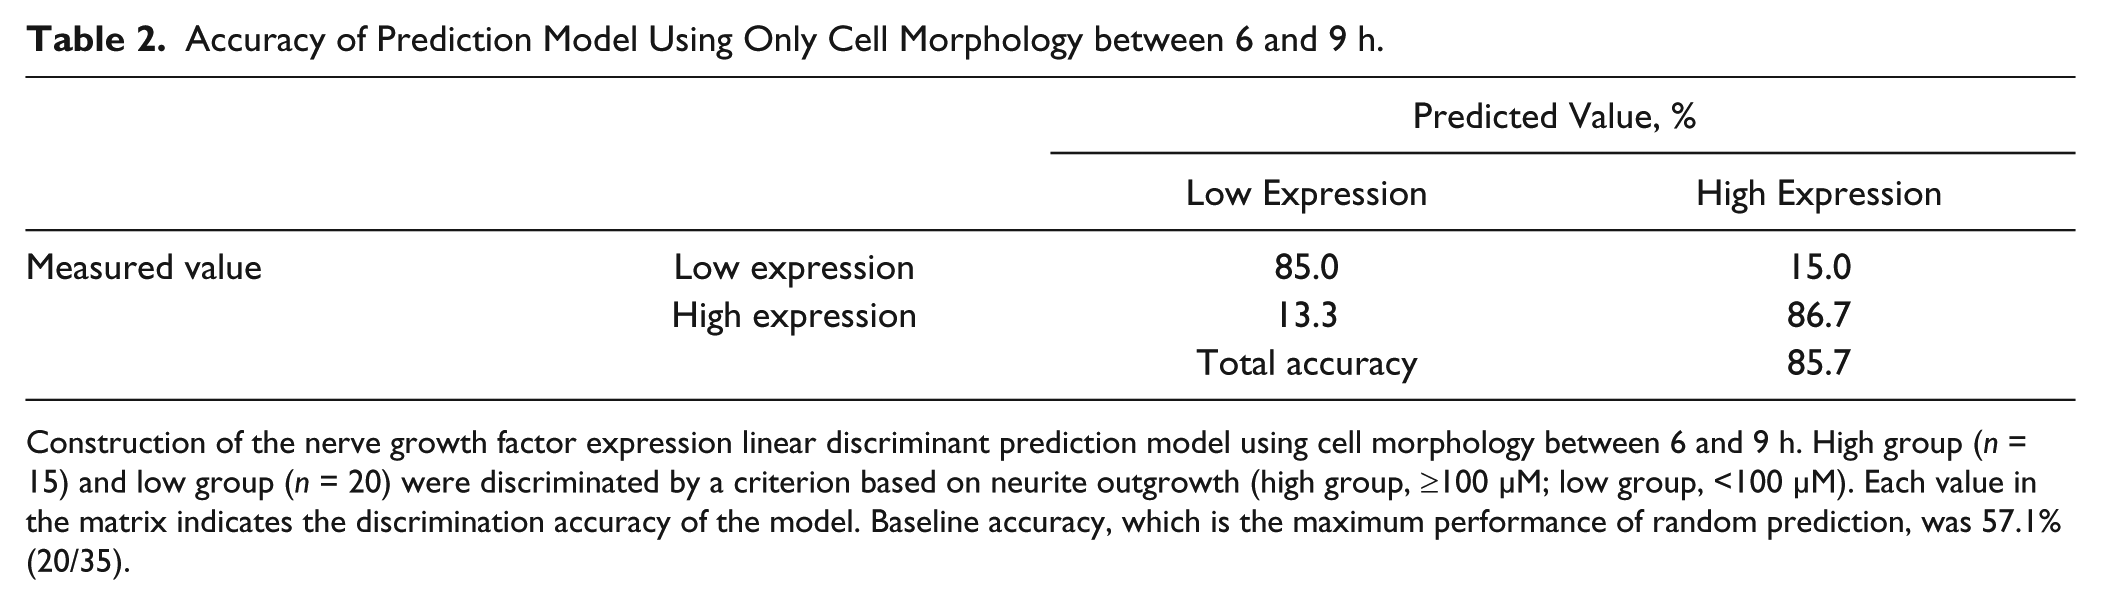
Construction of the nerve growth factor expression linear discriminant prediction model using cell morphology between 6 and 9 h. High group (n = 15) and low group (n = 20) were discriminated by a criterion based on neurite outgrowth (high group, ≥100 µM; low group, <100 µM). Each value in the matrix indicates the discrimination accuracy of the model. Baseline accuracy, which is the maximum performance of random prediction, was 57.1% (20/35).
By using total morphological profile transition information acquired between 3 and 24 h, we were able to predict the effect of lyconadin B effect with an accuracy of 94.3% ( Table 1 ). Based on this discrimination model formula, morphological parameters from early periods (6 and 9 h) were weighted in the prediction model. In other words, the prediction accuracy is still high even if we minimize the image data for prediction to 6 to 9 h ( Table 2 , 85.7%).
Discussion
To improve cell-based assays to meet the demand for phenotypic screening of drug candidate molecules, we investigated the performance of our morphology-based cell evaluation method in detecting the effect of an NGF-stimulating drug seed compound. Our goal was to determine the ability of our morphology-based method to increase the efficacy of cell assays to develop better phenotypic screens. We focused on establishing an effective cell-based assay scheme using lyconadin B as a model neurological drug. Because synthesis of lyconadin B is very challenging, this compound has become available for drug screening only very recently. Therefore, although the result of this study establishes an effective assay for lyconadin B, the basic underlying concept could be feasibly applied to further screening of NGF-stimulating compounds.
Natural products, their derivatives, and drugs that mimic the structures of natural products constitute 63% of the 974 candidate drugs discovered in recent years. For example, morphine (derived from poppy seeds), vinblastine (derived from Catharanthus roseus), and paclitaxel (derived from Taxus brevifolia) are widely used successful drugs. Recently, due to space limitations in combinatorial chemical libraries, the importance of compounds derived from natural products has increased.21–23 Because we have established a rapid and sensitive evaluation method for lyconadin B, a natural organic compound, we will next screen related compounds and intermediates to identify molecules with higher NGF-stimulating activity.
Initially, to confirm that exhaustive images acquired in real time could be used to effectively evaluate the cellular phenotypic response, we simply quantified the neurite outgrowth of PC12 cells using our image-based cell evaluation method. As demonstrated by several image-processing software packages, our image-based method for recognition and quantitation of neurite outgrowth could also successfully profile the PC12 response, 24 even in the presence of lyconadin B. We used our image-based method to evaluate the effective drug concentration and speed of neurite growth. Our data reveal that the median length-to-width ratio of several hundred PC12 cells provides a stable and representative indicator of neurite outgrowth ( Fig. 2B ). Our evaluation of PC12 neurite outgrowth had two important aspects. First, we used a statistical value (median) of several hundred cells to represent a condition, which was important because the numerical conversions of cellular images resulted in measurement with very little deviations. Second, we indicated the continuous profile of time course changes for neurite outgrowth evaluation. By showing a heatmap of continuous time course changes, the same morphological phenomenon could be observed repeatedly. Such repetition enhances the reliability of image-based evaluation results.
Beyond quantifying PC12 outgrowth to screen lyconadin B–like compounds, our goal was to enhance the overall efficacy of a cell-based assay. To this end, we applied our image-based cell evaluation method to analyze morphological differences of 1321N1 cells, which are conventionally used for production of NGF. Surprisingly, even though morphological differences of 1321N1 cells could not be recognized by direct observation, the quantified morphological parameters clearly revealed differences when expressed as profiles ( Fig. 4 ). The transition in the morphological profile revealed that a decrease in cellular area and width, expressed as a statistical feature of several hundred cells, continuously and reproducibly correlated with the induction of NGF by lyconadin B. As far as we know, this is the first report to demonstrate a quantitative correlation between 1321N1 morphology and the induction of NGF expression. The quantitative evaluation of 1321N1 cells, which respond directly to lyconadin B by producing NGF, should greatly reduce the cellular maintenance effort and cost required for massive cell-based screens.
To evaluate the robustness and practicality of this new concept for enhancing the assays for NGF-regulating molecules, we constructed computational prediction models and evaluated their performance ( Fig. 1 and Table 1 ). The morphological profile data from 1321N1 cells (assay part I in Fig. 1 ) were used as “input data,” and computational models were constructed to predict the rate (high/low) of PC12 neurite outgrowth after 5 days ( Tables 1 and 2 ). Because the predictive performance was extremely high (>85.0%), this concept has the potential to drastically accelerate conventional cell assays using both PC12 and 1321N1 cells. Practically, our data show that a conventional assay of 5 days can be shortened to 9 h following drug exposure, a 13-fold reduction relative to the conventional scheme. Regarding the biological mechanism underlying the early morphological responses in 1321N1, we hypothesize that protein kinase C (PKC), whose signal cascade is enhanced by NGF expression, exerts an effect on cytoskeleton-related genes; consistent with this, previous work has shown that PKC is intimately involved in changes in cellular morphology.25,26 Genetic confirmation of the underlying mechanism is an important topic for future study.
In this study, we examined the correlation between the results of our morphology-based method and those of RT-PCR assays. One reason that we did not assess the correlation with ELISA is that the reproducibility of low-dose samples does not yield higher performance than qPCR (data not shown). Overall, taking into account time, cost, and sensitivity, the performance of our method was superior to that of ELISA.
Although we have shown that our image-based analysis can greatly enhance the evaluation of the conventional PC12 neurite outgrowth assay, the present platform (12-well plate) used in this study is not yet suitable for conventional high-throughput screens. When using phase-contrast microscopy images, stable and clear cellular morphological information is difficult to obtain from 96- or 384-well plates due to interference from the liquid surface meniscus. Therefore, at present, our method is effective for secondary or tertiary screens that require delicate assessment of molecular effects. Nonetheless, we believe that our assay scheme, which uses time course cellular information but does not require tracking of individual cells, could facilitate design of more high-throughput assays. To minimize the assay platform for single-cell tracking performance, stricter reproducibility for x-y-z stage positioning and lighting bias correction in the well are commonly required. Such instrumental improvement can reduce the feasibility of introducing a newly developed assay method. However, we are currently seeking to extend our method to a more high-throughput platform by using modified microwell plates to reduce the meniscus.
In summary, based on the advantages of our morphology-based method for cell evaluation, we demonstrated that extremely early screening, using only images of nonstained cells, can be used to detect the NGF-stimulating effect of lyconadin B. Although our main goal was improving screening speed and cost, our next challenge is define our methods’ sensitivity and apply it to higher-throughput assays. It will be also be interesting to further improve our morphological analysis to detect the concentration-dependent effects of other growth factors that enhance neural differentiation. Because our results reveal the possibility of replacing conventional PC12 neurite outgrowth assays, our image-based assay concept can be extended to screening of neurological drug candidates, including libraries derived from lyconadin B and other natural compounds.
Footnotes
Declaration of Conflicting Interests
The authors declared no potential conflicts of interest with respect to the research, authorship, and/or publication of this article.
Funding
The authors disclosed receipt of the following financial support for the research, authorship, and/or publication of this article: financial support was provided by the New Energy and Industrial Technology Development Organization (NEDO) Japan, which provided a grant for Industrial Technology Research (Financial Support to Young Researchers, 09C46036a); the Japan Society for the Promotion of Science (JSPS) (grant no. 258678); and START (Program for Creating STart-ups from Advanced Research and Technology) of the Japan Science and Technology Agency.
References
Supplementary Material
Please find the following supplemental material available below.
For Open Access articles published under a Creative Commons License, all supplemental material carries the same license as the article it is associated with.
For non-Open Access articles published, all supplemental material carries a non-exclusive license, and permission requests for re-use of supplemental material or any part of supplemental material shall be sent directly to the copyright owner as specified in the copyright notice associated with the article.