
Abstract
Nonessential enzymes in the staphylococcal wall teichoic acid (WTA) pathway serve as highly validated β-lactam potentiation targets. MnaA (UDP-GlcNAc 2-epimerase) plays an important role in an early step of WTA biosynthesis by providing an activated form of ManNAc. Identification of a selective MnaA inhibitor would provide a tool to interrogate the contribution of the MnaA enzyme in the WTA pathway as well as serve as an adjuvant to restore β-lactam activity against methicillin-resistant Staphylococcus aureus (MRSA). However, development of an epimerase functional assay can be challenging since both MnaA substrate and product (UDP-GlcNAc/UDP-ManNAc) share an identical molecular weight. Herein, we developed a nuclear magnetic resonance (NMR) functional assay that can be combined with other NMR approaches to triage putative MnaA inhibitors from phenotypic cell-based screening campaigns. In addition, we determined that tunicamycin, a potent WTA pathway inhibitor, inhibits both S. aureus MnaA and a functionally redundant epimerase, Cap5P.
Keywords
Introduction
Antibiotic resistance has become an ever-increasing challenge to human health.
1
One novel strategy to combat resistance is to potentiate the activity of β-lactam antibiotics by targeting nonessential enzymes in early biosynthetic steps in the wall teichoic acid (WTA) pathway, which include TarO, TarA, and MnaA.2–5 Whereas the enzymatic activity of both TarO and TarA in the early biosynthetic events of WTA polymer synthesis is well characterized,4,6 a functional role for MnaA has remained enigmatic. Bioinformatics analyses predict MnaA may serve as an epimerase responsible for the interconversion of UDP-N-acetyl-
Characterizing the enzymatic activity of MnaA and Cap5P is an important first step to developing screening strategies to identify cognate inhibitors of these β-lactam potentiation targets. However, developing a suitable in vitro screening assay for epimerase activity can be challenging. Conventionally, epimerase activity can be measured either directly by combining gas liquid chromatography with mass spectrometry 11 or indirectly in a coupled assay employing a UDP-ManNAc dehydrogenase.12,13 Practically, neither method is well suited for high-throughput screening (HTS). As an alternative, phenotypic screening can be used where the desired activity (e.g., cell death or restored growth) is monitored in a cell-based assay without detailed knowledge of the compound mechanism of action.2,3 However, a commitment to phenotypic screening requires complementary means to subsequently identify the targets of active molecules. Orthogonal assays (using different formats), counterassays, and high-quality biophysical studies on selected targets in the pathway can then be used to demonstrate target-specific binding and activity.
Nuclear magnetic resonance (NMR)–based methods have become well established for the identification and validation of novel drug candidates.14,15 Typical applications include fragment-based screening, binding studies to confirm target engagement, Kd measurements, and mechanism of action studies, including capturing protein conformational changes. Additionally, NMR can provide unique insights into enzymatic reactions by directly monitoring and quantifying the depletion and formation of many of the reaction components by real-time, continuous sampling.16,17 Reaction monitoring by NMR is easily implemented and requires comparably little method development. Significantly, chemical changes to substrate are detected directly and concentration changes are measured quantitatively. Since NMR reaction monitoring relies on detecting changes to specific substrate atoms, it is completely orthogonal to other formats and is particularly useful when the first-tier screening methods either fail or give conflicting results.
In this article, we present a 1H NMR functional assay that can easily differentiate and monitor the interconversion of UDP-GlcNAc substrate and UDP-ManNAc product by MnaA and Cap5P. The NMR assay format is homogenous and allows detection of all the reaction components during the enzymatic reaction. By combining on-target and off-target functional 1H NMR assays with results from ligand and protein-detected NMR binding studies, we were able to create a protocol that can assess the binding and activity of primary screening hits reliably. This combination of NMR methods can be particularly useful to understand the mechanism of action of hits from phenotypic screening, where bioactivity can often be a result of undesirable mechanisms.
Materials and Methods
Gene Synthesis and Subcloning
The entire S. aureus mnaA or cap5P genes were custom synthesized after codon optimization to include a C-terminal 8xHis tag for expression in Escherichia coli. Both genes were flanked with bacteriophage lambda 18 recombination sites attL1 and attL2 (attL1: TGTAAAACGACGGCCAGT CTTAAGCTCGGGCCCCAAATAATGATTTTAT TTTGACTGATAGTGACCTGTTCGTTGCAACAAATT GATGAGCAATGCTTTTTTATAATGCCAACTTTGTAC AAAAAAGCAGGCTCCGCGGCCGCCTTGTTTAACTTTAAGAAGGAGCCCTTCACC; attL2:AAGGGTG GGCGCGCCGACCCAGCTTTCTTGTACAAAGTT GGCATTATAAGAAAGCATTGCTTATCAATTTGTT GCAACGAACAGGTCACTATCAGTCAAAATAA AATCATTATTTGCCATCCAGCTGATATCCCCTATA GTGAGTCGTATTACATGGTCATAGCT GTTT CCTGG) and cloned into the pUC57 vector for recombination into E. coli expression vector pDEST14 (Life Technologies, Carlsbad, CA). Recombination reactions were carried out using Gateway LR Clonase II enzyme mix (Life Technologies), and resultant pDEST14-MnaA or pDEST14-Cap5P expression constructs were isolated and verified by sequence analysis.
Protein Expression and Purification
E. coli BL21 (DE3)-containing expression plasmids pDEST14-MnaA or pDEST14-Cap5P were grown at 37 °C with continuous shaking (300 rpm) in TB medium containing 100 µg of carbenicillin per milliliter. At an optical density value between 0.8 and 1.0 measured at 600 nm, synthesis of MnaA-His8 or Cap5P-His8 was induced with 0.5 mM IPTG. Protein expression was carried out at 16 °C overnight. Cell cultures were harvested by centrifugation (7000g, 15 min at 4 °C) and stored at −80 °C. Frozen cells were thawed at room temperature, resuspended in lysis buffer (50 mM Tris, pH 8.0, 500 mM NaCl, 0.2 mM DTT, 10% glycerol, 0.12 mg/mL lysozyme, protease inhibitor tablet[s] [complete inhibitor tablets without EDTA, Roche, Indianapolis, IN], 10 U/mL DNAse), and lysed in a high-shear fluid processor. The lysate was centrifuged at 80,000g for 45 min at 4 °C and the supernatant was applied to a 3 × 5 mL His Trap FF-crude column (GE Healthcare, Chicago, IL) equilibrated in wash buffer (50 mM Tris, pH 8.0, 500 mM NaCl, 10% glycerol, 0.2 mM DTT, 20 mM imidazole). Protein was eluted with a 15-column volume gradient from 20 to 250 mM imidazole in elution buffer (wash buffer + 230 mM imidazole). Fractions were pooled based on SDS-PAGE analysis. MnaA-His8 or Cap5P-His8 protein was applied to a Superdex 200 26/60 (GE Healthcare) size exclusion column equilibrated in 50 mM HEPES, pH 7.5, 250 mM NaCl, 5% glycerol, and 1 mM DTT. The Superdex 200 column was standardized using Bio-Rad (Hercules, CA) gel filtration standard proteins run under the same conditions. Both proteins eluted as dimers based on a comparison with these standards. Fractions containing MnaA-His8 or Cap5P-His8 protein were pooled based on SDS-PAGE analysis. The identity of purified protein was confirmed by MALDI-MS.
Catalytic Efficiency
Following the optimization of salt concentration and buffer pH, the standard MnaA assay conditions were determined to be 25 mM Tris d11 (Tris[hydroxymethyl-d3]amino-d2-methane; Cambridge Isotope Laboratories, Tewksbury, MA), D2O (deuterium oxide, Cambridge Isotope Laboratories) buffer, pH 8.0, 50 mM NaCl, and 25 µM TSP (3-[trimethylsilyl] tetrapropionate). Assay equilibrium time course was done by mixing twofold serial dilution of MnaA (25–400 nM) with either 200 µM UDP-GlcNAc (forward reaction substrate) or 50 µM UDP-ManNAc (reverse reaction substrate) in the reaction buffer. The reactions were quenched by heating at 80° C for 1 min after incubation over a period of time at 21 °C. For initial velocities and Km determination, we mixed 100 nM of MnaA with various concentrations of substrate (25–250 µM) and set up time points from 0 to 120 min (leaving out the enzyme at t = 0 to correct for background). Product formation was monitored by 1H NMR spectra. The initial velocities of the reactions (v) were plotted against the concentrations of substrate [S], and the data were fit to the Hill equation v = Vmax [S] n /([S] n + Km n ) using (GraphPad Prism 6.04) to find Vmax and Km.
MnaA enzyme activity was monitored directly by 1H NMR. The enzyme assay solutions were prepared in D2O buffer. Five-hundred-microliter reaction solutions were prepared in a 96-well plate (Thermo Matrix deep well 2 mL) containing 100 nM of MnaA and 20 µM of compound, and reactions were initiated by adding 50 µM of UDP-ManNAc. After a 60 min incubation period at 21 °C, the reactions were quenched by heating. The reaction solution was then transferred to a disposable NMR tube (96-SampleJet Tube Block 96 × 5.0 mm [SJT000174]). 1H NMR data were collected at 21 °C on a Bruker (Billerica, MA) 500 MHz NMR spectrometer (AVANCE III) with a 5 mm TXI cryoprobe using IconNMR automation software. Sixty-four scans were acquired for each sample. Excitation sculpting was used for water suppression. Using a SampleJet autosampler, the time duration for sample changing, locking, shimming, and data collection was approximately 7 min per sample, requiring approximately 12 h total for each 96 NMR sample tube rack.
NDM-1 Counterscreening
An NMR counterscreening assay using a β-lactamase enzyme (NDM-1) mirrors the primary MnaA functional assay since it also monitors chemical shift differences between substrate (ampicillin) and product (hydrolyzed ampicillin) by 1H NMR. The NDM-1 reactions were carried out at room temperature in a 100 mM K-phosphate, pH 7.0, D2O buffer, 10 µM ZnSO4 mixed with 1–10 nM NDM-1 and 50–100 µM ampicillin. After a 1 h incubation period, the reaction was quenched by adding 1 mM EDTA. NMR data collection and analysis were carried out as described for MnaA. The Z′ factor for the NDM-1 assay was determined to be 0.82 using data from eight wells containing substrate and enzyme as positive controls and eight wells containing enzyme with no substrate as negative controls.
STD NMR Binding Experiments
Ligand binding was detected by saturation transfer difference (STD) NMR. The binding buffer was similar to the one used for the functional NMR assay (25 mM Tris d11 D2O buffer, pH 8.0, 50 mM NaCl with 25 µM TSP). All STD NMR spectra were collected at 298 K on a Bruker 600 MHz Avance spectrometer. Selective saturation of the protein was applied by switching the on- and off-resonance saturation frequency after each scan. A train of Gaussian shape pulses with 50 ms pulse length (corresponding to an excitation width of 100 Hz) separated by a delay of 1 ms was used, with the total length of the selective saturation set to 3 s, and the on- and off-resonance saturation frequencies set to −120 and 20,000 Hz. The total time to acquire one STD NMR data set, including time to change samples, was 50 min.
Binding Experiments Using Direct Protein Detection
Direct detection of MnaA NMR peaks was measured by using a rapid selective echo sequence centered at 9 ppm. The signal from protein NH, NH2, and aromatic side chains is detected in this experiment. The signal is enhanced by Ernst-angle data acquisition, which allows for reduced relaxation delays of 100 ms and data acquisition times of 40 ms. Selective excitation avoids solvent peaks and many buffer components, refocuses JHNHA couplings and reduces the T1 relaxation time. Although MnaA is an 87 kDa dimer, HN protein peaks can easily be detected in a 5 min experiment using a 5 µM protein sample. The data were collected in a H2O buffer to allow for the detection of exchangeable protons.
NMR Functional Assay
Six hundred individual compounds were selected from phenotypic screening hits for follow-up evaluation using a NMR functional assay to test for the percent inhibition of MnaA enzymatic activity. NMR assays were performed in a standard 96-well plate. Each well in columns 2–12 was filled manually with 300 µL of D2O buffer containing 200 nM MnaA. Column 1 was filled with 300 µL of buffer only and was used as a negative control. One microliter of 100% d6-DMSO (Cambridge Isotope Laboratories) was added to columns 1 and 12 (wells A1–H1 and A12–H12). A Hamilton ML Star Line was used to add 1.00 µL of compound to the remaining wells (A2–H11) and pipetting up and down three times to mix reagents thoroughly (final concentrations are 20 µM compound, 0.2% d6-DMSO). The enzyme reactions were initiated by adding 200 µL of UDP-ManNAc to each well (final concentration 50 µM), and the plate was shaken for 2 min. After 1 h incubation, the reactions were stopped by heating. The contents of each well were then transferred from the 96-well plate to a 96-rack NMR tube using a Gilson 215 liquid handler.
Data Analysis of the NMR Functional Assay
The AMIX (Bruker) software package was used to integrate and normalize each 1H NMR data set. After automatic baseline correction, three target resonance regions were defined as the “TSP reference” region (0.04 to −0.04 ppm), “Substrate” regions (2.07–2.03 ppm), and “Product” region (2.11–2.07 ppm). Once these regions were defined, a large number of enzyme assay spectra were normalized relative to the TSP reference signal at 0 ppm. Percentage inhibition was calculated by comparing the concentrations for samples with inhibitors to those for control samples without inhibitors. The percent inhibition was calculated for each sample based on the following equation: %I = 100*(1 − (Experimental − Background control)/(DMSO control − Background control)). A compound with ≥40% signal inhibition was considered a “hit” in this assay. The hit threshold was set by the signal-to-noise ratio of the NMR signal. Of the 600 phenotypic screening hits, 246 (41%) showed >40% inhibition in the NMR-based assay. A breakdown of activity revealed that 12 compounds showed >90% inhibition, 33 compounds showed > 80% inhibition, 54 compounds showed >70% inhibition, and 86 compounds showed > 60% inhibition. The robustness of the assay assessed by the Z′ factor was determined to be 0.74 using data from eight wells containing substrate and enzyme as positive controls and eight wells containing enzyme with no substrate as negative controls. 19
Results
NMR Functional Assay Development
The interconversion of UDP-GlcNAc to UDP-ManNAc can easily be followed by 1H NMR spectra ( Fig. 1 ). Our NMR data show that both S. aureus UDP-GlcNAc 2-epimerases convert ~10% of UDP-GlcNAc to UDP-ManNAc, which is similar to the 10:1 conversion rates that were observed for S. aureus Cap5P 9 and for E. coli 2-epimerase. 12 While the epimerization reaction may predominantly be driven toward the synthesis of UDP-ManNAc (“forward reaction”) within the bacterial cell, in vitro, the epimerase reaction can also be monitored for UDP-GlcNAc production (“reverse reaction”). The reverse reaction is more amenable for NMR assay development due to a ninefold larger detection window. In the forward reaction, the resonances from UDP-GlcNAc at 2.11–2.07 ppm lose intensity, whereas resonances from UDP-ManNAc (2.07–2.03 ppm) gain intensity. The results are quantitative in that substrate and product peaks can be integrated to directly yield concentrations.
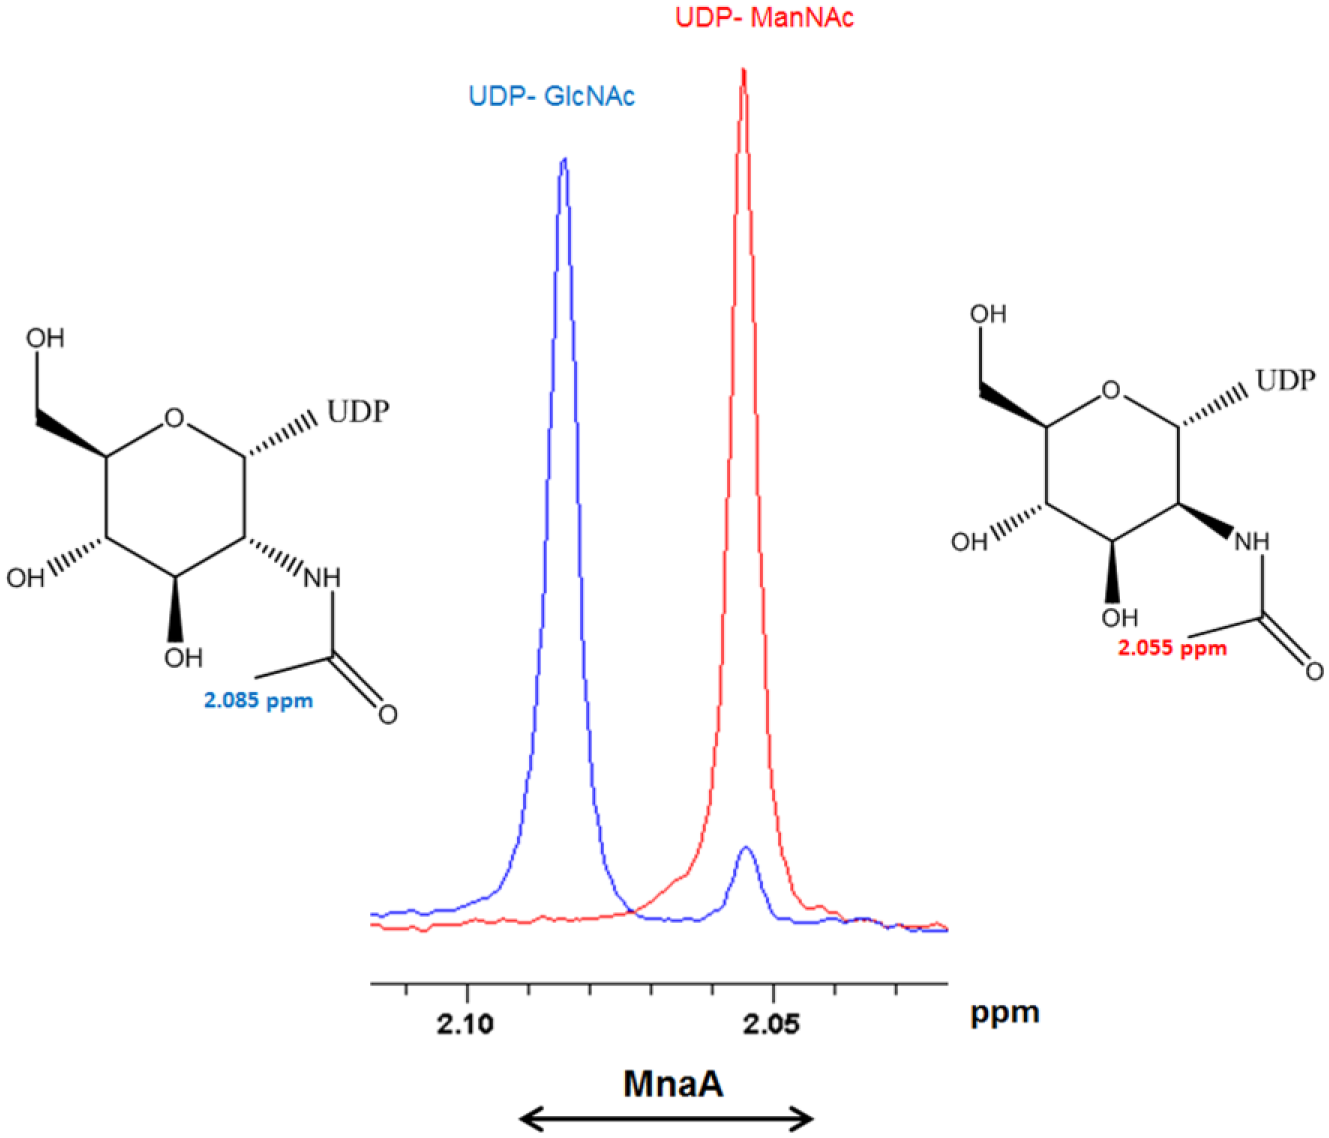
MnaA catalyzes the reversible interconversion of UDP-GlcNAc to UDP-ManNAc. The 2-epimers can be easily distinguished in a 1H NMR spectrum. The N-acetyl region is well resolved and offers high sensitivity.
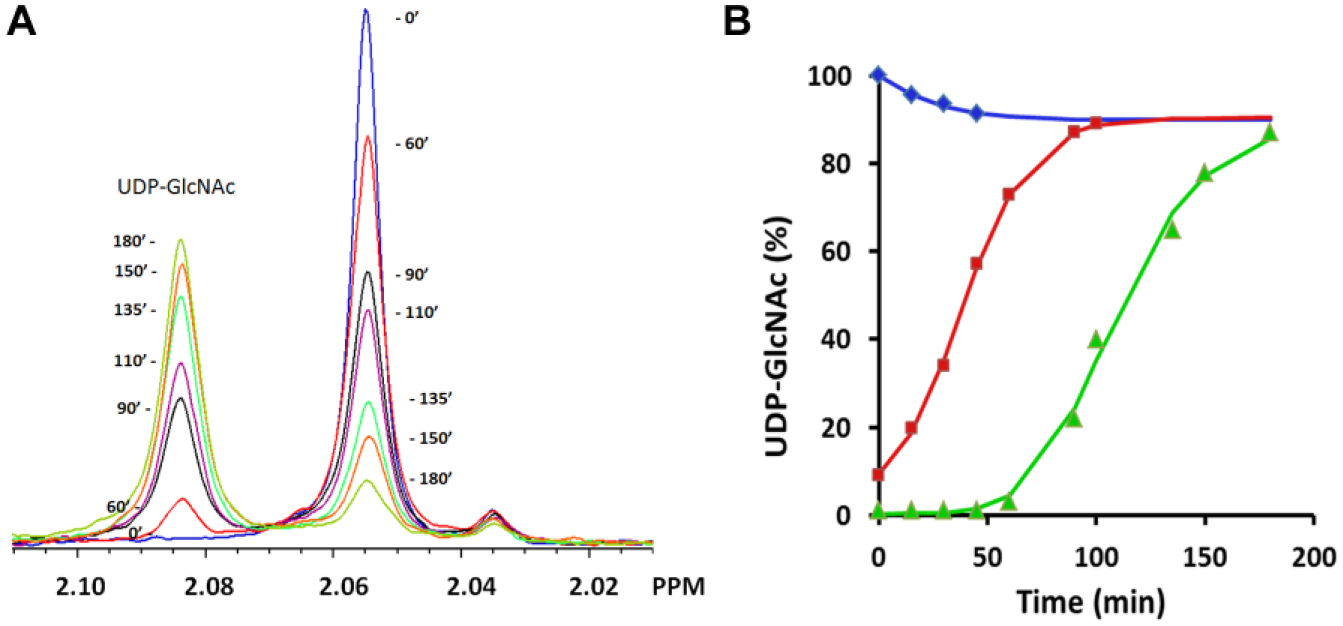
Figure 2A shows NMR data for the time evolution of the reverse MnaA reaction, which was primarily used in this study. The reaction was initiated with 100 nM MnaA and 50 µM UDP-ManNAc and data were collected for 3 h. The NMR peaks for UDP-GlcNAc and UDP-ManNAc can be integrated and compared with an internal TSP standard to quantitatively yield concentrations as a function of time.
(
Figure 2B (green) shows the data for the reverse reaction in Figure 2A plotted as a function of percent UDP-GlcNAc. The reaction was very slow at the beginning, achieving only 3% conversion after 1 h incubation. One of the unique characteristics of MnaA 2-epimerase is the allosteric regulation by its own substrate, UDP-GlcNAc, which acts as an activator.8,12 Crystal structures reveal UDP-GlcNAc bound to both the allosteric and active sites of 2-epimerase, 13 and sequence alignments from several bacterial species confirm that the bacterial UDP-GlcNAc allosteric binding site is conserved. Our observations indicate that staphylococcal MnaA is allosterically regulated by UDP-GlcNAc as well. Figure 2B (red) shows that when 5 µM UDP-GlcNAc was added, the reaction proceeds toward equilibrium with no observed lag time.
Figure 2B (blue) shows the progress of the forward reaction starting with a mixture of 100 nM MnaA and 50 µM UDP-GlcNAc as substrate. The reaction yields ~50% conversion within 15 min and reaches equilibrium after 45 min. The equilibrium concentrations of UDP-GlcNAc and UDP-ManNAc are 90% and 10%, respectively, resulting in a limited assay window for the forward reaction direction.
The kinetic parameters of the S. aureus MnaA UDP-GlcNAc 2-epimerase for the epimerization of UDP-ManNAc were determined using direct NMR detection of UDP-GlcNAc production. Reactions were carried out using 100 nM MnaA, which was low enough to generate a linear signal in a 60 min reaction time. A plot of the initial velocities of the reverse MnaA reaction as a function of UDP-GlcNAc production was sigmoidal (
2-Epimerase Inhibition by UDP and Tunicamycin
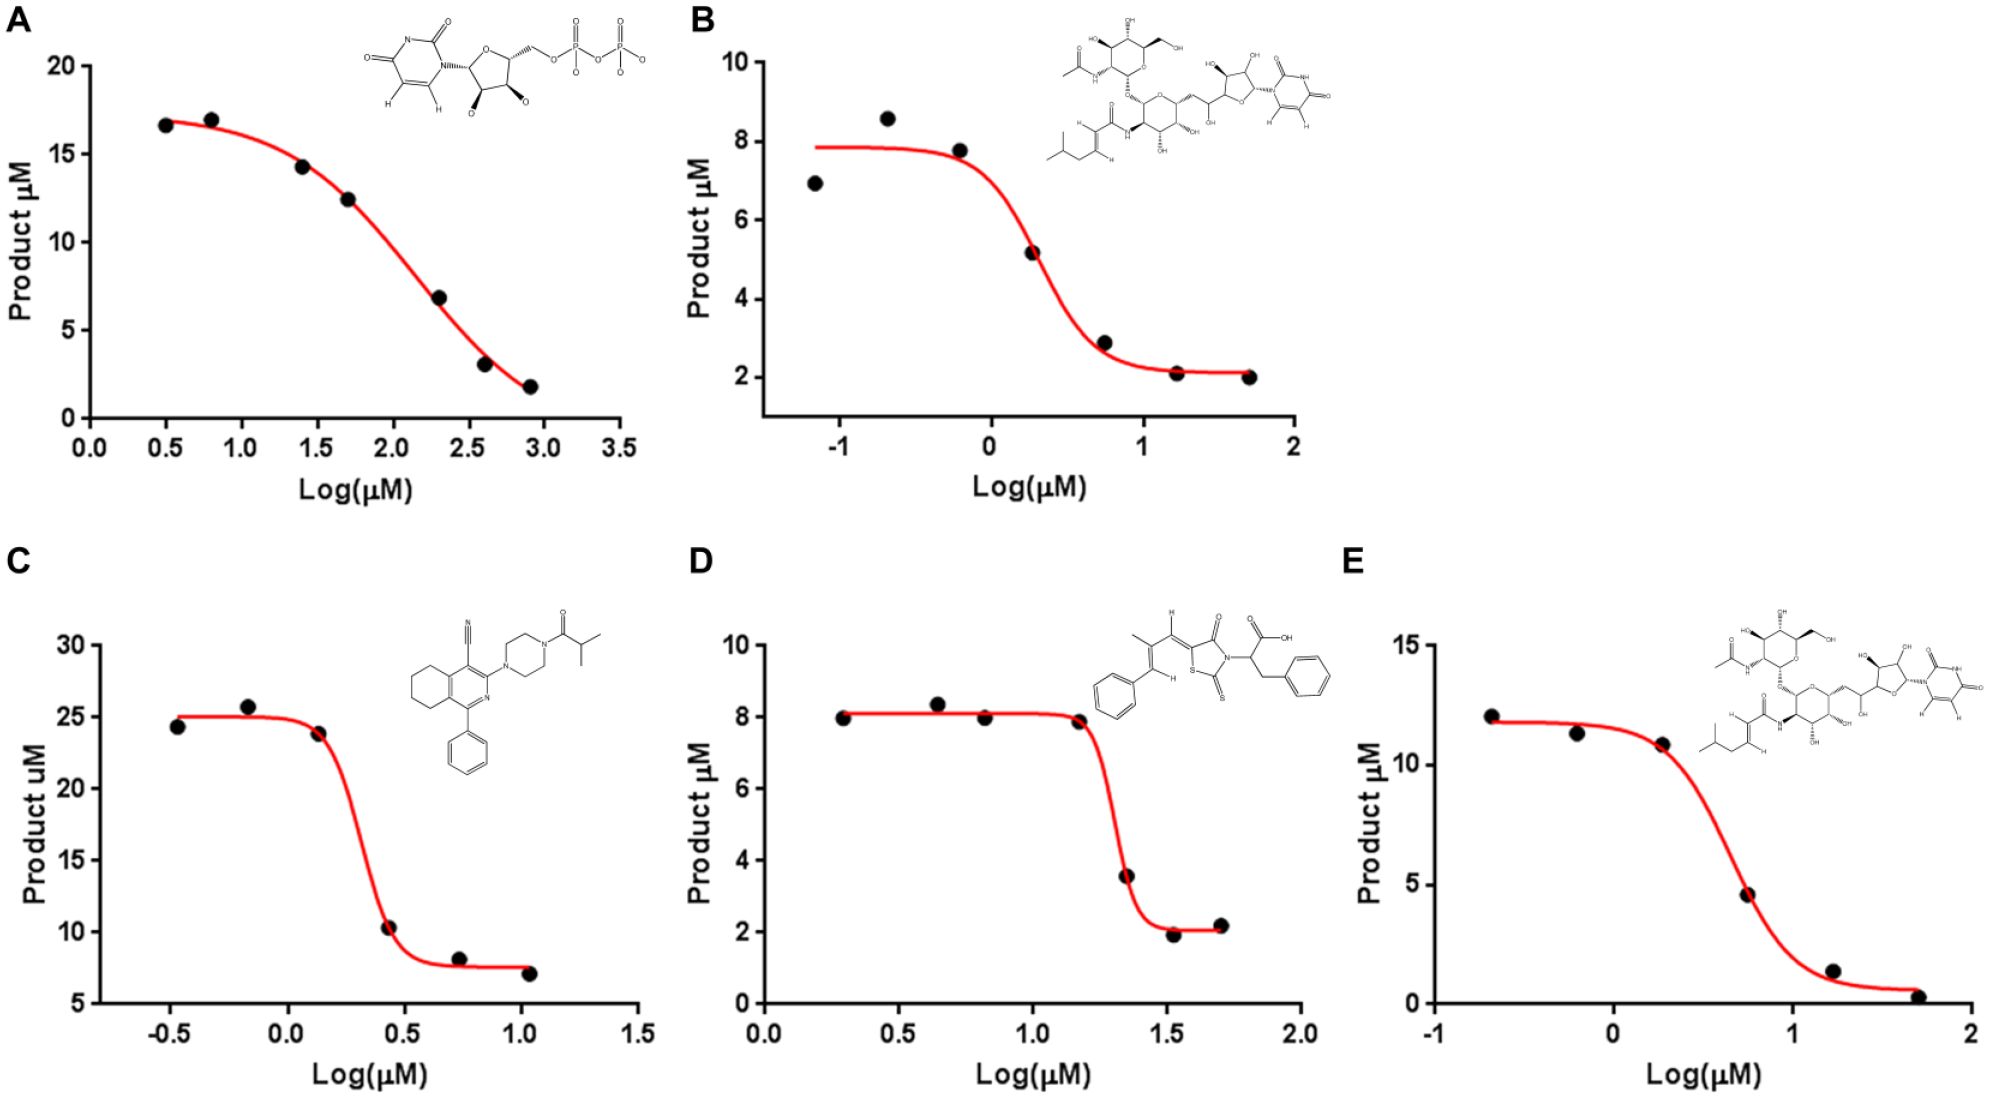
A previous X-ray crystal structure revealed that UDP and UDP-GlcNAc both can bind to the active site of 2-epimerases. 13 We therefore used UDP as a positive control to validate the NMR functional assay. The IC50 dose–response curve in Figure 3A shows that UDP inhibits product formation with an IC50 of 140 µM and a Hill slope of 1.0. The presumptive mechanism is active-site competition, which was later confirmed by competition STD NMR binding studies.
IC50 determination for inhibitors of MnaA (
We also examined the potential tunicamycin inhibition of MnaA and Cap5P. Our reasoning is based on the fact that tunicamycin is a natural product analog of UDP-GlcNAc that broadly inhibits diverse enzyme classes of glycosyltransferases and inhibits TarO activity at submicromolar concentrations.21,22 The data in Figure 3B , E confirm that both 2-epimerase activities of MnaA and Cap5P were blocked by tunicamycin with IC50 values of 2 and 4.5 µM, respectively. Hill slopes of −2.3 and −2.4 are consistent with an allosteric mechanism of action. Note that time-dependent tunicamycin inhibition has been reported against other enzymes and is observed by us for MnaA and Cap5P. Two-hour preincubation times are typically required to achieve maximum inhibition. Tunicamycin is soluble in DMSO and has pH-dependent solubility in aqueous assay buffer. At pH 8.0, the NMR measured solubility was 18 µM in buffer containing 0.2% DMSO. While higher DMSO concentrations can be tolerated by the enzyme, increasing the concentration to 5% did not have an effect on the NMR measured solubility. DMSO concentrations of 0.2% were used for all of the NMR studies.
Confirmation of Phenotypic Screening Hits
A total of 600 compounds were selected from a phenotypic screen designed to identify inhibitors of TarO-, TarA-, or MnaA-mediated early steps in WTA biosynthesis. 24 Each of these compounds was followed up by a single-point percent inhibition determination for the reverse MnaA reaction using a final compound concentration of 20 µM. Each compound was set up with eight positive and eight negative controls in 96-well plate format. We obtained 33 hits with >80% MnaA inhibition and confirmed two lead compounds; one lead compound is shown in Fig. 3C . Compound 1 showed an IC50 of 2.1 µM and a Hill slope of −6.2. The other lead compound (not shown) was deprioritized since it was not a tractable small molecule. Compound 2, shown in Fig. 3D , was not among the initial phenotypic screening hits. It is a rhodanine analog that was identified as a putative 2-epimerase inhibitor by virtual screening. Compound 2 shows an IC50 = 20 µM and a Hill slope of −11. We devote a later section to provide more details on the potential mechanism of action of this compound. The high Hill slopes (observed for compounds 1 and 2) are often associated with bad compound behavior, such as aggregation or multisite binding. Both failed to show activity in an NDM-1 counterassay. In our follow-up NMR studies, we could confirm that compound 2 has an undesirable mechanism that is consistent with the high Hill slope. We did not observe bad behavior for compound 1, and it would therefore be a candidate for further study using gold standard binding studies.
Counterscreen Assay
Nonspecific interactions and chemical modification can destabilize and/or inactivate enzymes, generating a significant source of false-positive hits. 25 In order to identify potential false-positive hits from the functional assay, we chose a functional unrelated enzyme (NDM-1) as a counterscreen assay. Compounds that inhibit the signal in both MnaA functional assay and NDM-1 counterassay likely represent nonspecific inhibitors that could reduce the signal simply by changing protein stabilities. Out of the 80 most potent screening hits, all with >60% MnaA inhibition, only 12 compounds were inactive in the NDM-1 counterassay. The prevalence of nonspecific inhibitors highlights the challenges of identifying leads from phenotypic screens of antibacterial targets, as well as an overreliance on solely utilizing in vitro biochemical screens. These results also highlight the need for robust biophysical characterization. In the NDM-1 counterassay, tunicamycin, when tested at a single 20 µM concentration, shows only 8% inhibition using a 2 h preincubation period. Compounds 1 and 2 showed 5% and 78% inhibition of NDM-1 when tested at a single 20 µM concentration. While tunicamycin, compound 1, and compound 2 have large negative Hill slopes in the MnaA IC50 measurements, only compound 2 shows activity against NDM-1.
Substrate and Tunicamycin Binding Studies
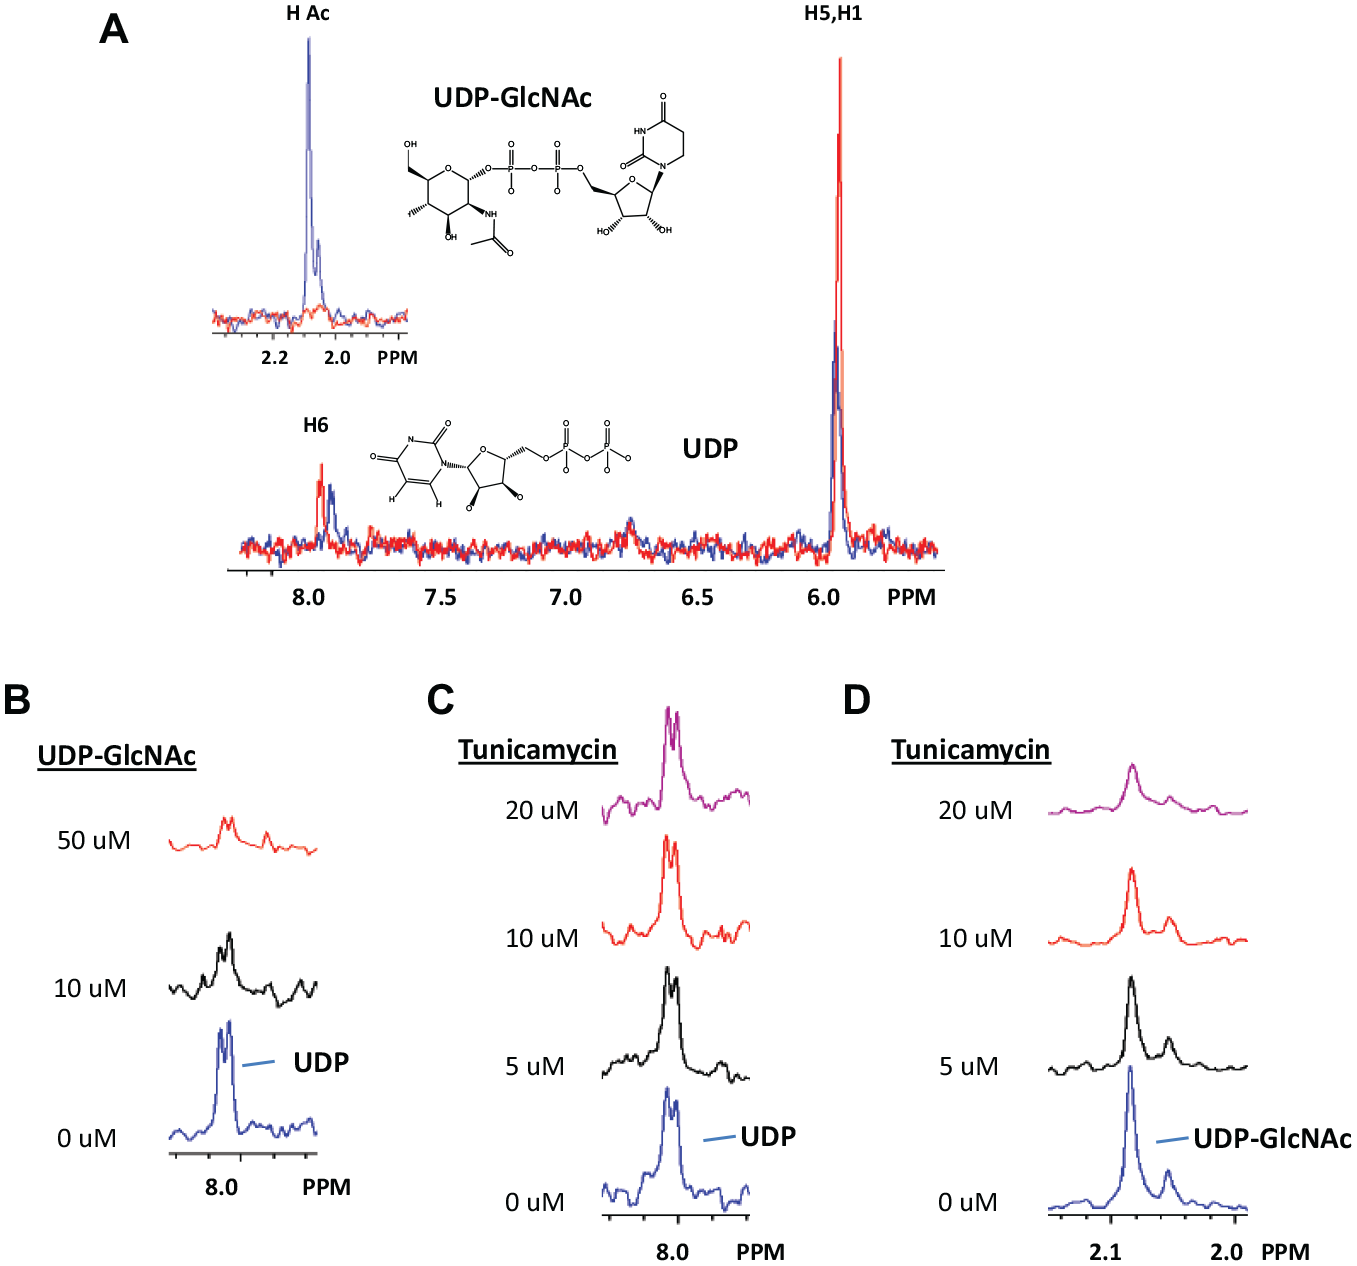
STD NMR binding studies were used to indirectly detect substrate and ligand binding to MnaA. This method captures small intensity differences (from radiofrequency protein saturation) in the free ligand NMR spectrum that arise from protein binding. Typical STD NMR experiments are performed with protein ligand mixtures using ligands that are in 10- to 100-fold excess. Typical results show ligand NMR peaks for ligands that bind with Kd values in the micromolar to millimolar range. No protein NMR peaks are detected in these measurements. Control experiments, with ligand and no protein, should contain no NMR peaks. X-ray crystal structures have shown that UDP and UDP-GlcNAc bind to UDP-GlcNAc 2-epimerase to form a ternary complex, and the binding of UDP-GlcNAc is associated with conformational changes in the active site of epimerase.13,26 The structure of the nonhydrolyzing UDP-GlcNAc from Bacillus anthracis shows UDP bound to the active site and an adjacently bound UDP-GlcNAc molecule. 13 We anticipate that STD NMR signals from UDP-GlcNAc could originate from binding to either the allosteric or active sites, while UDP binding in the presence of UDP-GlcNAc would come from active-site binding. Figure 4A (red) shows the STD signal from UDP binding that is consistent with the weak interaction suggested by the UDP IC50 = 140 µM. The NMR peaks near 8 ppm are from uridine-H6, while peaks near 6 ppm are overlapped H5 and H1′ protons. Figure 4A (blue) shows the STD NMR signal from MnaA-UDP-GlcNAc binding. Additional GlcNAc and ManNAc peaks are labeled. The spectra in Figure 4A provide references for further binding and mechanism of action studies. In Figure 4B , UDP binding is strongly affected by addition of UDP-GlcNAc. At low concentration, UDP-GlcNAc binds to the allosteric site and activates the enzyme. At higher UDP-GlcNAc concentrations, the active enzyme binds UDP-GlcNAc to the active site, replacing UDP and initiating the forward reaction. These observations suggest that UDP-GlcNAc as an epimerase activator could trigger an active-site conformational change that strongly affects UDP binding.
STD NMR binding and competition results for MnaA product, substrate, and inhibitors. (
The effect of tunicamycin addition on the binding of soluble reaction product and substrate is easily obtained through competition STD NMR. Figure 4C , D shows competition STD NMR data for tunicamycin added to mixtures MnaA-UDP and MnaA-UDP-GlcNAc, respectively. Tunicamycin addition greatly reduces the UDP-GlcNAc STD NMR signal, but the UDP STD NMR signal is unaffected. These results are consistent with tunicamycin binding to the allosteric site of MnaA, locking the enzyme into an inactive conformation that allows active-site entry of UDP, but not UDP-GlcNAc.
Binding Studies for Screening Hits
Once the STD NMR and competition STD NMR binding studies were established using UDP and substrate, we tested 21 of the 80 most potent phenotypic screening hits for binding to MnaA and for competition binding versus substrate. All 21 compounds showed >60% inhibition in the MnaA NMR assay. Ten of the 21 showed low (<6%) inhibition in the NDM-1 counterscreen, while the remaining 11 showed >50% inhibition. Six out of the 10 NDM-1 negative compounds showed STD NMR binding signals to MnaA and, in competition STD NMR studies, affected the binding of UDP-GlcNAc. Only 1 out of the 11 NDM-1 positive compounds showed STD NMR binding signals to MnaA and, in competition STD NMR studies, failed to affect UDP-GlcNAc binding. Compound 1, compound 2, and tunicamycin all showed MnaA binding by STD NMR and affected UDP-GlcNAc binding to MnaA. The observation of STD NMR binding was generally associated with lack of off-target inhibition of NDM-1 and good aqueous solubility.
Target Engagement from Direct Protein Binding Studies
STD NMR is a powerful, convenient, and often used method to demonstrate weak compound binding. It relies on measuring small changes in the ligand NMR signal to indirectly detect ligand binding and is not necessarily well suited to distinguish specific from nonspecific interactions. Competition STD NMR methods can be used to increase the confidence that the hit is real, but compounds that destabilize the protein can mimic the effect of a competitor. It is best to use multiple orthogonal methods such as isothermal titration calorimetry (ITC), differential scanning calorimetry (DSC), surface plasmon resonance (SPR), or heteronuclear single quantum coherence (HSQC)-NMR to characterize the binding of compounds with complicated mechanisms of action. Ideally, hits are followed up by gold standard direct binding methods (e.g., HSQC NMR) that identify site-specific binding by detecting protein NMR peak shifts caused by ligand binding. The 87 kDa size and the lack of isotope-enriched protein rule out these types of measurements for MnaA. As an alternative, we turned to direct observation of protein protons to capture low-resolution structural information. In Figure 5 , we demonstrate the use of rapid selective echo experiments to amplify the NMR signal from amide, aromatic, and side chain NH2 protons of MnaA, allowing direct protein detection of unlabeled protein at low micromolar concentrations. These measurements can be made with high sensitivity and shifts to a subset of protein peaks can, in favorable cases, be distinguished. Data collected for free protein (red) are compared with data from mixtures of a protein–ligand complex (blue). Peak changes such as splitting or shifting indicate ligand binding. No binding would produce identical spectra. All experiments were performed in H2O buffer, using 5 µM protein and 100 µM of each ligand. We focused on changes to the amide proton region since these peaks are distributed throughout the protein and the chemical shift dispersion is large. Binding was observed for UDP ( Fig. 5A ), tunicamycin ( Fig. 5B ), and compound 1 ( Fig. 5C ). MnaA 1H NMR data for compound 2 binding ( Fig. 5D ) was dramatically different, as nearly all of the protein NMR peaks had coalesced. Generally, protein 1H spectra are complicated and unresolved for large proteins and detailed analysis is challenging. However, low-resolution structural data are easily obtained and can inform on the protein stability, folding, and aggregation. MnaA 1H NMR data collected in solution with compound 2 show strong evidence that compound 2 affects MnaA solution stability. Figure 4C shows that the effect of compound 1 addition yielded small changes to the protein spectrum that are qualitatively similar to changes observed by the addition of UDP and UDP-GlcNAc.
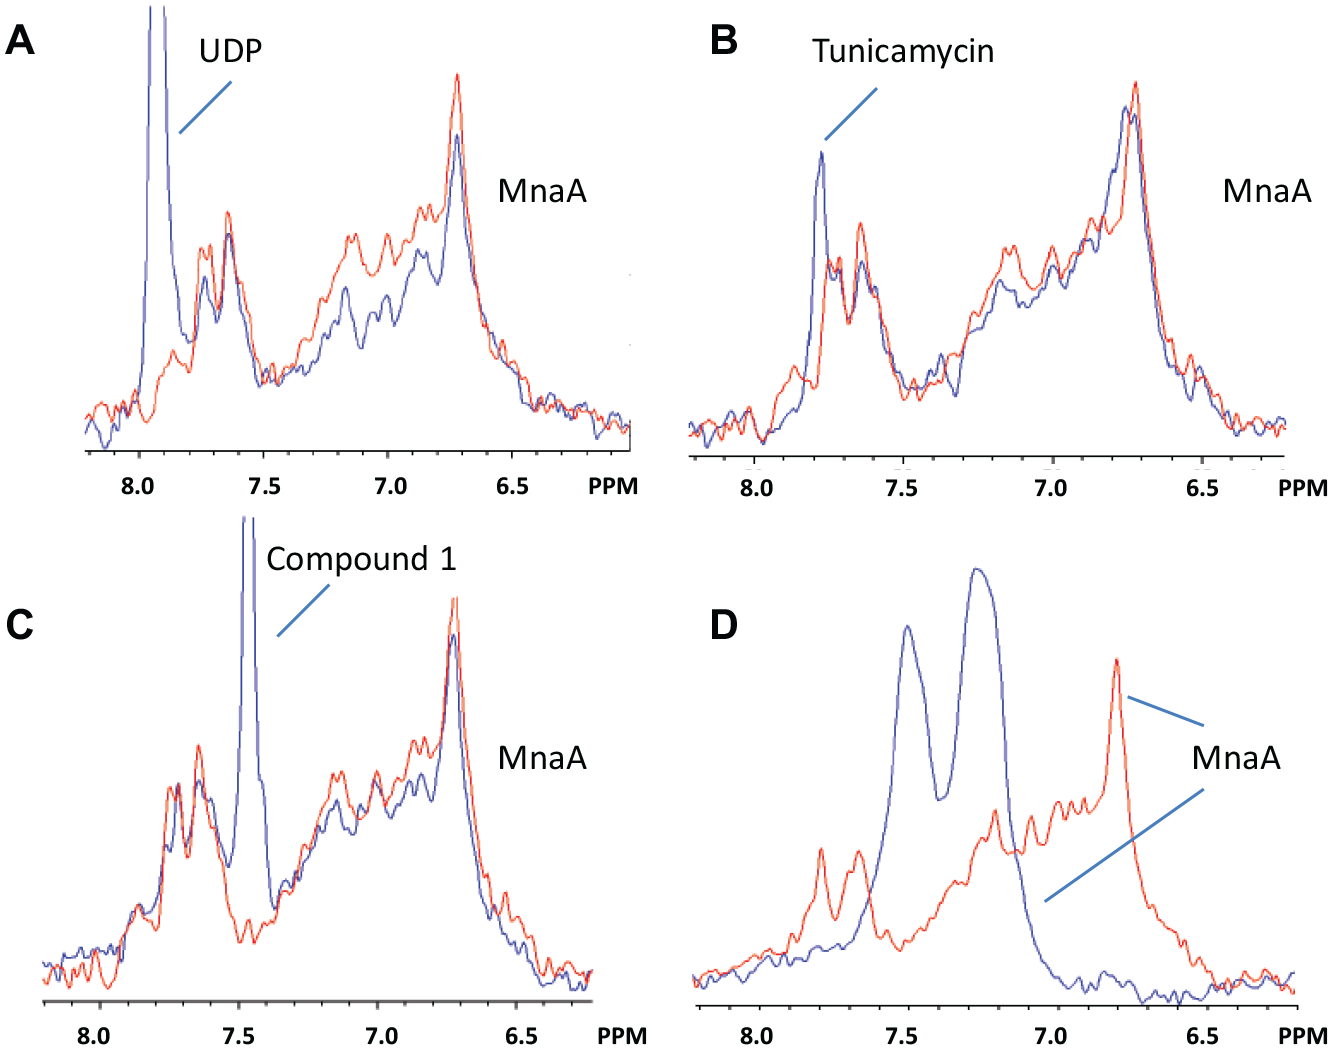
The proton NMR peaks for a solution containing 5 µM MnaA alone (red) are compared with the proton NMR peaks from a solution of 5 µM MnaA with compound added (blue). Compounds are (
Rhodanine Binding and Activity
Scaffolds with the rhodanine five-membered multiheterocyclic core have been reported to inhibit bacterial 2-epimerase activity in both cell culture and biochemical assays. 27 These compounds were initially selected from virtual screens and were evaluated in silico for druglike properties. A rhodanine lead compound was created by merging structural features with other hit series. Further optimization yielded a 2-thioxoimidazolidine series that has been shown to have widespread activity against Gram-positive bacteria. While potential rhodanine promiscuity has been suggested, extensive comparisons with other five-membered multiheterocyclic cores, including in hydantoins, did not find a tendency toward rhodanine reactivity or aggregation. The NMR approaches that we have developed to triage phenotypic screening hits have also been applied to understand the mechanism of action of rhodanine hits. Compound 2 ( Fig. 3D ) was found to inhibit the reverse MnaA reaction with an IC50 of 20 µM but with a very high Hill slope of −11. Competition STD NMR binding studies indicated that compound 2 binding affected both UDP and UDP-GlcNAc binding to MnaA (data not shown). However, direct detection of protein NMR signals using a rapid selective spin-echo experiment showed that compound 2 causes a collapse of all protein NMR peaks ( Fig. 5D ). Even though this analog shows enzyme inhibition and affects the binding of substrate, the direct protein detection experiment strongly suggests an undesirable mechanism leading to protein destabilization.
Discussion
In this work, we have used NMR-based methods to assess the binding and activity of potential MnaA inhibitors and used these methods to triage hits from phenotypic screening, identify WTA pathway inhibitor tunicamycin as an inhibitor of 2-epimerases MnaA and Cap5P, and study the behavior of analogs of a putative inhibitor from virtual screening.
NMR assays of evolving reactions are particularly powerful as structural changes to the substrate are directly detected. Product and reactant can be studied simultaneously and their concentrations can be measured directly. These are label-free, homogeneous assays. They required very little development and are not prone to compound-related interference. In the case of monitoring the products of 2-epimerase reactions, the products and reactants have the same molecular weight and are not easily distinguished. The NMR spectra, however, are very different and analysis is very simple. NMR measurements typically require substrate concentrations in the micromolar to millimolar range to be easily detected. The effect of compound addition on enzyme activity can still involve an undesirable mechanism, so we turn to STD NMR binding studies to confirm binding, competition STD NMR experiments to assess mechanism of action, and direct protein detection to make sure that the action of the compound is not to degrade or destabilize the protein.
Phenotypic screening has been a rich source of therapeutic compounds that reach the clinic with reduced discovery and development timelines. 28 Phenotypic hits yield the desired cell response while bypassing complicated assay development and target validation. While target identification is not necessarily required to advance a phenotypic hit to a lead series, in vitro assays of compound activity against specific targets allow clear SAR to be developed toward increasing potency and selectivity. Targets can be identified using biophysical/biochemical approaches (affinity-based chemical proteomics) or genetics-based approaches that, for example, combine resistance mutant selection with validation by next-generation sequencing (NGS) whole genome mapping.
The methods that we have outlined provide further biophysical characterization of phenotypic screening hits. Low solubility is a common feature for antibacterial phenotypic screening hits. When the compound aqueous solubility is the same or less than the measured potency, concerns are raised about whether its activity is target specific. Taken together, the methods we have outlined in this article represent a general protocol that will allow a more thorough assessment of the binding and activity of a wide variety of phenotypic hits to their putative targets (
Footnotes
Declaration of Conflicting Interests
The authors declared no potential conflicts of interest with respect to the research, authorship, and/or publication of this article.
Funding
The authors received no financial support for the research, authorship, and/or publication of this article.
References
Supplementary Material
Please find the following supplemental material available below.
For Open Access articles published under a Creative Commons License, all supplemental material carries the same license as the article it is associated with.
For non-Open Access articles published, all supplemental material carries a non-exclusive license, and permission requests for re-use of supplemental material or any part of supplemental material shall be sent directly to the copyright owner as specified in the copyright notice associated with the article.