
Abstract
Multiple sclerosis (MS) is an autoimmune neurodegenerative disease that involves activation of T cells, microglia, and astrocytes. There is a clear unmet medical need for MS, as current therapies reduce the relapse rate, but are unable to prevent the neurological deterioration. Leukemia inhibitory factor (LIF) is a proinflammatory cytokine that can also positively modulate the immune response, by inducing the inhibition of myelin-reactive TH17 differentiation, and by promoting oligodendrocyte-mediated myelination. The aim of this project was to find central nervous system (CNS)–permeable and orally available small molecules that upregulate production of endogenous LIF. We describe here the development of a phenotypic assay and screening of 1.7 million compounds to identify LIF enhancers using U87 MG cells. Five chemically tractable series of compounds and a few singletons were selected for further progression. Some of them were also active in a different LIF-expressing cell line and in primary rat astrocytes. Although further studies would be required to deconvolute the targets involved in LIF induction and to confirm activity of hits in more disease-relevant assays, our results have demonstrated the potential of the phenotypic approach to identify specific and chemically tractable small molecules that trigger the production of LIF in relevant cell lines.
Introduction
Multiple sclerosis (MS) is a devastating neurodegenerative disorder. MS has an inflammatory component, characterized by focal areas of inflammation in which myelin and myelin-producing cells, the oligodendrocytes, are destroyed. Most of the current therapies are based on modulation of the immune response that can reduce the relapse rate, but are unable to prevent neurological deterioration.1–3
Leukemia inhibitory factor (LIF) is a member of the interleukin-6 (IL-6) family for which many different biological activities have been described, including cell proliferation, differentiation, and survival. 4 In MS, macrophages and T cells secrete LIF. 5 LIF is undetectable in the nervous system under physiological conditions. The expression of LIF increases after neuronal damage in ischemia, 6 spinal cord injury, 7 MS lesions, 8 and the hippocampus of patients with Alzheimer’s and Parkinson’s diseases. 9 It is currently believed that LIF is part of an endogenous neuroprotection system that limits neurological injury. 8 LIF can induce axonal regeneration and protects against demyelination 10 and enhances remyelination. 11
The relationship of LIF with neurological deterioration and its potential application for the treatment of neurological disorders, including MS, is broadly documented in the literature. In addition to its role in the modulation of the immune response, accumulated evidence indicates a central role for LIF in myelin repair. The natural repair pathway for remyelination of demyelinated axons involves endogenous oligodendrocyte precursor cell (OPC) proliferation and migration to the damaged areas, where they differentiate into mature oligodendrocytes. In MS, this repair process fails, and thus the crucial role of LIF promoting maturation of OPCs. 13
We hypothesize that pharmacological agents that activate LIF signaling could potentially be beneficial for the treatment of MS and other inflammatory neurodegenerative diseases.
All members of the IL-6 family share the common signal-transducing receptor glycoprotein 130 (gp130) combined with another signal-transducing receptor (LIFR or OSMR) or with a nonsignaling receptor (IL-6R, IL-11R, or CNTFR). Due to the structural and functional complexity of LIFR, 12 pharmacological modulation of LIF activity with compounds that interact directly with the LIFR, such as classical agonists or allosteric modulators, would be challenging. A molecule that enhances production of LIF at neurodegeneration sites would be a preferred approach to modulate LIF-mediated responses.
LIF is a 180-residue glycoprotein, synthesized as a 202-residue precursor that is posttranslationally processed by removal of 22 residues from its N-terminus. The LIF structure has been solved by X-ray crystallography. Monoclonal antibodies are available and enzyme-linked immunosorbent assay (ELISA)–type assays have been developed and validated to quantify human LIF production in physiological fluids. 14 Although the sensitivity of these assays is sufficient for pharmacological screening purposes, their throughput limits the possibility of testing a massive number of compounds. We describe here the successful development and validation of a phenotypic assay, amenable for high-throughput screening (HTS) in 1536-well plates to measure the accumulation of LIF in the culture medium of U87-MG cells. We also screened a collection of 1.7 million small molecules, and identified several series of validated and chemically tractable hits.
Materials and Methods
Materials
U87-MG and HEK-293 cells were purchased from the American Type Culture Collection (ATTC) (HTB-14 and CRL-1573, respectively). Culture media were from Invitrogen (Waltham, MA). Human LIF ELISA kit, human LIF IgG2B monoclonal antibody from mouse, and biotinylated human LIF IgG polyclonal antibody from goat were from R&D System (Minneapolis, MN). Rat LIF ELISA kit was from Cusabio (Wuhan, China). AlphaScreen protein A acceptor beads and AlphaScreen streptavidin-coated donor beads were from PerkinElmer (Waltham, MA). The rest of reagents were from Sigma-Aldrich (St. Louis, MO) of the highest possible purity.
Methods
U87-MG Cells’ AlphaScreen Assay Development
For the LIF standard curve, 500 nL of 10× LIF titration in Dulbecco’s modified Eagle’s medium–fetal bovine serum (DMEM-FBS) was added to all wells in the presence of 5 µL of U87-MG cells. AlphaScreen signal was developed by adding 2 µL of acceptor bead mixture, containing 5 μg/mL human LIF monoclonal antibody, 0.33 μg/mL biotinylated human LIF polyclonal antibody, and 50 μg/mL AlphaScreen protein A acceptor beads in 25 mM HEPES, pH 7.4, and 2 µL donor bead mixture, containing 100 μg/mL AlphaScreen streptavidin donor beads in 25 mM HEPES, pH 7.4, separated by a 1 h incubation at room temperature. The AlphaScreen signal was read in the Envision Multilabel Reader (PerkinElmer) after 2 h of incubation at room temperature and protecting plates from light. Comparative LIF productions by U87-MG cells were performed exposing 5 µL of cells (5000 cells/well) to either 100 ng/mL tumor necrosis factor alpha (TNF-α) or 100 nM phorbol 12-myristate 13-acetate (PMA) during 24 h at 37 °C and 5% CO2. Previously, cells were grown to 80%–90% confluence in DMEM with 10% FBS, trypsinized, and resuspended in DMEM without phenol red with 10% FBS to 106 cells/mL. After incubation with test compound, LIF was quantified with the standard ELISA 14 using the human LIF ELISA kit, as described by the vendor, and using the AlphaScreen assay as described above. For PMA titrations, 350 nL (384-well) or 50 nL (1536-well) of 100-fold concentrated PMA in DMSO was added onto 35 µL (384-well) or 5 µL (1536-well) of cells and incubated overnight as described previously. AlphaScreen signal was developed by adding 20 or 2 µL of acceptor mixture and 20 or 2 µL donor mixture, for 384- and 1536-well plates, respectively, and read in the Envision Multilabel Reader. For the secondary assay, U87-MG cells were replaced with HEK-293 cells, maintaining similar assay procedures. HEK-293 cells were cultured under standard conditions. LIF at 5 pg/mL was added onto control wells to simulate LIF production. In all cases, AlphaScreen mixtures and cells were dispensed with Multidrop Combi (Thermo Fisher Scientific, Waltham, MA). Low-volume dispensing of compounds was performed using acoustic droplet ejection with an Echo liquid handler (Labcyte, Sunnyvale, CA).
Identification of LIF Enhancers in U87-MG Cells by HTS Using the AlphaScreen Assay
Fifty nanoliters of 100× compound either at 1 mM (single-shot experiments, 10 µM final concentration) or in threefold serial dilutions from 10 mM (full-curve experiments, from 100 µM top final concentration) in 100% (v/v) DMSO were predispensed in 1536-well plates. Negative controls were prepared in columns 11 and 12 adding 50 nL of DMSO, and positive controls were placed in columns 35 and 36 by addition of 50 nL of 10 µM PMA in DMSO. Then, 2 µL of cells prepared as previously described was added onto all wells and incubated overnight to identify enhancers of the extracellular production of soluble LIF. After the overnight exposure, AlphaScreen signal was developed following procedures stated above. Data were processed with ActivityBase (IDBS, Guildford, UK). AlphaScreen data were collected from the Envision Multilabel Reader, and the response was calculated for each well as follows: %Activation = 100 − 100*(valuesample − meanNegative Ctrl)/ (meanPositive Ctrl − meanNegative Ctrl). The quality of the assay was assessed for each screening plate by determination of the Z′ factor. 15 It was calculated according to the following equation: Z′ = 1 − [(3*SDPositive Ctrl + 3*SDNegative Ctrl)/(meanPositive Ctrl − meanNegative Ctrl)]. The selection threshold for positive compounds during the HTS was calculated for each experimental block as Meaninactive samples + (3*SDinactive samples). Confirmed hits were progressed to full-curve experiments to determine EC50 values, defined as the concentration of compound required to activate LIF production from basal reference by 50%. EC50 values were calculated according to the following equation: Y = Min + [(Max − Min)/(1 + (X/EC50)−HillCoefficient]. pEC50 values are defined as the negative log of EC50 expressed in molar units.
Hit Confirmation in U87-MG and WM-115 Cells and Astrocytes
Two hundred selected HTS hits were confirmed in a single-shot experiment at 10 µM through three different assays: U87-MG cell-based AlphaScreen and ELISAs, and WM-115 cell-based AlphaScreen assay. WM-115 cells were prepared following similar procedures as described for U87 cells. Compounds were incubated overnight with 35 µL of cells (1000 cells/well). After overnight incubation, 20 µL of supernatants was transferred to a new 384-well plate to quantify LIF production. AlphaScreen signal was developed following the same procedures as described above for the 384-well plate assay format. In this case, acceptor and donor bead mixtures were prepared in AlphaScreen detection buffer containing 0.5% (w/v) Triton X-100, 1 mg/mL dextran 500, and 0.1% (w/v) bovine serum albumin (BSA) in 25 mM HEPES, pH 7.4. Compounds showing statistically significant enhancement in the WM-115 cell-based AlphaScreen assay (established as a response higher than meanNegative Ctrl + 3*SDNegative Ctrl) were considered confirmed hits and progressed to full-curve experiments in U87-MG and WM-115 cell-based AlphaScreen assays and primary astrocytes from rat in ELISA.
Astrocytes were isolated from postnatal day 1 Sprague–Dawley (male) rat cortex. Meninges-free cortex was collected on ice-cold DMEM, minced into small pieces, triturated, and filtered through a 70 μm cell strainer. Cells collected in DMEM were centrifuged at 1050 rpm and 4 °C for 5 min and resuspended in DMEM-20S containing 20% FBS, 2 mM GlutaMAX-I, 5 mM sodium pyruvate, and 100 U/mL penicillin-streptomycin and transferred onto poly-
A total of 2 × 10⁴ rat astrocyte cells/well were seeded in a 96-well plate and treated with 2% of FBS medium for starvation overnight 6 h after cells adhering to the wells. Then, cells were treated with different concentrations of compound (30, 10, 3, 1, 0.3, 0.1, and 0.03 µM) and 1 µM PMA as positive control for 24, 48, and 60 h. Cell supernatant was harvested for ELISA using the rat LIF ELISA kit as described by the vendor. Physicochemical properties (molecular weight [MW], predicted partition coefficient logarithm [clogP], and property forecast index [PFI]) were predicted with the GSK proprietary analysis tool SIV Properties Calculator, provided by ChemAxon (Budapest, Hungary).
Results
U87-MG Cells’ AlphaScreen Assay Development
The LIF quantification assay for HTS was developed by modifying a low-throughput heterogeneous ELISA and converting into a high-throughput, low-volume, homogeneous AlphaScreen assay. To establish the final assay conditions, concentrations of antibodies, AlphaScreen beads, composition of the culture medium, and cell density were optimized to generate the best signal/background ratios, while maintaining an appropriate dynamic range. As expected for an antibody-based assay, the signal/background ratio was strongly dependent on the relative concentration of antibodies. The highest values were achieved with higher ratios of human LIF monoclonal (5 µg/mL) and biotinylated human LIF polyclonal (0.33 µg/mL) antibodies ( Fig. 1A ). On the other hand, signal/background ratios were similar in the range of concentrations of AlphaScreen beads recommended by the vendor, so 50 μg/mL AlphaScreen protein A acceptor beads and 100 μg/mL AlphaScreen streptavidin donor beads were chosen ( Fig. 1B ). Signal/background ratio also increased with increasing concentrations of cells per well, and adding FBS to DMEM (data not shown). In the presence of U87-MG cells and under described conditions, the AlphaScreen assay was capable of quantifying soluble LIF in cellular supernatants within a linear range from 1 to 50 pg/mL ( Fig. 1C ). According to this standard curve, 10-fold signal increases over the basal level could be quantified in cell cultures producing LIF.
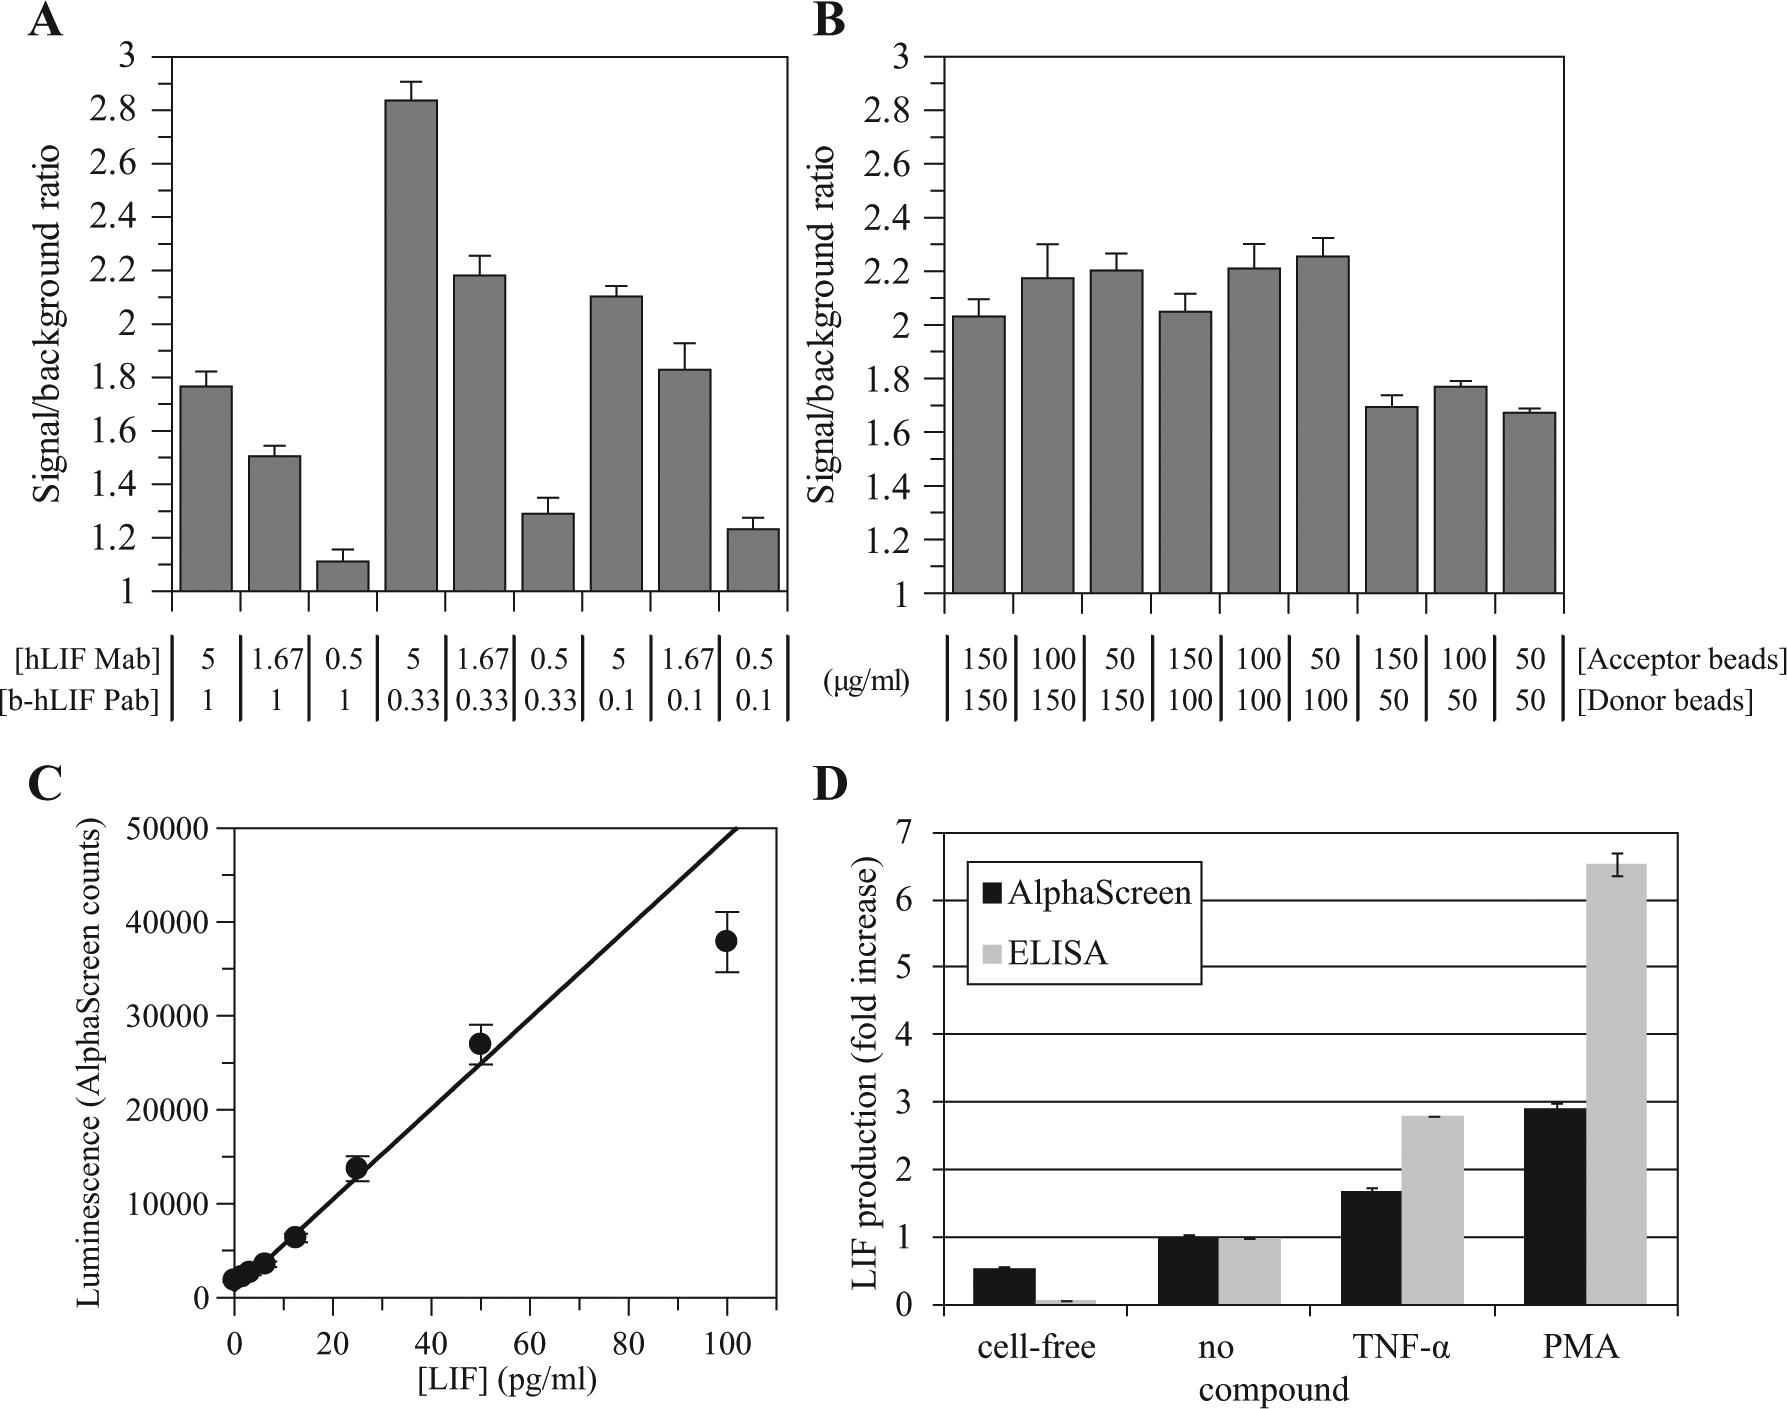
Signal/background ratios at different (
In the presence of stimulators of cellular growth, the AlphaScreen assay was able to detect and quantify increases of LIF production in cellular culture supernatants with good correlation when compared to the well-established ELISA method ( Fig. 1D ). Experimental data indicate that 100 ng/mL TNF-α and 100 nM PMA were able to stimulate LIF production 1.7- and 2.9-fold, when compared to the basal signal from nonstimulated U87-MG cells. These signal increases were lower than the ones described for ELISA (2.8- and 6.5-fold, respectively), but AlphaScreen data demonstrated to be sufficiently robust, enabling the use of any of the two enhancers as positive stimulation controls for an HTS assay. Maximum stimulation of U87-MG cells was later increased from 2.9- to 4.1-fold over the basal signal after AlphaScreen buffer optimization and miniaturization. LIF induction by differentiation enhancers such as TNF-α and PMA has been broadly reported previously.
Originally, the assay was developed in 384-well microtiter plates, 40 µL/well final assay volume, with an intermediate cell supernatant transfer step. Later, it was further miniaturized and adapted to HTS conditions in 1536-well microtiter plates in a final volume of 9 µL. Final assay was used in a homogenous format avoiding the transfer step, as LIF quantification was demonstrated to be feasible even in the presence of cells. Sensitivity to PMA did not change during assay miniaturization, showing a constant EC50 of around 1 nM ( Fig. 2 ), and 100 nM PMA was established as 100% stimulation control for hit identification experiments in the HTS mode. Plates (1536-well) without compounds were run in order to validate this assay for an HTS environment. The mean coefficient of variation observed for these plates (n = 10) was 17 ± 1%. Serial dilutions of PMA were also tested on different days to predict the robustness of pEC50 determinations during the HTS process. The mean pEC50 value was 8.8 ± 0.1 (n = 5).
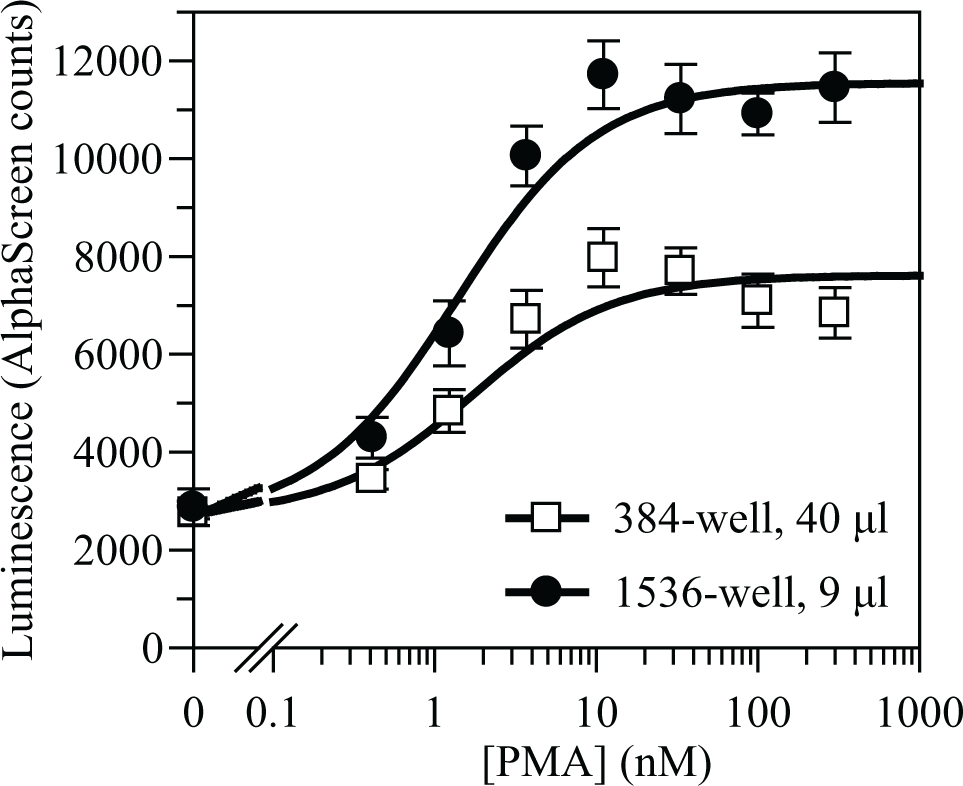
PMA stimulation curves of U87-MG cells before and after assay miniaturization. PMA (100 nM) was used as 100% stimulation control in HTS plates. Values are means and standard deviations of four replicates in 384-well plates and of at least eight replicates in 1536-well plates.
In order to discern between true positives and technological interferences from the HTS, a high-throughput secondary assay was also developed. In this case, U87-MG cells were replaced with HEK-293 cells that do not secrete LIF. LIF was added exogenously to the control wells as reference signal, and the AlphaScreen quantification system was identical to that described for the primary assay. Compounds causing a signal increase in this secondary assay were considered false positives of the primary assay.
Identification of LIF Enhancers in U87-MG Cells by HTS Using the AlphaScreen Assay
Before using this AlphaScreen assay to perform a full-deck HTS, we ran a validation experiment with the aim to optimize the HTS workflow and evaluate the quality of the process. The validation process also provides information on the capability of the assay and the process to accurately distinguish hits from inactive compounds in a large collection of samples. The assay was validated for HTS by running a representative set of 10,000 compounds by triplicate in the primary assay. The number of false-negative compounds was negligible. At the statistical cutoff of 20% activation, the hit rate was around 1%.
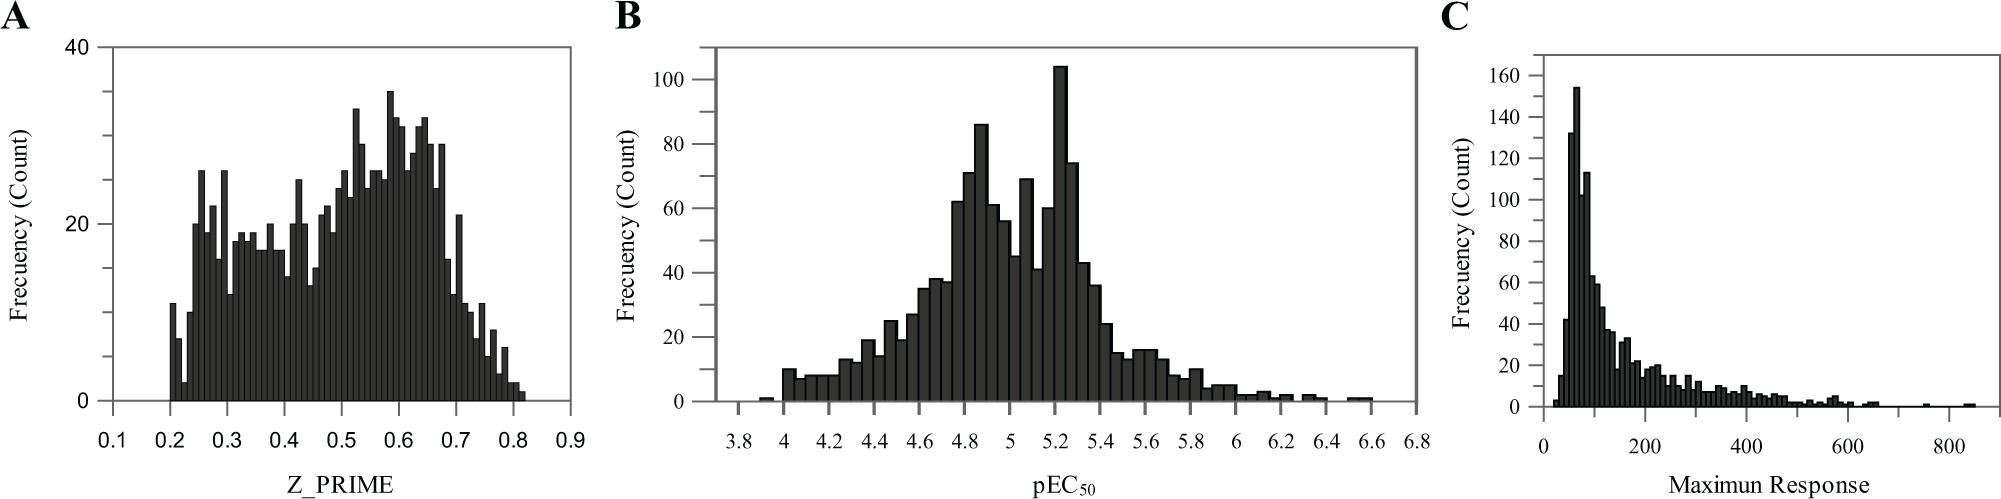
We tested in HTS mode 1.7 million compounds with a mean throughput of 180,000 compounds/day ( Fig. 3 ). The cutoff was calculated separately for each different experiment (day of screening). The mean statistical cutoff was 17% activation, in agreement with the data from the HTS validation. Hits were then retested at 10 µM by duplicate in the primary assay, and those that confirmed were selected for progression to dose–response studies. In this phase, compounds were tested against the primary and secondary assays to discard false-positive compounds. Only 30 compounds were discarded as false positives for being active in the secondary assay. There were 623 compounds with pEC50 values above 5 and no activity in the secondary assay with HEK-293 cells. Among these compounds there were five potential chemical series (structural clusters) containing 102 compounds. In addition to these five clusters, we also selected a number of interesting singletons from the remaining hits. A set of 200 compounds from five different clusters and singletons were selected for follow-up studies.
(
Hit Confirmation in U87-MG and WM-115 Cells and Astrocytes
The selected 200 compounds from the HTS campaign were tested in ELISA in U87-MG cells at 10 µM. A total of 150 hits were active, and 42 of them showed more than twofold LIF production enhancement ( Fig. 4A ). The same 200 compounds were also screened at 10 µM using WM-115 cell type with the AlphaScreen assay. This human epithelial cell type from skin melanoma was previously demonstrated to be an inducible producer of LIF (data not shown). Twenty compounds were shown to be statistically active, as they produced activation greater than 1.15 times over the basal signal ( Fig. 4B ). After chemical analysis, it was seen that most of the compounds could be classified into two main clusters and the rest were singletons.
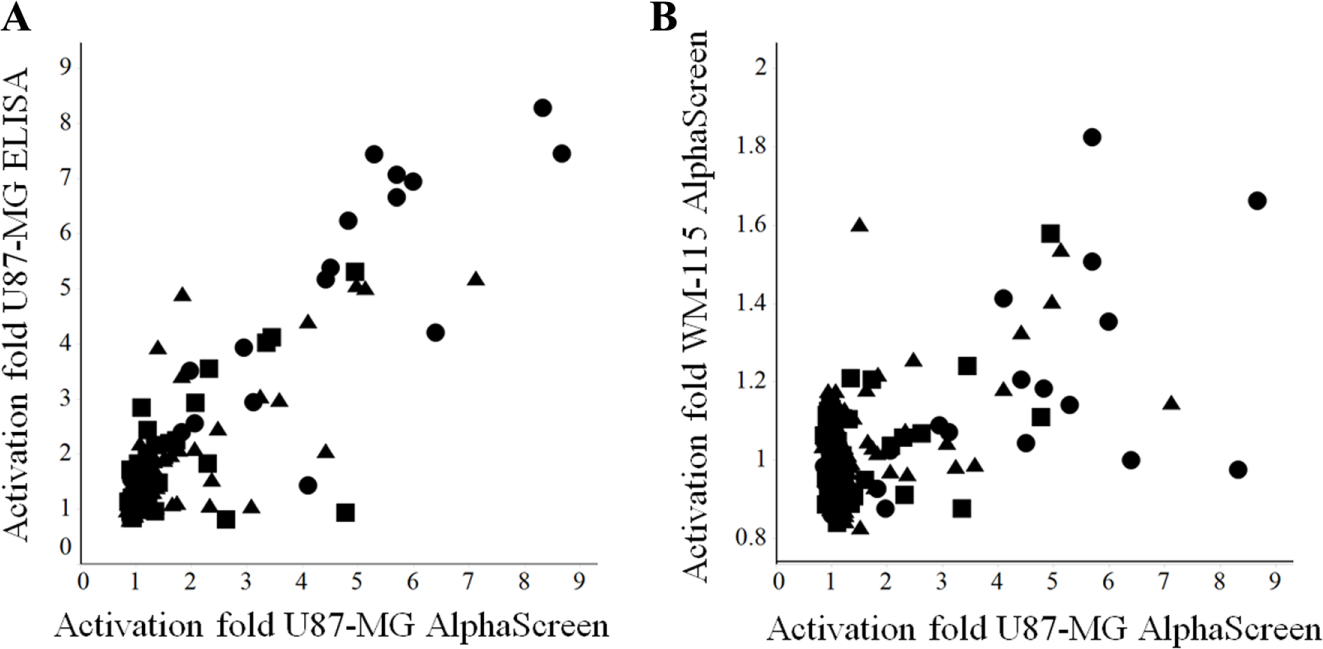
Correlation across assays of 200 selected compounds from HTS. (
All 20 compounds were further confirmed and characterized by testing them in full dose–response experiments in rat primary astrocytes. Data are summarized in Table 1 . Most compounds maintained activity in astrocytes, with pEC50 values ranging from 4.9 to 6.2, and showing activation that went from 2- to 40-fold of induction with respect to basal signal. The structures of three representative LIF production enhancers are shown in Figure 5 , along with values of pEC50 in the three cell types, as well as molecular weight, clogP, and PFI.
Comparison of pEC50 Values and Maximum Activation Fold of Most Interesting Compounds in U87-MG (n = 3) and WM-115 (n = 1) Cells in AlphaScreen and Primary Astrocytes from Rat (n = 1) in ELISA upon Hit Confirmation.

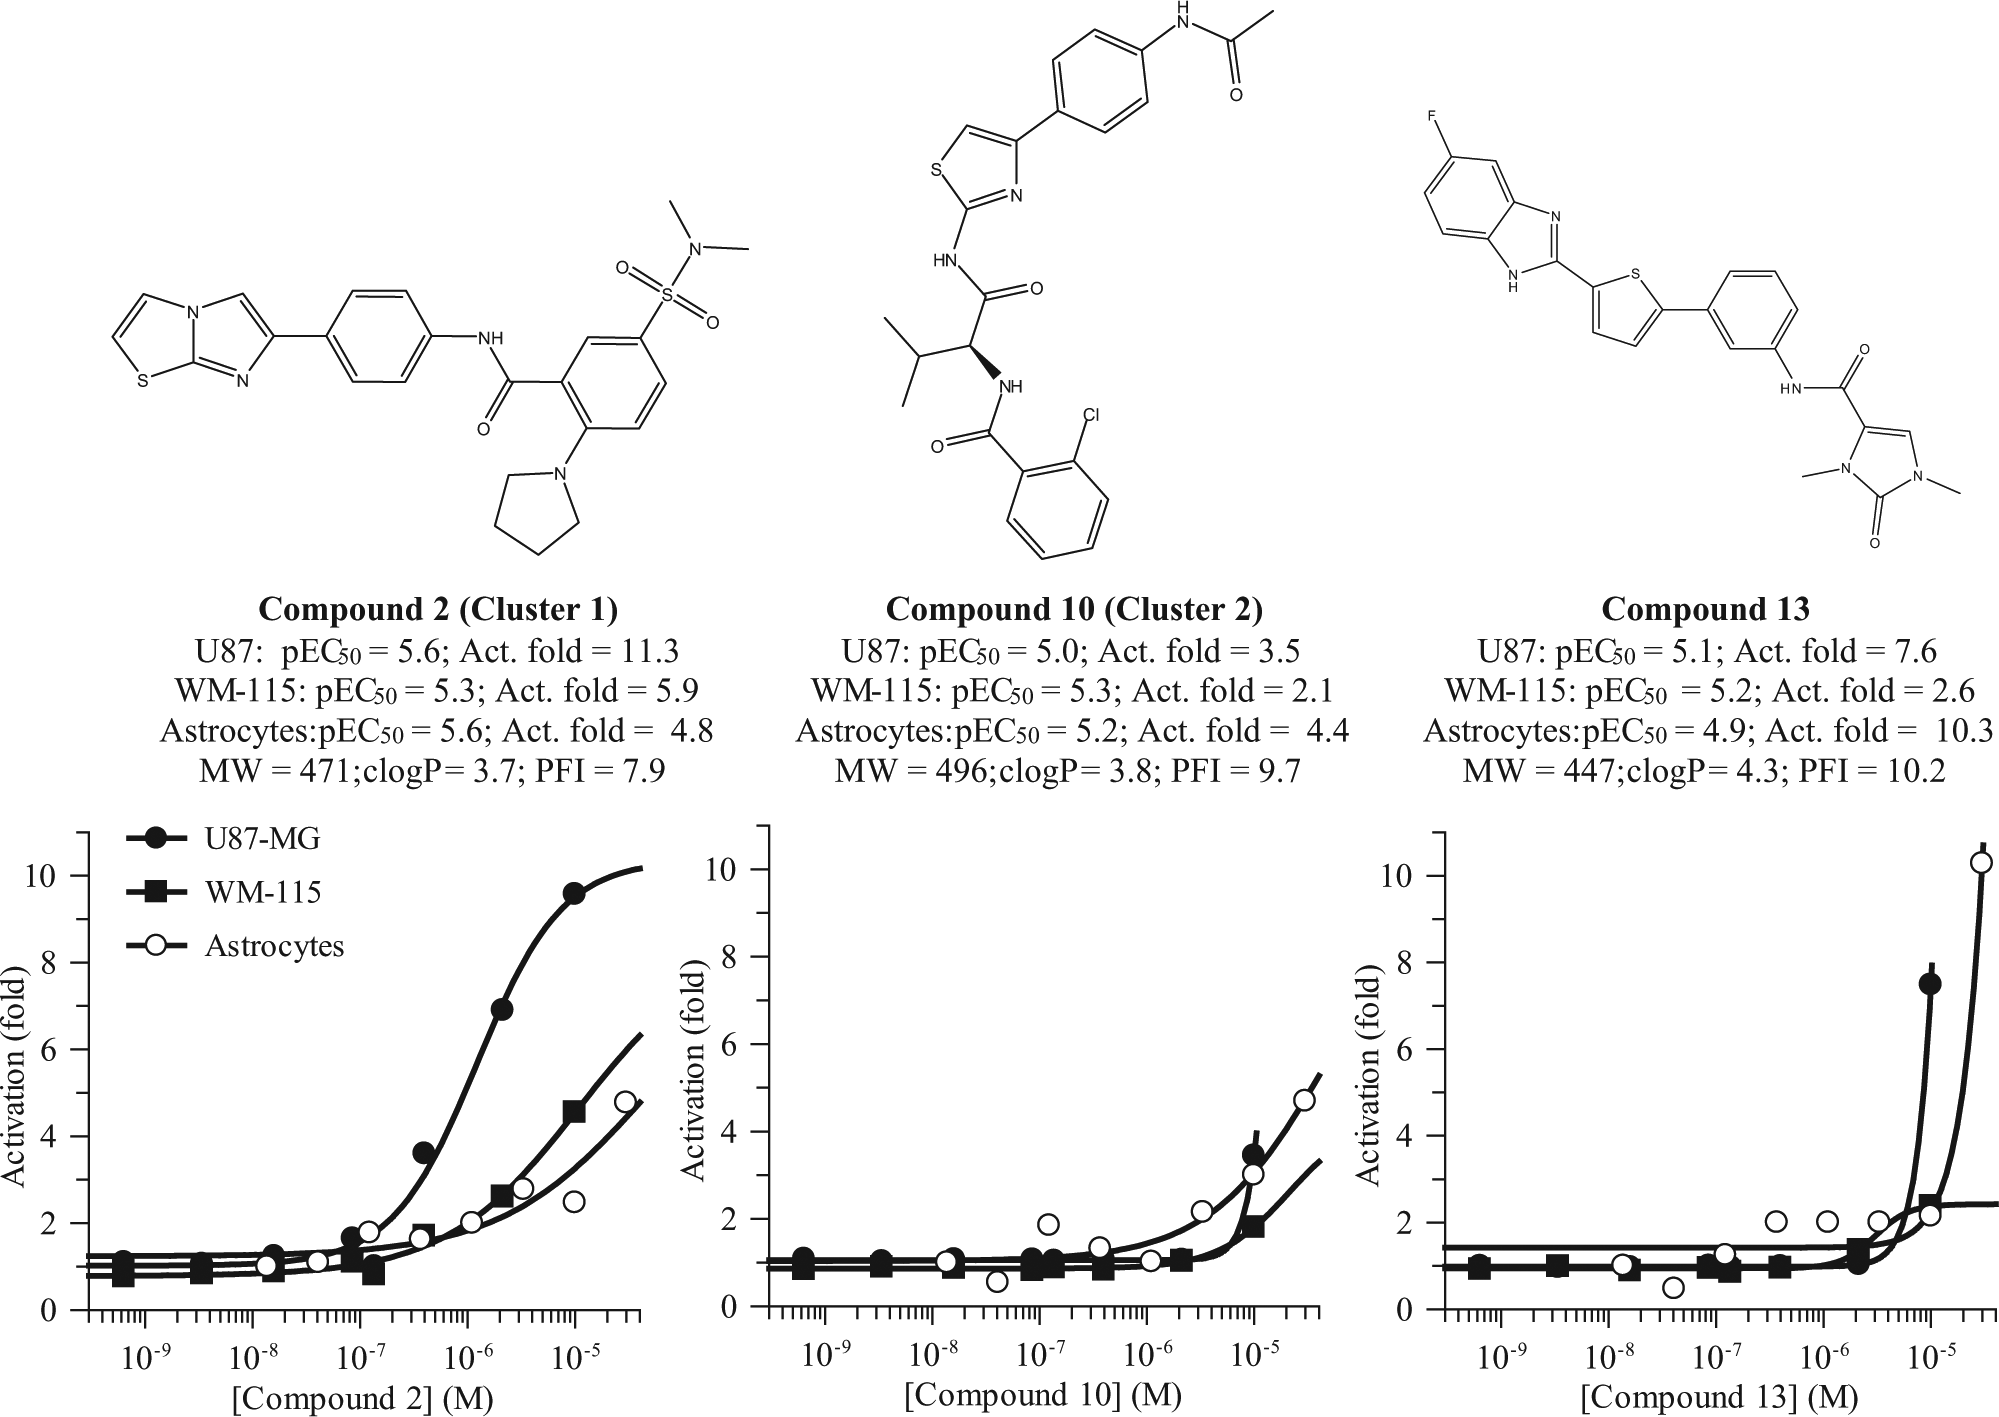
Representative enhancers of LIF production in primary astrocytes from rats identified by the AlphaScreen-based high-throughput campaign.
Discussion
In this article, we describe the development of a homogeneous, high-density phenotypic assay and its use to screen for compounds that stimulate the synthesis and/or release of LIF by human glyoblastoma cells. Although ELISA-type assays have been previously described to quantify LIF in different fluids or cell cultures,14,16 HTS-friendly assays that facilitate the massive screening of large libraries have not been reported before. Our approach includes the setup of a LIF detection system, based on Alphascreen technology, together with the use of several cell lines with a focus on a target-agnostic phenotypic approach.
Phenotypic and disease-relevant assays were the base of early drug discovery several decades ago. However, they were largely replaced by reductionist approaches with the advances in molecular biology, genomics, and combinatorial chemistry, and the technological development that set the scenario for the industrialization of the drug discovery process. These developments enabled screening of very large chemical libraries in a short time and at an affordable cost. Target-based approaches have yielded many successes, but they have also restricted the progress in certain complex diseases, where lack of understanding of the molecular origin is not well understood, therefore limiting the discovery of effective drugs. 17
One of the limitations for the implementation of phenotypic screening is the lack of scalability of the biological materials, such as primary cells or tissue explants. But in some cases, particular cell lines can be a good surrogate. In oncology, for example, a collection of nearly 1000 cells lines derived from human cancer patients have been genetically characterized (Cancer Cell Line Encyclopedia [CCLE]) and are being used for screening of compounds that kill cancer cells with particular genetic alterations. 18 In the neurodegeneration field, a fetal human mesencephalic cell line (Lund human mesencephalic [LUHMES]) has been phenotypically characterized as a good neuronal model for many studies.19,20
We decided to use U87-MG cells with the goal to develop a phenotypic HTS assay. This is a glyobastoma (astrocytoma) cell line originally derived from human brain and subsequently genetically characterized. 21 Extensively used for the subcloning of stem cells, 22 U87-MG cells have also been previously used for hit identification purposes. 23 U87-MG cells have been shown to express LIF, 24 and we have also proved in this work that LIF is released to the incubation medium, at concentrations within the dynamic range of the AlphaScreen assay that we have developed. The assay was pharmacologically validated. LIF stimulation by cell differentiation enhancers such as PMA and TNF-α has been previously reported. 25
U87-MG cells have a good batch-to-batch consistency, can be used as frozen preparations throughout the screening campaign, and can, in summary, facilitate HTS in a physiologically relevant context. We screened 1.7 million compounds and performed several confirmations and hit qualification steps, leading to the identification of multiple series of chemically tractable small molecules. These molecules have the potential to be progressed to further characterization and optimization. Due to the phenotypic nature of the screening, the intracellular signaling pathways involved in the activation of LIF synthesis and/or release would have to be later defined.
LIF mRNA increase has been reported in sympathetic ganglia and peripheral neurons after axotomy, consistent with its role in mediating responses to axonal injury, 26 but the induction mechanism has not been elucidated. A number of factors have also been found to induce LIF in nonneural tissues, including TNF-α, transforming growth factor beta (TGF-β), granulocyte-colony stimulating factor (G-CSF), interleukin 1 beta (IL-1β), and immunoglobulin-like factor (IGF). Some of these factors are also expressed in U87 cells, 24 so the induction of a paracrine or autocrine mechanism of regulation by the identified compounds could be hypothesized. In Muller glial cells, activation of the TLR2/NF-kappa B is necessary for induction of LIF expression, and LIF can autoregulate its own expression after that induction. LIF could also be induced by other members of the IL-6 family, or other cytokines that signal through NF-kappa B or STAT3. 27 Activation of Stat3 and Stat1 DNA binding and transcriptional activity by gp130 cytokines has already been reported in human brain tumor cell lines. 28 Some of the hits we identified show efficacy values that might suggest a potentiating mechanism, consistent with the suggested LIF autoregulation or a synergy with another endogenous activator. The confirmation of activity as LIF enhancers in a different cell line (WM-115) and in rat primary astrocytes adds a significant value to these hits.
The gp130 family has pleiotrophic effects on cells ranging from promoting proliferation to inducing differentiation, depending on the cell type. LIF, in particular, plays important roles in the early developing embryo and in adult life can influence platelet formation, and osteoblasts and neuronal function, among others,29,30 so potential safety issues associated with treatments with LIF modulators cannot be excluded. However, recombinant LIF treatments for infertility and chemotherapy-induced peripheral nerve damage have reached clinical phases II and III, respectively, and their failure to go beyond was due to the lack oaf superiority versus placebo, clearly suggesting that no major safety issues were found. Similarly, low-molecular-weight LIF enhancers could potentially be safe drugs for the treatment of neurodegenerative diseases.
The identification of the molecular target or targets of LIF enhancers identified in this study will be very important for the progression of these molecules in the drug discovery process. Although limitation of appropriate technology has in the past been responsible for the lack of success in target deconvolution and target identification, in the last few years many drug discovery organizations have built chemical biology and chemical proteomic platforms with the capacity to address this problem in a systematic manner and at the right scale.
In summary, using a combination of recombinant and primary cell lines together with the development of a miniaturized and homogenous LIF detection assay, we have been able to screen 1.7 million compounds from the GSK compound collection. We have identified a limited number of compounds with a promising profile that could be progressed in the long and difficult drug discovery journey.
The human biological samples were sourced ethically, and their research use was in accordance with the terms of informed consent.
Footnotes
Acknowledgements
We thank Monica Sobrino, Gonzalo Colmenarejo, and Amelia Alamillo for their contribution during the HTS campaign; Taylor Guo for his big contributions in the experiment design discussion; and Wei Zhang for his contribution in the assay development and compound profiling.
Declaration of Conflicting Interests
The authors declared no potential conflicts of interest with respect to the research, authorship, and/or publication of this article.
Funding
The authors received no financial support for the research, authorship, and/or publication of this article.