
Abstract
One of the key challenges facing early stage drug discovery is understanding the commonly observed difference between the activity of compounds in biochemical assays and cellular assays. Traditionally, indirect or estimated cell permeability measurements such as estimations from logP or artificial membrane permeability are used to explain the differences. The missing link is a direct measurement of intracellular compound concentration in whole cells. This can, in some circumstances, be estimated from the cellular activity, but this may also be problematic if cellular activity is weak or absent. Advances in sensitivity and throughput of analytical techniques have enabled us to develop a high-throughput assay for the measurement of intracellular compound concentration for routine use to support lead optimization. The assay uses a RapidFire-MS based readout of compound concentration in HeLa cells following incubation of cells with test compound. The initial assay validation was performed by ultra-high performance liquid chromatography tandem mass spectrometry, and the assay was subsequently transferred to RapidFire tandem mass spectrometry. Further miniaturization and optimization were performed to streamline the process, increase sample throughput, and reduce cycle time. This optimization has delivered a semi-automated platform with the potential of production scale compound profiling up to 100 compounds per day.
Introduction
Most drugs are designed to engage a specific target molecule, typically within a given cell type within the target organ or tumor. In order for a drug molecule to produce a pharmacological response against an intracellular target, it needs to penetrate the cell to achieve sufficient free concentration to engage with the target cellular biochemistry. However, measuring cellular penetration is difficult, and identifying where the drug is within the cell is currently impossible in most cases. Developing a clear understanding of drug-target interaction is a key prerequisite in the development of a new pharmaceutical. Early stage compound-target interaction is typically understood through deployment of large-scale in vitro assays that screen thousands of compounds against the target molecule. Compounds of further interest are then progressed into relevant cellular assays and eventually into in vivo models. Correlating the initial biochemical in vitro data, which are often the data used to drive structure-activity relationship chemistry campaigns, with that obtained in cellular assays and eventually in vivo is often difficult, as activity against the isolated target protein does not always correspond to that observed in a living cell. 1 An understanding of whether the drug actually penetrates the cell is therefore an important consideration.
To improve the disease relevance of screening cascades, groups are increasingly turning to human cellular phenotypic assay readouts, regularly using primary cell types, which are expensive and in some cases in short supply. It is therefore crucial that these reagents are not wasted screening compounds that, although they give promising biochemical data, are unlikely to give a cellular readout due to poor availability within the cell itself.
Historically, estimations of drug concentration in the target cell or tissue have relied on ex vivo samples, therefore restricting their application to a select few compounds at a relatively late stage in the drug discovery process. These methods often also rely on the use of radiolabeled compound for detection. 2 While numerous physicochemical assays, including estimates of compound permeability, are already routinely applied in early discovery, 3 none of these directly measure the amount of compound inside an intact cell. Typically, assays are performed using artificial membranes or monolayers of adherent cells, designed more to simulate penetration across the gut wall than into a cell. More recently, the work of Colletti et al. 2 demonstrated that it is possible to establish a liquid chromatography–mass spectrometry (LC-MS/MS)–based assay for detection of compound concentration within a cell, with sensitivity comparable to that of radiometric methods. This work was performed in human hepatitis C virus (HCV) subgenomic replicon cells. Others have also described the use of LC-MS/MS for measuring unbound drug fraction in generic cell lines such as HEK293 cells. 4 The work described here sought to expand on the work of Colletti et al. 2 by establishing a cellular concentration mass spectrometry assay in a generic cell line and with even higher throughput capable of supporting numerous hit to lead and lead optimization projects against different targets. Such an assay could be deployed early in hit discovery to help predict and understand differences in biochemical and cellular activity and ultimately influence compound progression decisions.
While ultra-high-performance liquid chromatography tandem mass spectrometry (UHPLC MS/MS) offers reasonable throughput, a sample time of minutes is still considered relatively slow for screening compounds in early discovery. The RapidFire platform (Agilent Technologies, Woburn, MA) offers rapid “trap-and-elute” cleanup of samples and presents analytes into the mass spectrometer every 6 to 10 s. The platform has been used previously for complex matrices 5 and therefore should be suitable for analysis of samples generated in a cellular concentration assay.
In this work, we discuss the development of a 96-well RapidFire MS/MS assay to determine compound concentration in HeLa cells. The assay was initially developed and validated in a 6-well plate and analyzed using UHPLC MS/MS. Transfer to 96-well RapidFire MS/MS format allowed an 8-fold increase in throughput. The data obtained from this high-throughput cellular penetration assay have enabled comparison with other high-throughput assays that measure physicochemical properties, such as protein 6 and phospholipid 7 binding. This provided an insight into the properties that enhance or prevent cellular compound penetration and intracellular target binding.
Materials
MR1-4 proprietary cell culture media supplemented with 10% fetal bovine serum (FBS) were supplied by Life Technologies (Carlsbad, CA). All plates were supplied by Greiner Bio-One (Stonehouse, UK). The Mammalian Protein Extraction Reagent (M-PER) used to lyse the cells was purchased from ThermoScientific (Rockford, IL), and the Covaris glass tubes and caps used for the acoustic disruption were purchased from Covaris (Woburn, MA). Formic acid (98%), sulfamethazine, acetonitrile, and water (purity 99.9%, Chromasolve Plus for high-performance liquid chromatography [HPLC]), Roswell Park Memorial Institute 1640 media (RPMI), and Dulbecco’s phosphate-buffered saline (PBS) were purchased from Sigma-Aldrich (Poole, Dorset, UK). Small molecules were synthesized in-house at GlaxoSmithKline (Stevenage, UK).
Methods
Cell Culture
HeLa S3 cells (ATCC CCL2.2; ATCC, Manassas, VA) were maintained in proprietary MR1-4 cell culture media supplemented with 10% FBS. The cells were adapted to grow in suspension and were maintained at 37 °C, 5% CO2, and 85% humidity with shaking. Subsequent short tandem repeat (STR) profiling matched the expected ATCC STR profile.
Cell Penetration Assay
Our original assay was configured to measure intracellular concentration and used a 6-well assay plate and UHPLC MS/MS analysis. This assay was then transferred to the RapidFire MS/MS system to reduce the analysis time of the samples, and the assay was reformatted into a 96-well plate format using Greiner deep-well V-bottomed plates to enable the use of dispensing equipment to automate the process and increase sample throughput.
Three samples were generated for each compound: the no-cell control (NCC), detergent disruption (M-PER), and acoustic disruption (Covaris). For the original 6-well method, all samples contained 4 µL test compound at 10 mM in 100% DMSO. For the NCC sample, 4 mL assay media (MR1-4) was added, and for the detergent and acoustic disruption samples, 4 mL cell suspension containing 2 × 10⁶/ mL HeLa cells in assay media (8 × 10⁶ total cells/well) was added. All samples were covered and incubated for 2.5 h at 37 °C, 5% CO2, and 85% humidity with shaking. After incubation, all samples were removed from the 6-well plate to labeled 15-mL centrifuge tubes. The NCCs were kept on the bench at room temperature, and the cell suspension samples were centrifuged at 500 × g for 5 min at 4 °C. The supernatants were removed and the cell pellets washed twice with 1 mL cold PBS to remove any compound that had not penetrated the cell. One sample was then resuspended in 350 µL cold M-PER to create the detergent disruption sample, and the second was resuspended in 350 µL cold water to generate the acoustic disruption sample. The M-PER samples were transferred to 1.5-mL microcentrifuge tubes and incubated for 10 min at 37 °C, 5% CO2, and 85% humidity with shaking. The acoustic samples were transferred to glass vials suitable for use with a Covaris Ultrasonicator, and the samples were lysed using the following settings: duty factor, 20%; intensity, 10%; and cycle/bursts, 1000. All lysed samples were centrifuged at 10,000 × g for 10 min at room temperature (RT), and the supernatants were removed to fresh 1.5-mL microcentrifuge tubes.
The automated 96-well method used Greiner deep-well V-bottomed plates containing 4 µL test compound at 10 mM in DMSO and 2 mL assay media (NCC samples) or 2 mL cell suspension at 2 × 10⁶/mL (4 × 10⁶ total cells) for both the detergent and acoustic disruption conditions. Similar to the 6-well method, all samples were plated and incubated for 2.5 h and centrifuged at 500 × g for 5 min at 4 °C; the supernatant was removed and a Biomek FX (Beckman Coulter, High Wycombe, UK) was then used to resuspend the cell pellet by repeat aspiration and ejection, washing twice in 1 mL cold PBS. The Biomek FX was then used to resuspend the cell pellet in 200 µL of either M-PER (detergent disruption) or water (acoustic disruption). The M-PER samples were transferred to a standard 96-well V-bottomed plate and incubated for 15 min at 37 °C, 5% CO2, and 85% humidity with shaking while the water/cell pellet was transferred into Covaris glass tubes and acoustically lysed using a Covaris Ultrasonicator, with the same conditions as the 6-well. After lysis, the acoustic disruption samples were removed and added to new wells on the 96-well plate containing the M-PER samples, before being centrifuged at 3220 × g for 30 min at 4 °C. Supernatants were removed using the FX and transferred to another standard 96-well V-bottomed plate, and the cell pellets were then discarded. To generate the final assay plate for both methods, 5 µL of the NCC, detergent, and acoustic disruption samples was plated in duplicate into a Greiner 96-well V-bottomed plate, and 45 µL RPMI, 50 µL 50% MeCN, and 50 µL internal standard solution (containing 100 ng/mL sulfamethazine in 5% MeCN) were added to all wells using a Multidrop Combi dispenser (Thermo Fisher Scientific, Waltham, MA). A scheme of this assay process can be seen in Figure 1 .
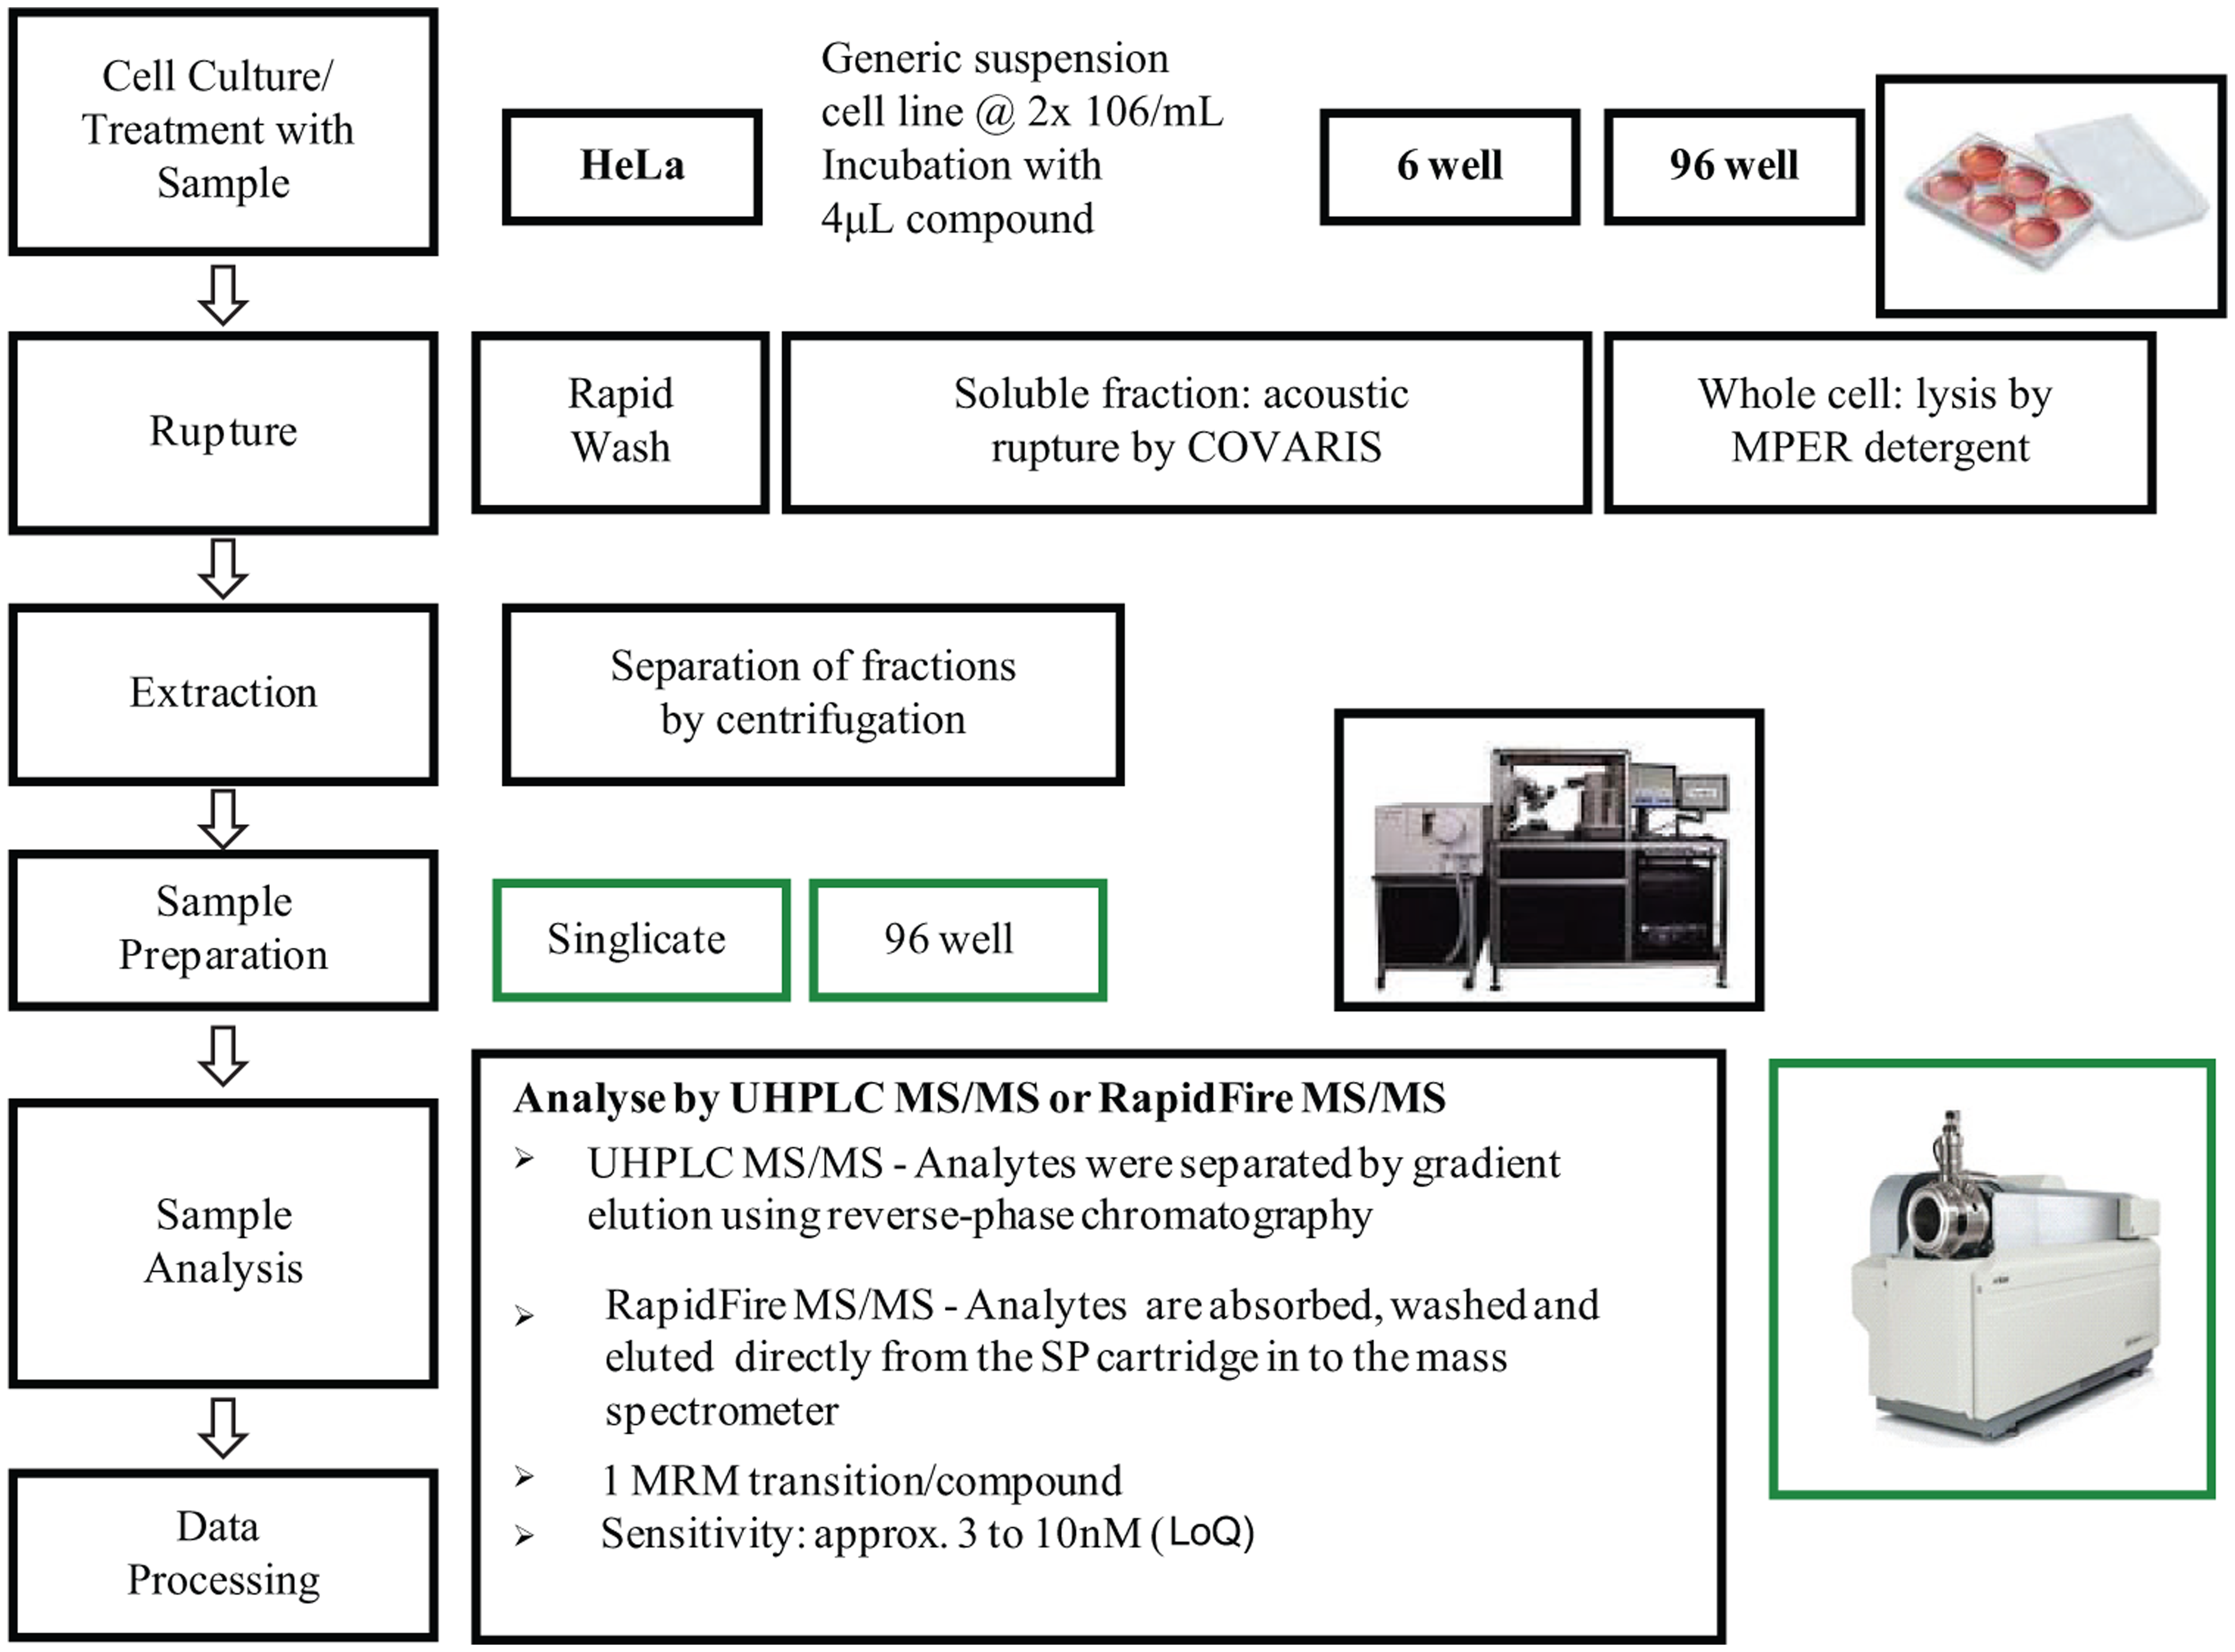
Scheme of the cellular concentration assay representing workflow for both ultra-high-performance liquid chromatography tandem mass spectrometry (UHPLC MS/MS) and RapidFire tandem mass spectrometry (MS/MS) in both 6-well and 96-well formats.
Optimization of MRM Methods for UHPLC MS/MS and RapidFire MS/MS
The introduction of DiscoveryQuant v2.3 Optimize & Analyze (AB Sciex, Warrington, Cheshire, UK) proprietary software to control Analyst (AB Sciex) and automate compound optimization to produce either RapidFire MS/MS or UHPLC MS/MS methods has greatly reduced method development time. Compound-specific multiple-reaction monitoring (MRM) methods, incorporating an internal standard (sulfamethazine), were optimized by UHPLC MS/MS by diluting 1 µL of 10 mM compound (100% DMSO) into 200 µL 50% MeCN in a standard Greiner 96-well V-bottomed plate. To use DiscoveryQuant software for the optimization of MRM methods for the RapidFire, an Agilent HP1100 system (Agilent Techno-logies), comprising a binary pump and well-plate autosampler, was used to interface directly with the API 4000 mass spectrometer (AB Sciex). Compound-specific tune files were generated by infusion through a loop injection into the system. The optimized MRM files were then converted directly to method files using DiscoveryQuant analyze software.
Ultra-Performance Liquid Chromatography–Mass Spectrometry System Setup
For the initial 6-well method, quantitative sample analysis was performed using an API 4000 QTrap mass spectrometer (AB Sciex) coupled to an Acquity UHPLC system (Waters Ltd., Elstree, Hertfordshire, UK) comprising a Sample Organizer, a Sample Manager, and a Binary Solvent Manager. Analytes were separated by gradient elution using reverse-phase chromatography with a Kinetix C18, 2.6-µm analytical column (50 × 2.1 mm) protected by a guard column (Phenomenex, Torrance, CA) at a flow rate of 0.8 mL/min. The mobile phase comprised 0.1% formic acid in water (A) and 0.1% formic acid in acetonitrile (B). The gradient elution conditions used were as follows: initially, 3% B increasing linearly to 100% B over 1.5 min, holding at 100% B for 0.4 min and then decreasing linearly to 3% B in 0.1 min, giving an overall cycle time of 2 min. The mass spectrometer was operated in positive ion MRM mode, with an ion spray voltage of 5.2 kV and a desolvation temperature of 650 °C. An internal standard, sulfamethazine, with an MRM transition of m/z 279.1 > m/z 186.1 Da was used in all UHPLC MS/MS experiments.
RapidFire Mass Spectrometry System Setup
For the optimized 96-well assay, the RapidFire RF200 system (Agilent Technologies) coupled to an API 4000 triple quadrupole mass spectrometer (AB Sciex) was used. Samples were aspirated from 96-well plates into a 10-µL sample loop and adsorbed onto a C18 solid phase extraction (SPE) cartridge, washed for 2.5 s, and eluted from the SPE cartridge at a flow rate of 1.5 mL/min 80% (v/v) acetonitrile in water containing 0.1% (v/v) formic acid over 2.5 s, directly into the mass spectrometer source. The system was reequilibrated for 600 ms with the load buffer at a flow rate of 1.25 mL/min. The load/wash buffer comprised 0.1% (v/v) formic acid in water using a flow rate of 1.25 mL/min. The entire cycle time was <8 s per sample.
Data Analysis for Cellular Penetration Assay
Cell concentration ratio data for each compound are reported as pΔC, defined as per equation (1):
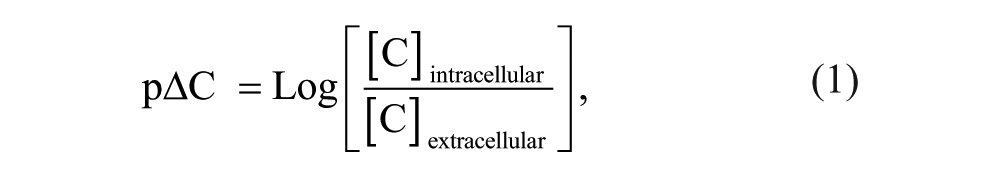
where [C]extracellular is the extracellular concentration of compound (as measured within the NCC sample), and [C]intracellular is the intracellular concentration of compound determined from equation (2):

where [C]fraction is the concentration of compound measured in the intracellular fraction, Vfraction is the total volume of the intracellular fraction measured (average 200 µL), and Vcell is the total volume of cells within the intracellular fraction (average 8 µL).
In determining cell concentrations by mass spectrometry, peak areas were quantified in Analyst and exported to Excel (Microsoft, Redmond, WA) as Peak Ratio, calculated as per equation (3):

where Compound Peak Area is the measured peak area for the test compound, and ISTD Peak Area is the measured Peak Area of the internal standard.
For concentrations of compound where Peak Ratio is linearly proportional to compound concentration, pΔC can hence be estimated from equation (4):
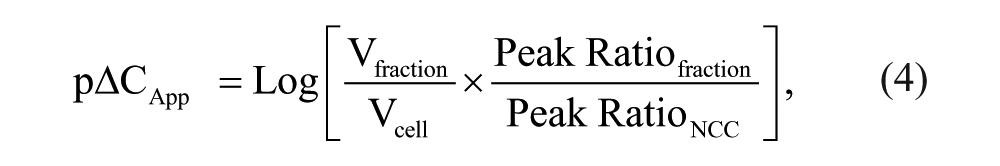
where pΔCApp is the apparent pΔC, Peak Ratiofraction is the Peak Ratio determined for the intracellular fraction for the test compound, and Peak RatioNCC is the Peak Ratio determined from the extracellular fraction (NCC) for the test compound.
In determining pΔC, total volume of cells in the fraction is calculated on the day using the average cell diameter, the number of cells used in the assay (~8 × 10⁶ for the 6-well assay format and ~4 × 10⁶ for the 96-well assay format), and an estimated final cell fraction volume.
Two distinct values are determined:
pΔC detergent disruption, which is determined from fractions generated by detergent lysis (M-PER) and is representative of the total concentration in the cell, including the cell and subcellular organelle membrane-bound fractions
pΔC acoustic disruption, which is determined from fractions generated by Covaris acoustic rupture and is representative of the concentration in the cells without the membrane-bound fraction
Methodologies for comparative physicochemical determinations, the protein binding, and phospholipid binding assay (immobilized artificial membrane [IAM]) were as previously published.6,7
Results and Discussion
An important aspect of lead discovery efforts within drug discovery is to build a structure-activity relationship between compound activity in a biochemical assay setting and that within a more physiologically relevant cellular assay. One key driver of cellular activity is the relative concentration of compound that is able to penetrate into the cell. Therefore, filtering out compounds that are unlikely to give activity due to poor cellular penetration will reduce effort and focus resources on appropriate compounds. In addition, where cellular activity is observed but there is a mismatch between activity in the cellular system compared with the biochemical target-based assay, it is important to understand if this difference is related to the compound activity against the target in a more physiologically relevant setting (i.e., full-length vs. truncated proteins, presence of intact protein complexes, etc.) or whether there is simply less compound at the target in the cellular setting, as a result of insufficient compound entering the cell. This information is key in enabling accurate dose prediction as compounds progress toward preclinical studies and in building an overall picture of the compound quality, much of which relies on data generated in a cellular setting. The concept of drug efficiency is not a new one,8,9 but historically, estimations have relied on data from in vivo experiments based on drug plasma concentrations, therefore restricting their application to a select few compounds at a relatively late stage in the lead discovery process. While numerous physicochemical assays, including estimates of compound permeability, are already routinely applied in early discovery, none of these directly measure the amount of compound inside an intact cell. Typically, assays are performed using artificial membranes or monolayers of adherent cells, designed more to simulate penetration across the gut wall than into a cell.
The work described here built on the work of Colletti et al. 2 and aimed to establish a generic, high-throughput RapidFire MS/MS-based assay for determination of compound concentration in intact cells, for application early in hit and lead discovery, which would be the equivalent of the more macro drug efficiency concept that has recently come into use8,9 but requires animal dosing experiments to give an effective estimate.
Since a generic method was preferred, a single cell type was initially selected for the work. Suspension HeLa cells were selected as a readily available, fast-growing cell type without significant numbers of transporters present in the membrane, which may complicate data analysis. 10 Initially, experiments were performed in 6-well cell plates to provide a large surface area over which cells could associate with compound and reduce clumping of cells as it was unknown how this may affect cell penetration. At this stage, although 6-well was not a preferred format for a high-throughput assay, the assay was used simply to validate the methods and to establish a basic protocol. Two disruption methods were employed: (1) detergent disruption using M-PER, which is broadly representative of the total cell fraction, including cell membranes, and therefore would include any compound bound to the outer or inner membranes of the cells and (2) acoustic rupture using the Covaris, which is used to burst the cells rather than dissolve the outer membrane and is broadly representative of the cell fraction and therefore unlikely to include any membrane-bound compound. Samples for both methods were analyzed using UHPLC MS/MS, and a comparison between the two disruption methods can be seen in Figure 2 . These data show a strong correlation between the two disruption methods, giving a calculated coefficient of 0.93 with data sitting close to the line of unity.
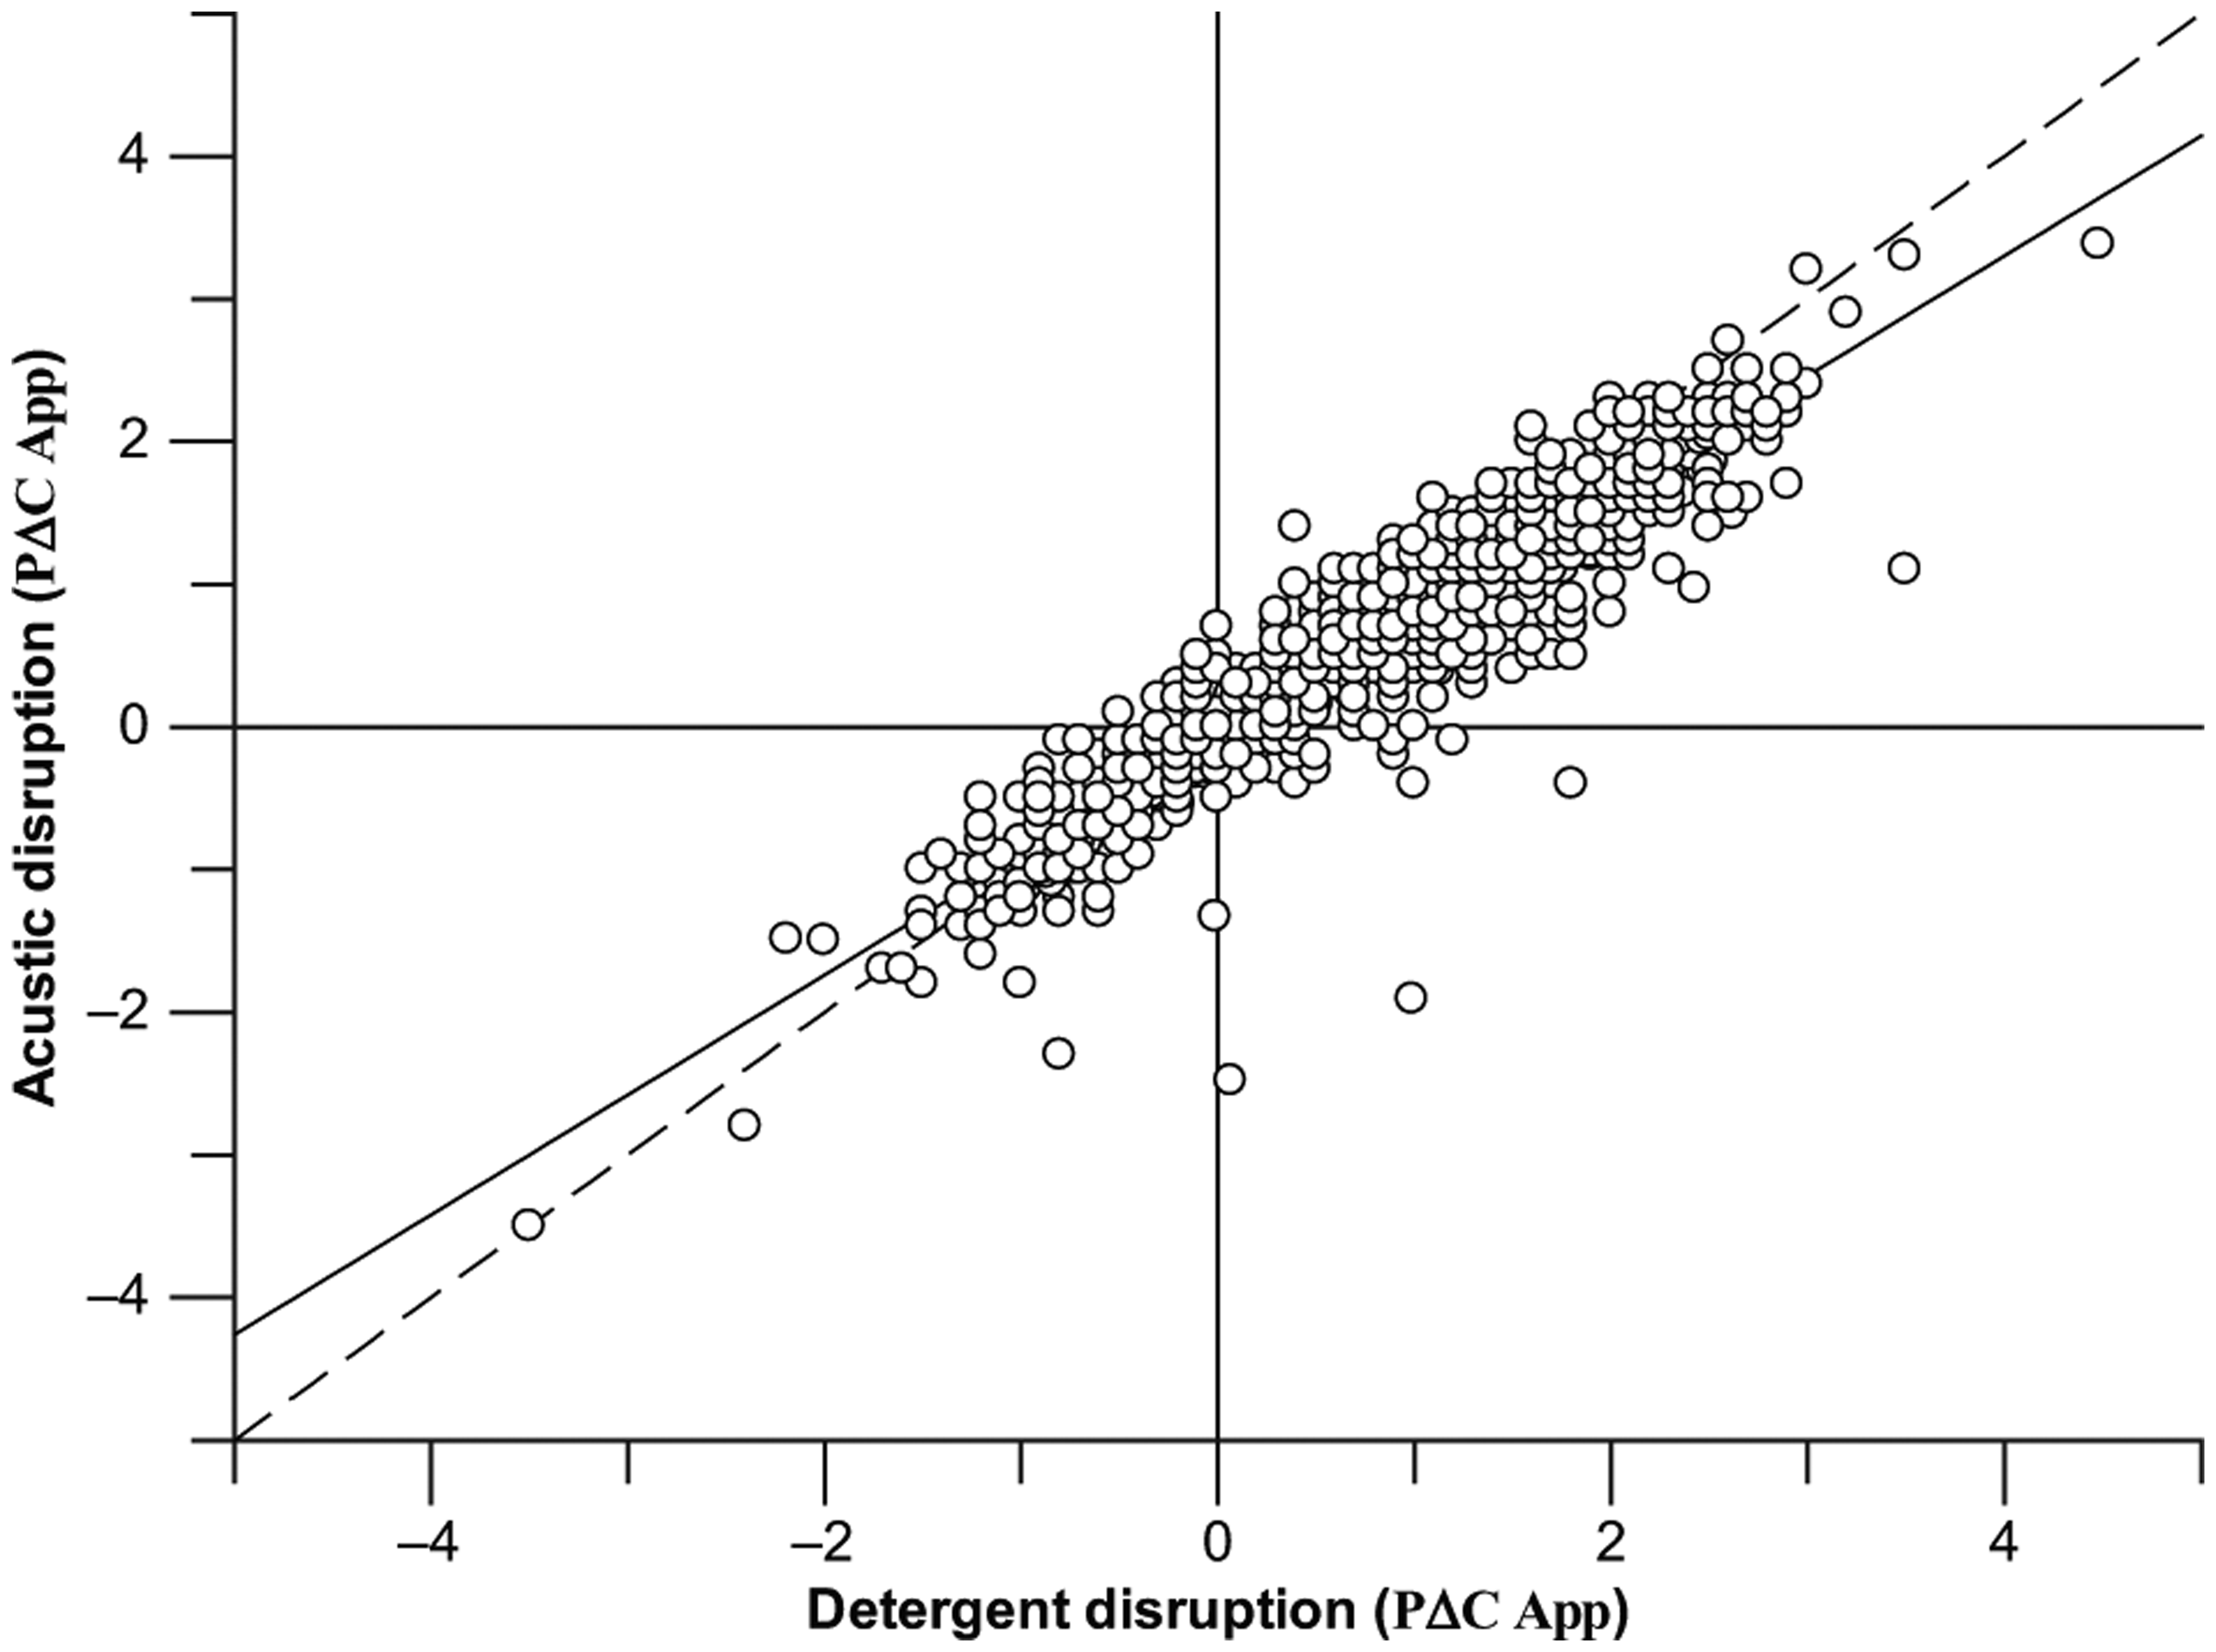
Correlation of pΔCApp obtained by ultra-high-performance liquid chromatography tandem mass spectrometry (UHPLC MS/MS) between the Mammalian Protein Extraction Reagent (M-PER) detergent disruption condition and the Covaris acoustic disruption. The data indicate a strong correlation between the two cell lysis protocols with a correlation coefficient of 0.93.
We believe there are advantages and disadvantages to each disruption technique, although the results obtained to date suggest that they are broadly comparable to each other. While the M-PER disruption method is by far the simplest method of lysis and would significantly reduce assay time, the M-PER itself causes ion suppression in the mass spectrometer ion source and therefore can cause an increase in variation of the peaks and some loss of peaks altogether for compounds that show very low permeability. As the M-PER samples are also likely to include compound that is trapped in the outer membrane of the cell, it may be less representative of the concentration of compound within the cell itself. The Covaris method, on the other hand, shows an improved chromatography profile with improved signal to noise and no ion suppression. It was thought that with this type of lysis, it may be possible to lyse the cells to give just the aqueous fraction (i.e., cytosol and intraorganellar material). However, the acoustic lysis method is time-consuming (~15 min/12 compounds) and expensive for a high-throughput assay due the cost of the Covaris glass tubes. It is also unclear as to whether the current conditions on the Covaris are sufficient to yield just the aqueous fractions, and further investigation into whether this is actually the case is ongoing.
Coletti et al. 2 describe the importance of distinguishing specific compound interaction and nonspecific binding to the outer cell membrane and cell culture plates. In addition to the comparison between Covaris and M-PER disruption methods to understand effects of compound binding to the outer membrane, an NCC sample was also included in every experiment to control for nonspecific binding to plasticware.
The data set generated in Figure 2 to compare disruption methods was also used to validate whether the pΔC values obtained could be related to cellular activity of known project compounds. Indeed, when the data were examined further, it was found that compounds with pΔC values clustered around −0.5 to 1 units had cellular activities that correlated well with biochemical assay data, while those that demonstrated lower cellular potency had more negative pΔC values. A pΔC value of 0 would suggest equilibrium between the intracellular and external environments. Those giving strong positive pΔC values are thought to be accumulating within the cell to some extent. While pΔC values could not be directly matched to pXC50 values, the ranking of compounds was broadly consistent, and negative cell penetration consistently correlated with less cellular activity and vice versa. This suggests that data from this assay are suitable as an early predictor of cell penetration and therefore cellular activity.
Having established a basic methodology in 6-well format using a UHPLC MS/MS analytical method, work was initiated to increase the throughput of the assay. For UHPLC MS/MS, the analytes were separated using a generic 2-min gradient elution method with detection by tandem mass spectrometry. While this was sufficient for early validation work, a sample time of 2 min per well is too long to support numerous discovery efforts simultaneously. In addition, the peak integration from the UHPLC MS/MS system was manually intensive and time-consuming, creating an additional bottleneck in the data analysis. The RapidFire MS/MS platform is an automated online solid-phase (SP) sample extraction device coupled to a triple quadrupole mass spectrometer. Analytes are adsorbed, washed, and eluted directly from the SP cartridge into the mass spectrometer every 8 s. The RapidFire Integrator software (Agilent Technologies) facilitates plate-based peak integration and data export, which is much more compatible with high-throughput workflows. To understand whether the RapidFire system could be employed using generic SP extraction conditions for the cell penetration assay, identical samples were analyzed by UHPLC MS/MS and RapidFire MS/MS to investigate the correlation of calculated pΔC between the two techniques and to demonstrate method equivalency.
The data show a good correlation between the two analytical methods for both detergent and acoustic disruption methods, giving a calculated correlation coefficient of 0.94 and 0.95, respectively ( Fig. 3 ). The regression slope for each sample set is close to unity, and the variance is minimal, showing that the RapidFire MS/MS method is comparable to the UHPLC MS/MS method for the measurement of PΔC.
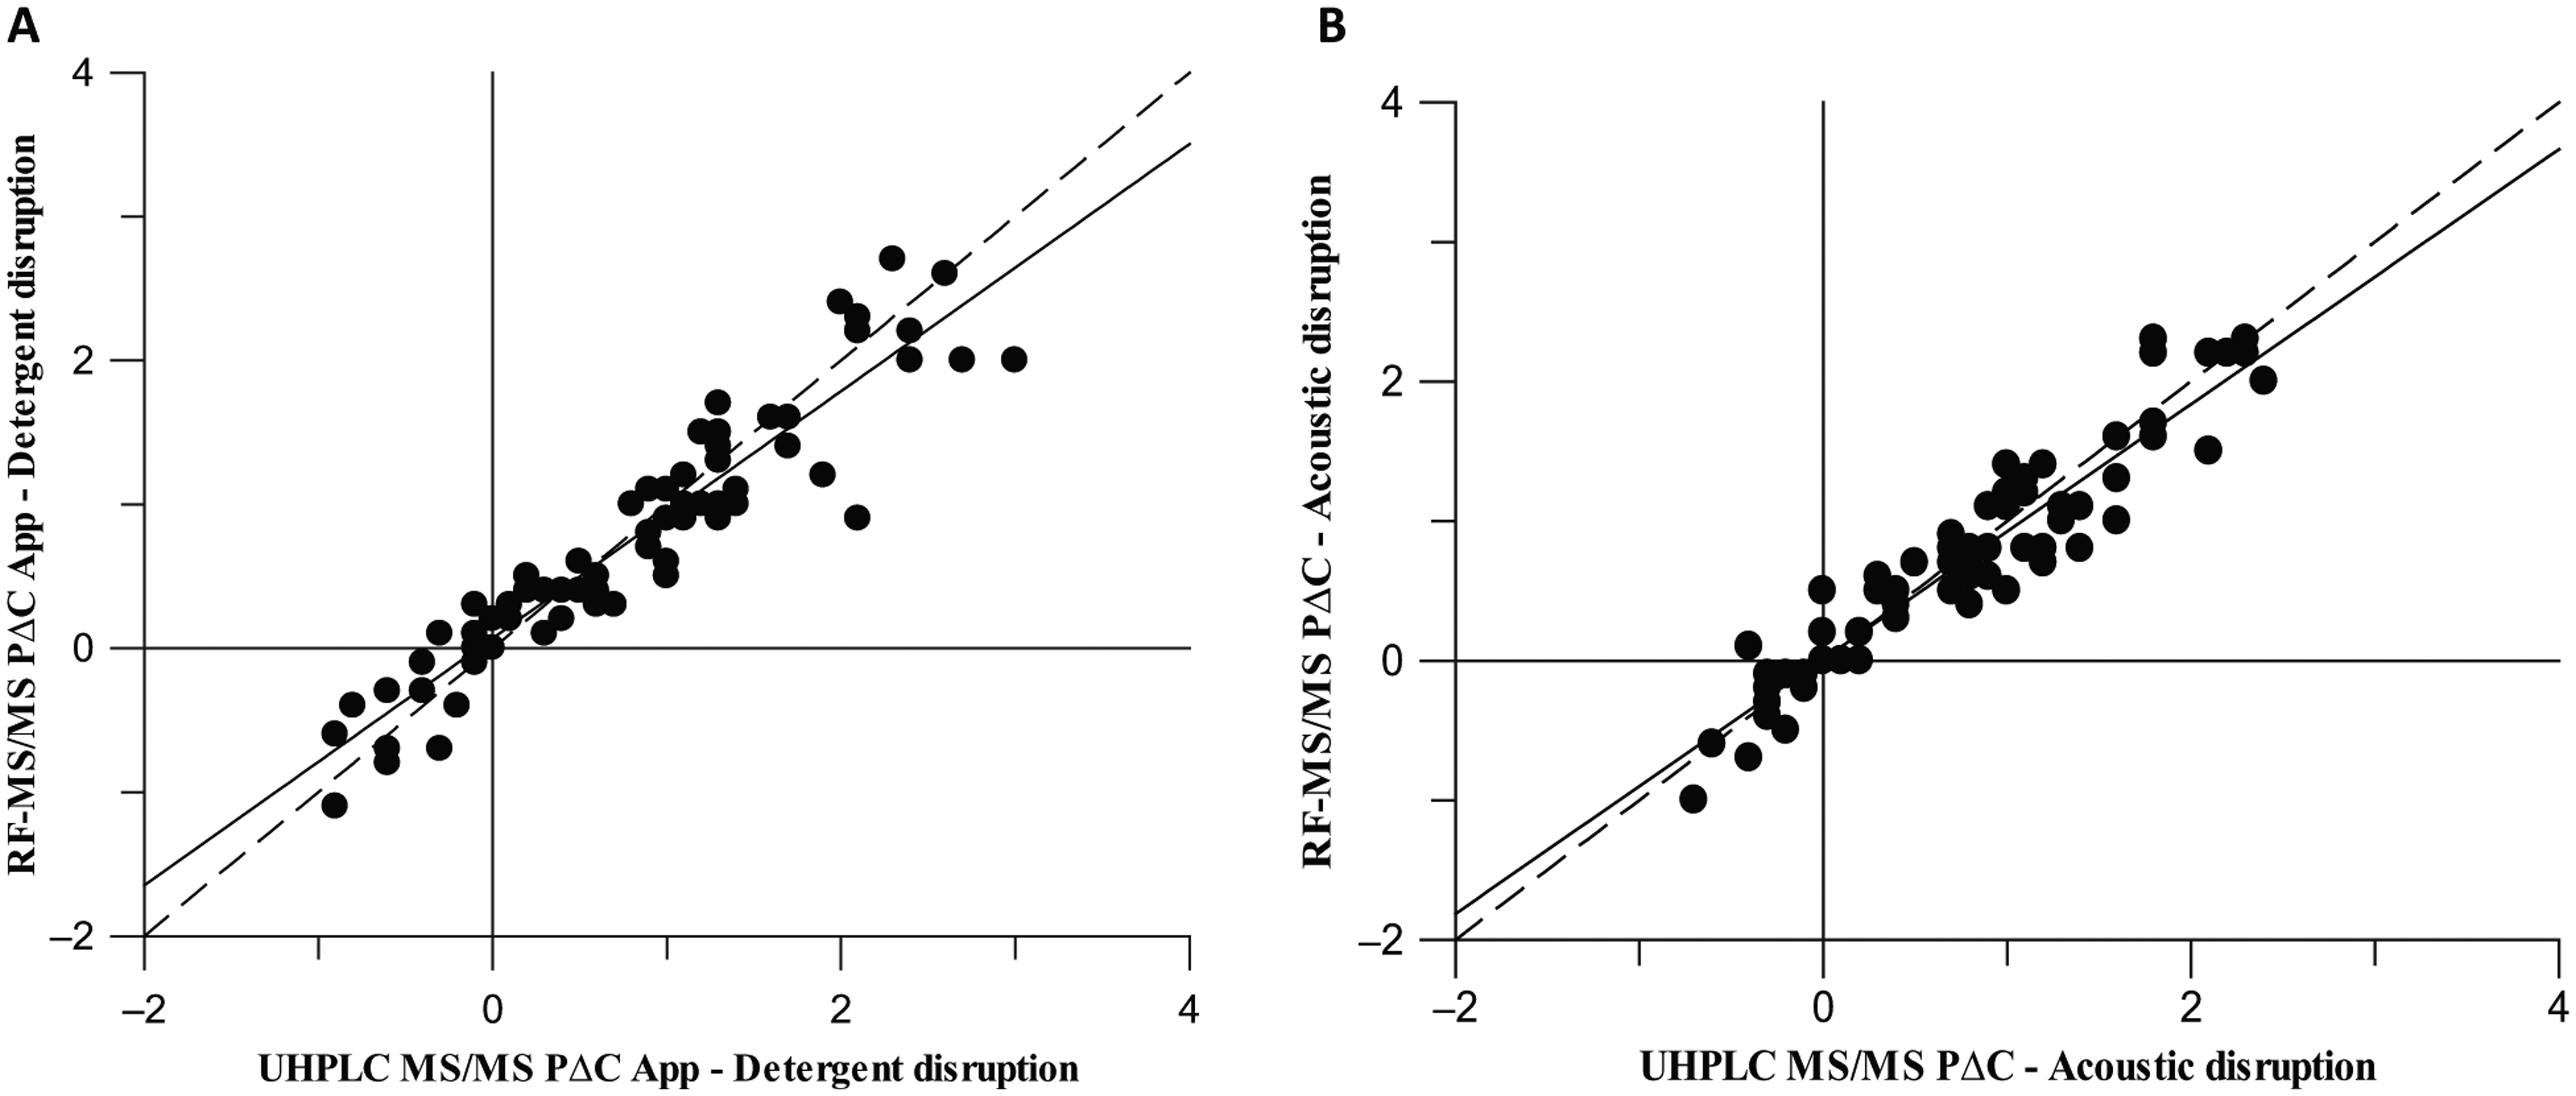
Correlation of pΔCApp between the ultra-high-performance liquid chromatography tandem mass spectrometry (UHPLC-MS) detection and RapidFire tandem mass spectrometry (MS/MS) detection, giving a correlation coefficient of 0.94 for the detergent disruption method (
Switching to RapidFire analysis, the cycle time per compound was reduced to less than 8 s, increasing sample throughput by a factor of 15 and greatly reducing the complexity and time for data analysis. The data could be exported directly into Excel, and an Excel template could be used to automatically calculate data from the raw data file. The use of an HPLC system directly coupled to the mass spectrometer is still required for the compound tuning step, which is facilitated by DiscoverQuant Optimize and Analyze software (AB Sciex), but the mass spectrometer can be readily switched between the HPLC and RapidFire systems. In the future, analysis time could be further reduced by coupling the RapidFire to a time-of-flight mass spectrometer rather than a triple quadrupole system as described here to eliminate the need for this compound tuning step. However, sensitivity of detection is crucial for this assay, as in some cases, only low nM concentrations of compound are present within the cell, so the ideal choice of analytical setup would have to be a careful balance of sensitivity and speed.
Although the transfer to RapidFire resulted in greatly reduced detection time, the bottleneck shifted to sample preparation. The 6-well format of the assay prevented the use of automation solutions, and the assay process therefore involved many manual wash steps, which was extremely time-consuming and limited the number of samples that could be processed. To enable the use of liquid handling automation and further increase throughput, a 96-well assay format was desired. The assay was reformatted by using a deep-well 96-well plate and reducing the media and cell suspension additions from 4 mL to 2 mL. This facilitated the use of equipment such as the Biomek FX to wash the cells and the Multidrop Combi for liquid dispensing. The reduction of assay volume resulted in the number of cells used in the assay being halved, and the final assay concentration of the compound doubled. It was hypothesized that these changes, along with the change in plate type, may reduce the sensitivity of the assay. To establish if this was the case, a compound set was run in both 6- and 96-well assays to compare the two formats. The data show a good correlation between the 6- and 96-well assay formats, giving calculated correlation coefficients of 0.96 and 0.94 for the detergent and acoustic disruption methods, respectively ( Fig. 4 ). The sensitivity of the assay therefore seems unaffected by the miniaturization to 96-well.
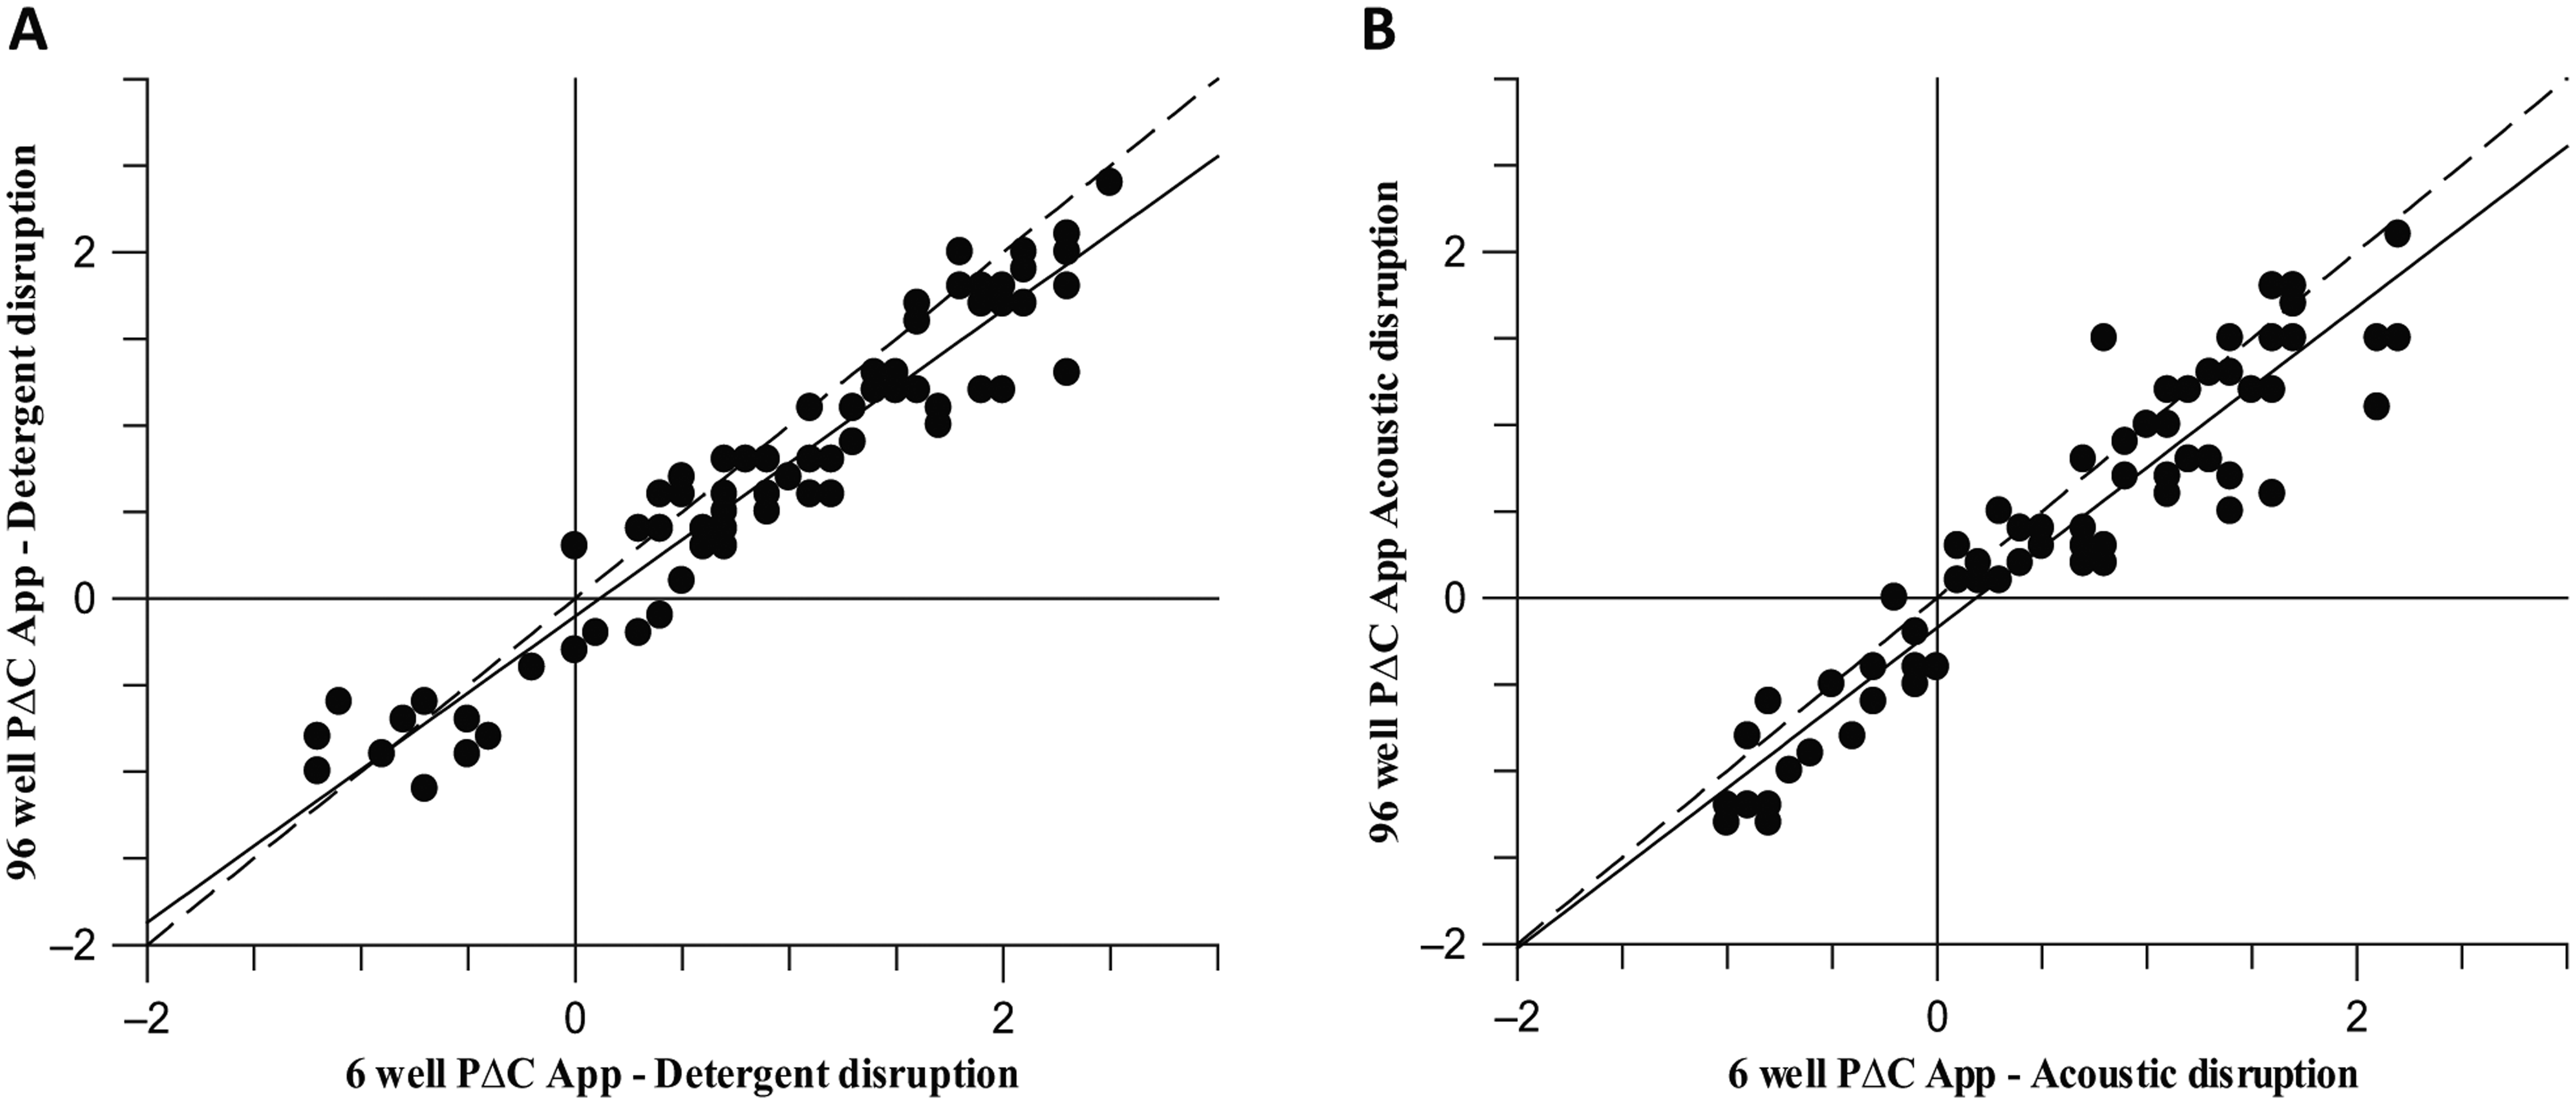
Correlation of pΔCApp between the 6-well and 96-well method, giving a correlation coefficient of 0.96 for the detergent disruption method (
By using RapidFire MS/MS and reformatting to 96-well to enable automation of liquid handling, the assay time has been greatly reduced with no impact on data quality. The throughput is now around 100 compounds per day, including method development time, a level that can support lead discovery efforts across multiple projects. Figure 5 shows the time savings achieved through these optimization processes.
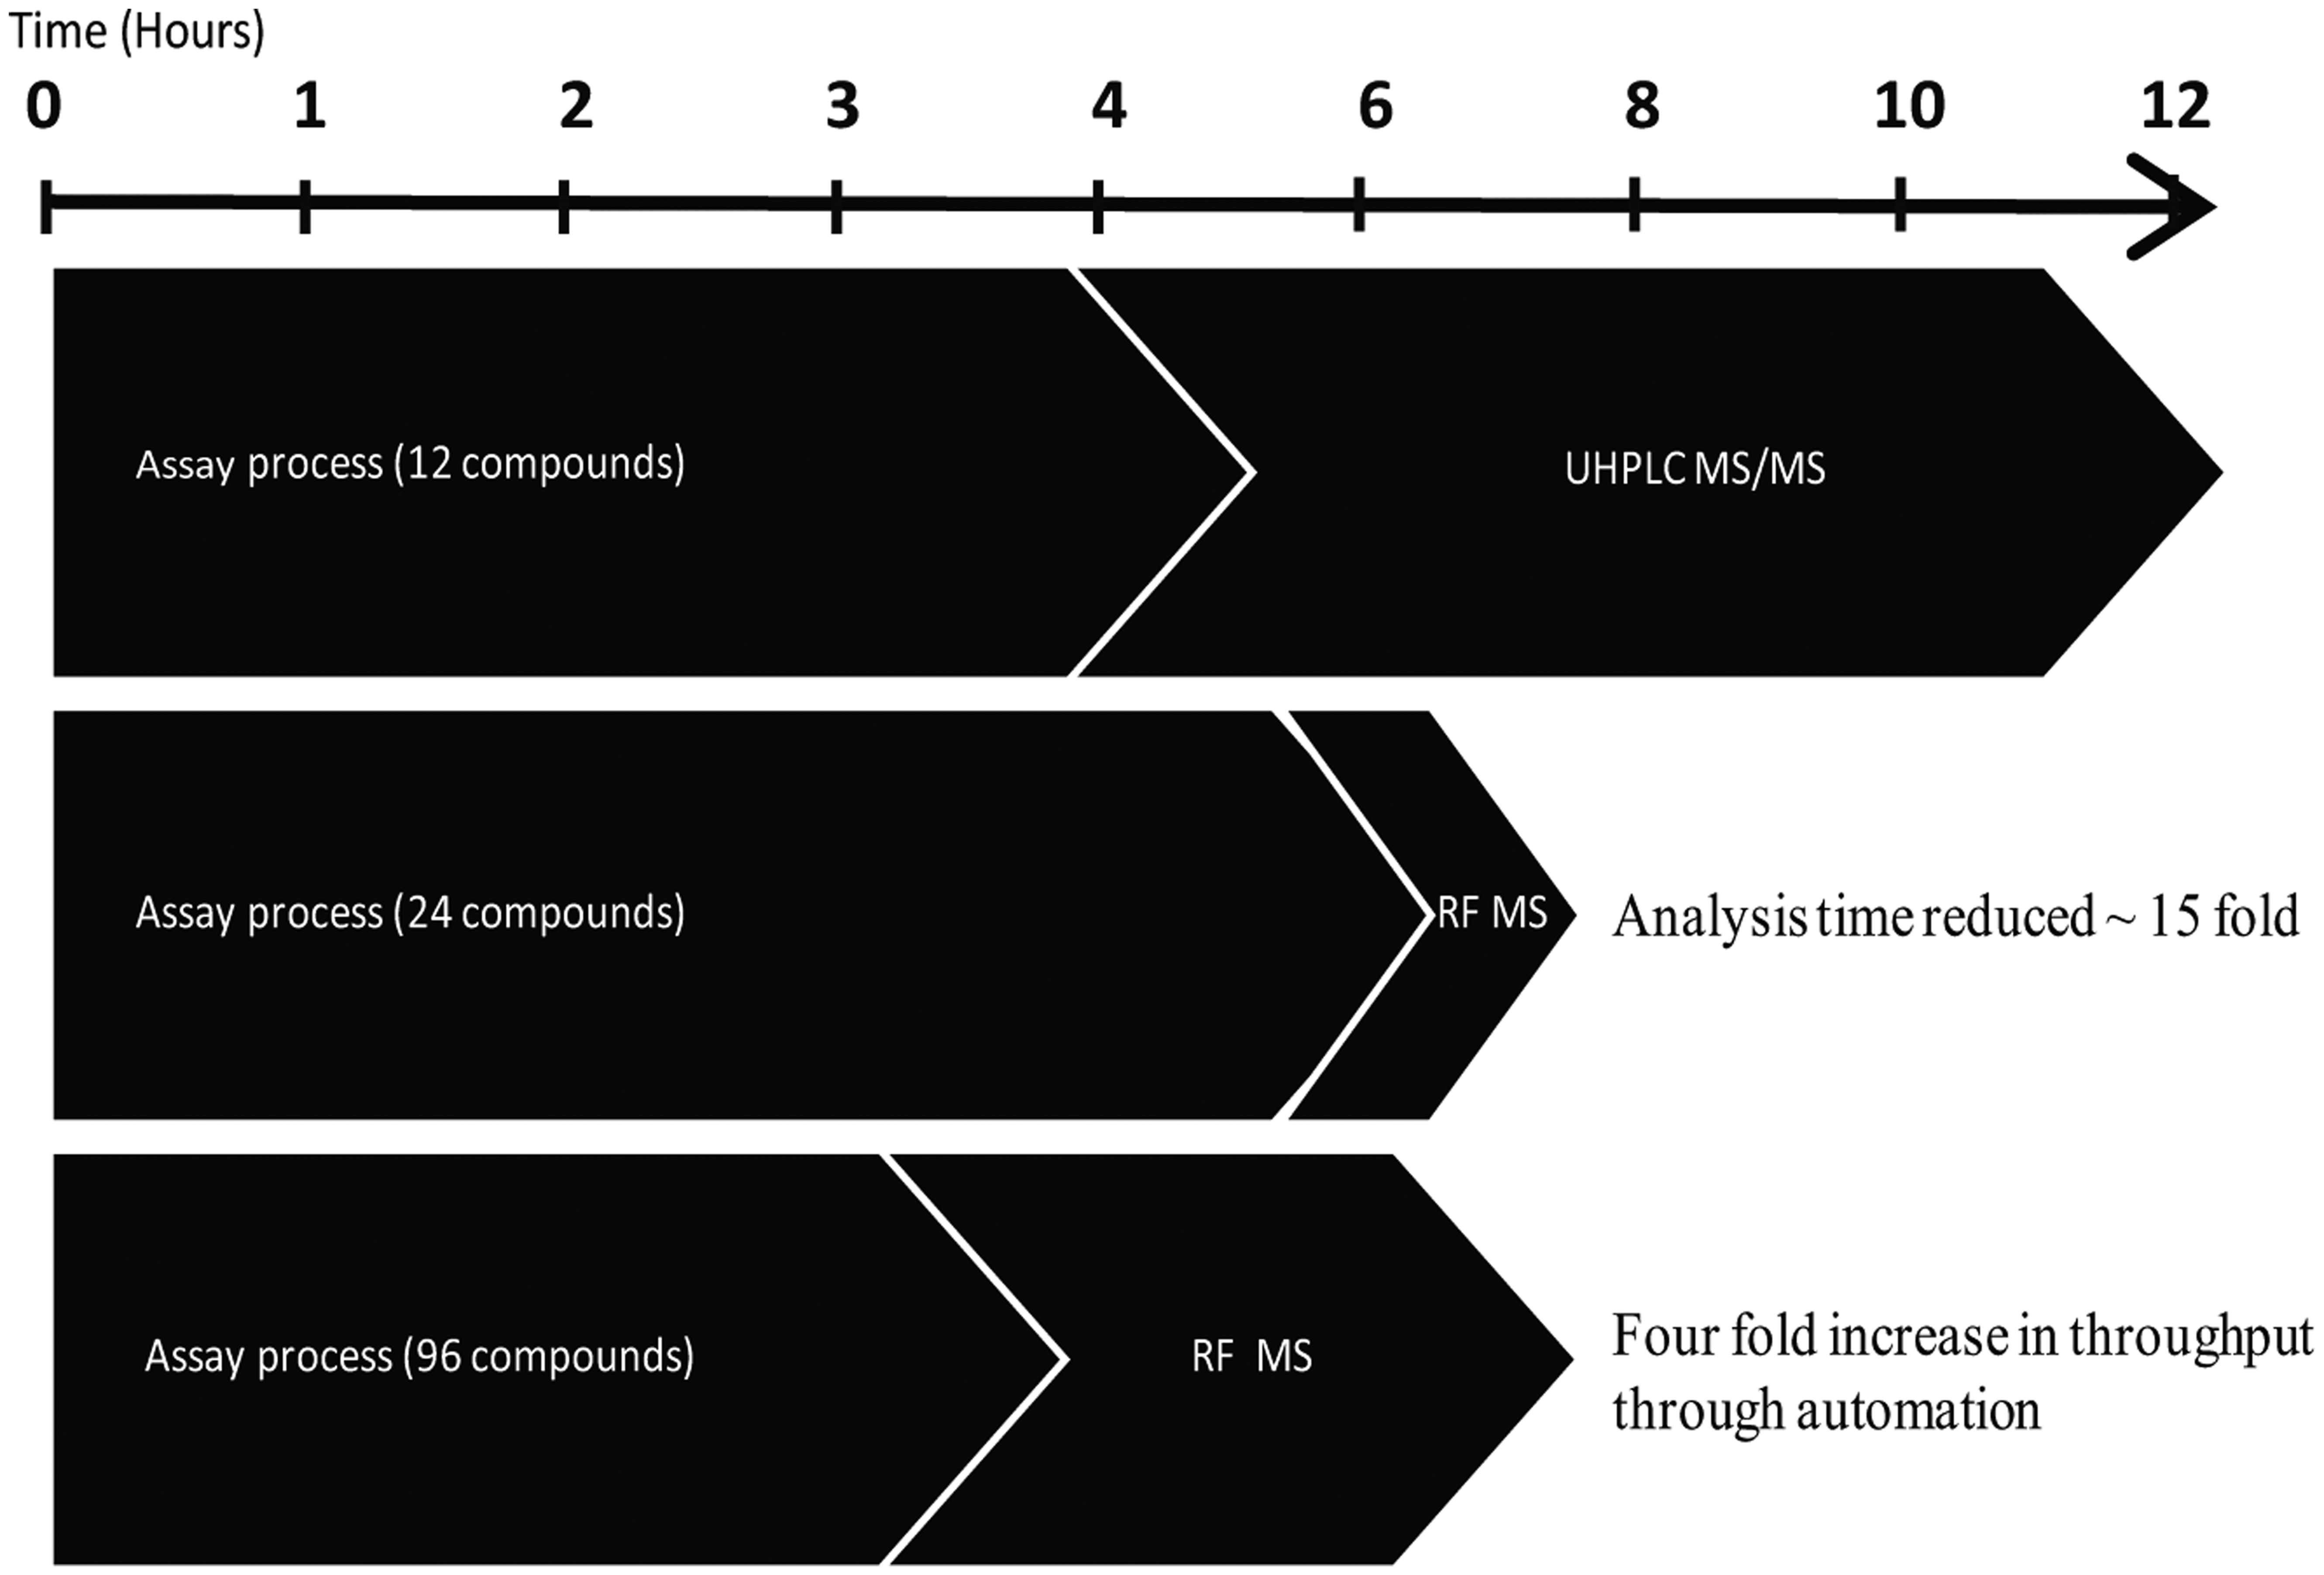
Diagram highlighting time saved through converting from ultra-high-performance liquid chromatography tandem mass spectrometry (UHPLC MS/MS) (2 min per sample) to RapidFire (RF) system (8 s per sample), reducing mass spectrometry (MS) analysis ~15 fold, and the increase in throughput accomplished by converting from a 6-well to a 96-well format, increasing throughput 4-fold (100 cpds/d).
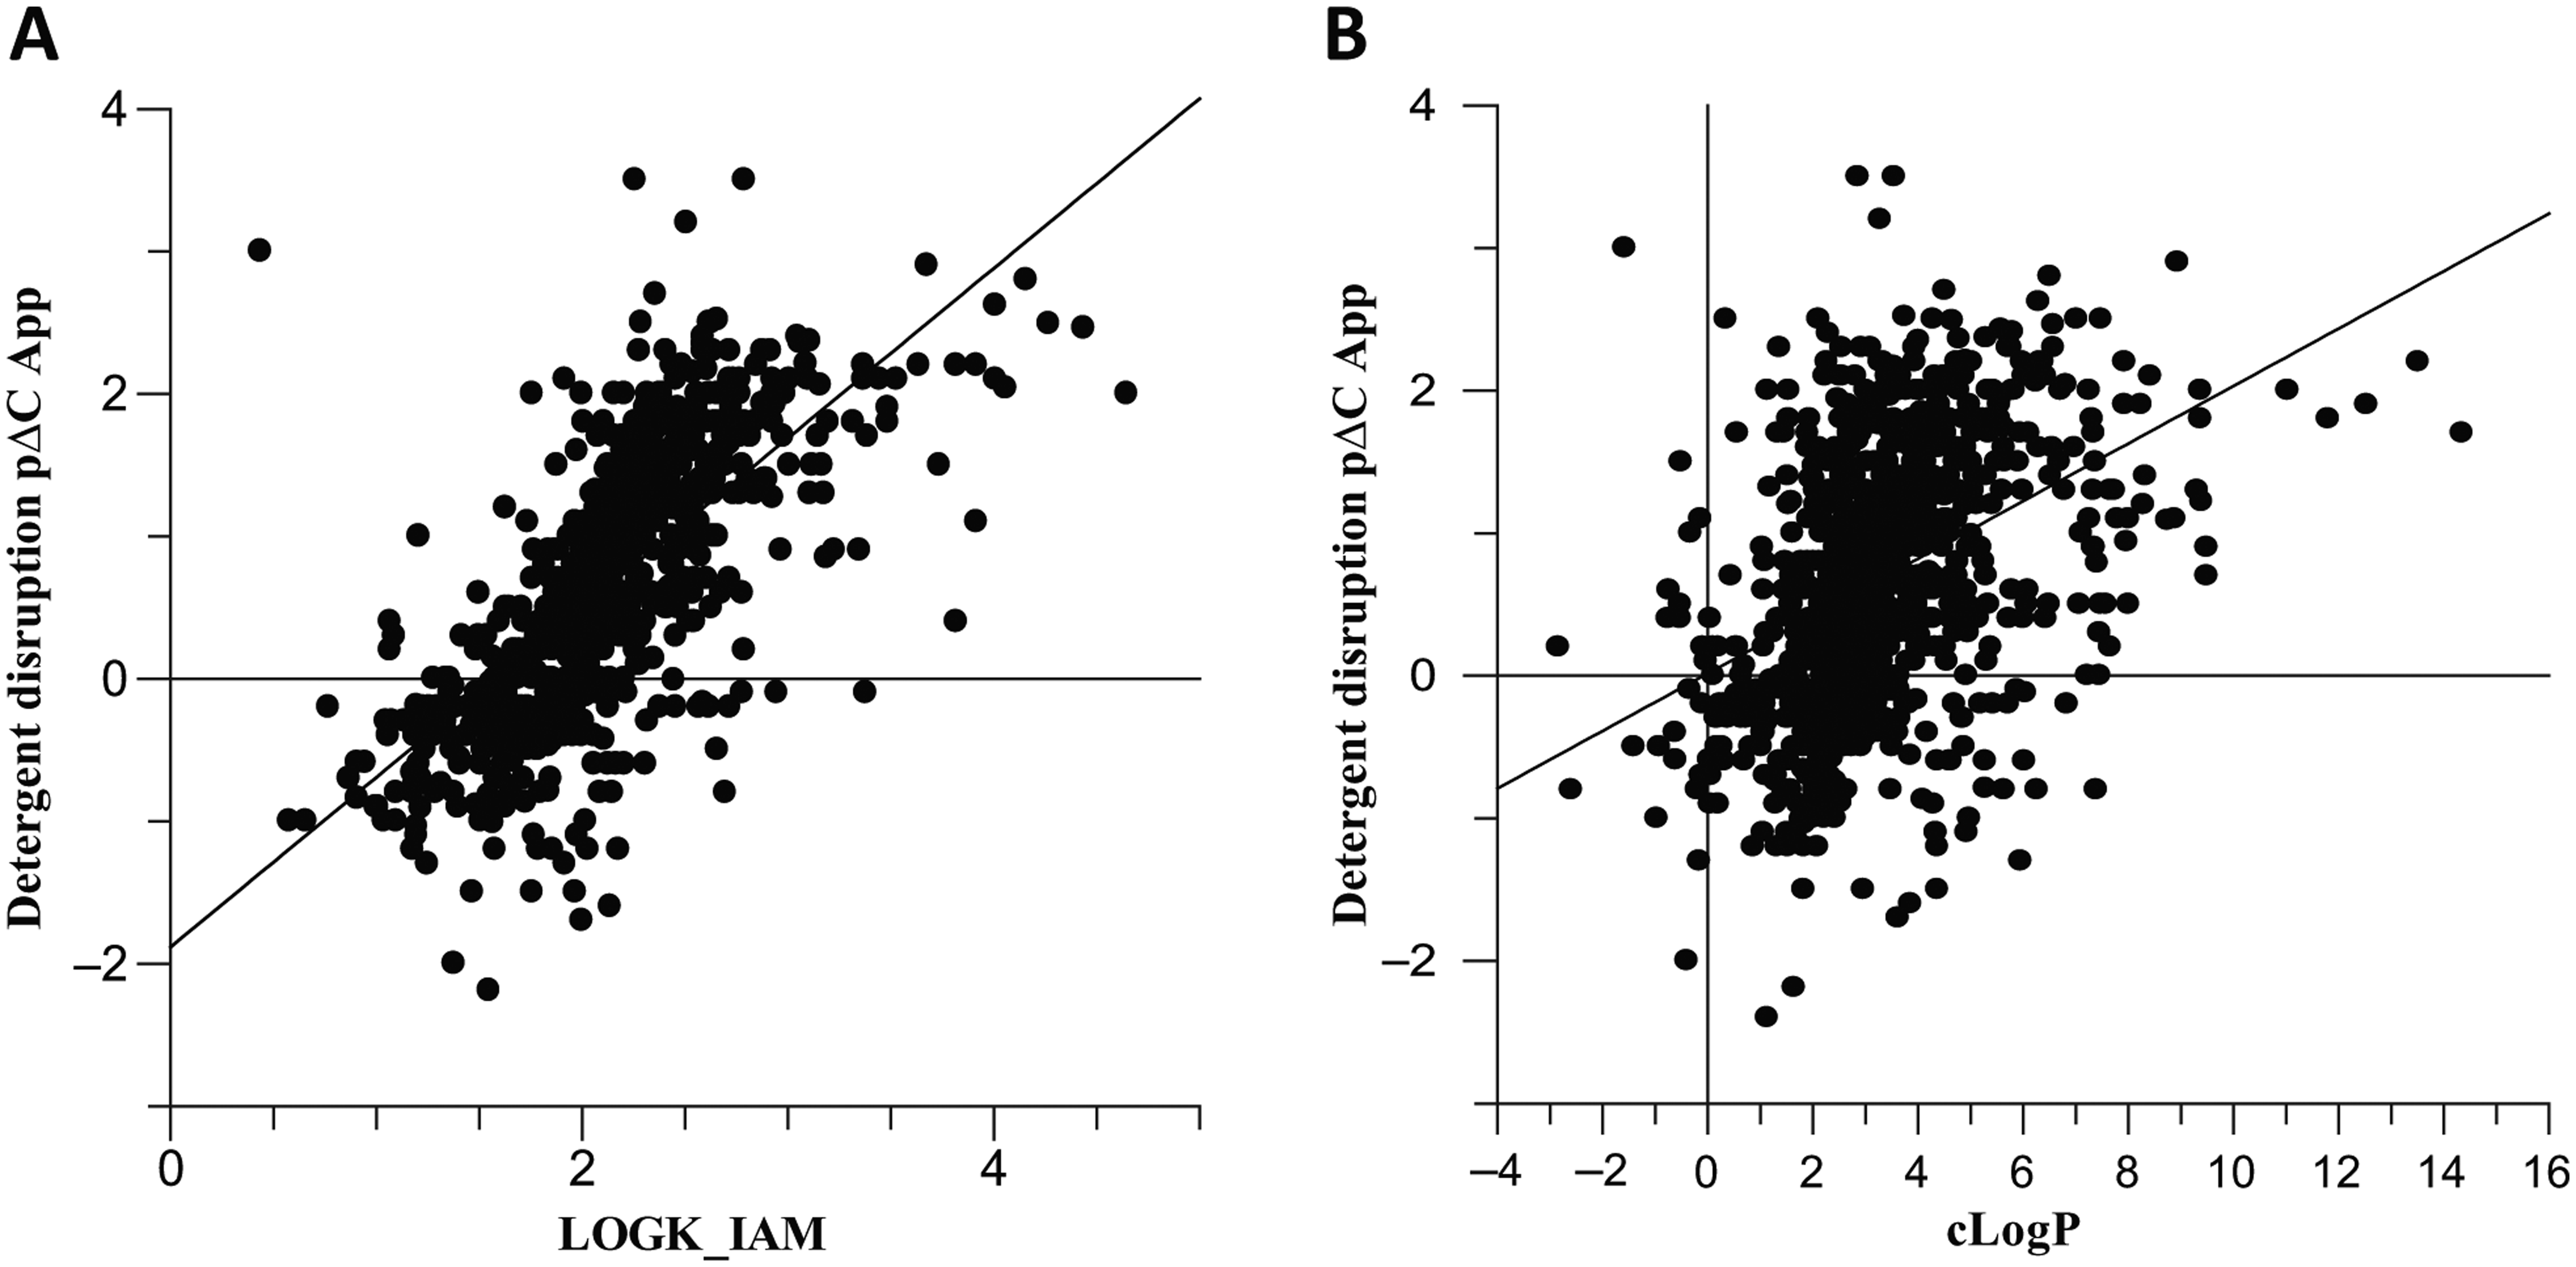
Having established a semi-automated RapidFire assay, we were able to screen over 500 diverse compounds from various projects to compare data from the cell concentration assay with that from measured physicochemical and biomimetic properties. As in vivo drug efficiency has been shown to be related to nonspecific binding of compounds to proteins and phospholipids, 11 we have investigated the relationships of these parameters with the cellular drug concentration. The data suggest that strong phospholipid binding measured by IAM partition (log k IAM) can be related to higher cell concentration relative to the external environment. Figure 6a shows the positive trend between the cell concentration data and the log k IAM values. Although strong IAM binding can be related to lipophilicity, such as clogP (calculated octanol/water partition coefficient), IAM binding is also influenced by the presence of positive charge and shape of the molecule. This may explain why clogP alone did not show a strong correlation to the cell concentration data ( Fig. 6b ). It is noteworthy that the lower pH in certain organelles (e.g., lysosomes) will also influence the degree of accumulation for basic compounds. 4 In reality, a combination of properties is likely to contribute to the overall concentration of compounds available in the cell, and the use of the high-throughput cellular concentration RapidFire MS/MS assay to measure this directly during lead discovery therefore offers a useful insight that will add value beyond estimations and measures of physicochemical properties.
(
To derive information on concentration of compound that is truly available to engage the target, one also needs to consider measurement of protein binding within the cell. Only free drug concentration is available to bind the target and exert a pharmacological effect. Recently, LC-MS methods for the rapid determination of unbound intracellular drug concentrations have been developed by Mateus et al.4,12 Incorporation of this measurement into the RapidFire cellular concentration assay process is ongoing, to allow the generation of free fraction data from the supernatants obtained from the initial cellular concentration assay. We are also continuing to explore how we can perform differential cell disruption as a means to explore subcellular organelle distributions. In addition, work is ongoing to understand whether differences in intracellular compound concentration are observed for the same compounds in different cell types. Clearly, the effects of different transporters and other active transport mechanisms may affect the data, so it is important to understand how representative the HeLa cell data are of more physiologically relevant cell types.
In summary, advances in sensitivity and throughput of analytical techniques have enabled us to develop a high-throughput robust assay for the measurement of intracellular compound concentration for routine use to support lead optimization. These data can be used to help understand the complexity of the properties that drive cell penetration and accumulation of compounds inside the cell. This information can be used to direct chemistry efforts and aid in the design of compounds more likely to give positive cellular assay data but also potentially to reduce time spent assaying inactive compounds. A direct measurement of relative compound concentration inside the cell as described here could replace some of the more indirect methods such as artificial membrane permeability that are currently used to estimate compound permeability. Clearly, for late-stage compounds or clinical candidates, a more detailed investigation of concentration of drug at the site of action may be required, rather than an estimate as is provided here. However, the application of assays such as this early in discovery should help in the overall goal of reducing attrition due to a lack of efficacy at later, more costly stages of the drug discovery process.
Footnotes
Acknowledgements
For intellectual input and sponsorship of the project, the authors thank Stuart Baddeley, Steven Hood, and Melanie Leveridge.
Declaration of Conflicting Interests
The authors declared no potential conflicts of interest with respect to the research, authorship, and/or publication of this article.
Funding
The authors disclosed receipt of the following financial support for the research, authorship, and/or publication of this article: The work of Per Artursson and Andre Mateus was supported by the Swedish Research Council (grant approval no. 2822).