
Abstract
High-throughput screening (HTS) on neurons presents unique difficulties because they are postmitotic, limited in supply, and challenging to harvest from animals or generate from stem cells. These limitations have hindered neurological drug discovery, leaving an unmet need to develop cost-effective technology for HTS using neurons. Traditional screening methods use up to 20,000 neurons per well in 384-well plates. To increase throughput, we use “microraft” arrays, consisting of 1600 square, releasable, paramagnetic, polystyrene microelements (microrafts), each providing a culture surface for 500–700 neurons. These microrafts can be detached from the array and transferred to 384-well plates for HTS; however, they must be centered within wells for automated imaging. Here, we developed a magnet array plate, compatible with HTS fluid-handling systems, to center microrafts within wells. We used finite element analysis to select an effective size of the magnets and confirmed that adjacent magnetic fields do not interfere. We then experimentally tested the plate’s centering ability and found a centering efficiency of 100%, compared with 4.35% using a flat magnet. We concluded that microrafts could be centered after settling randomly within the well, overcoming friction, and confirmed these results by centering microrafts containing hippocampal neurons cultured for 8 days.
Keywords
Introduction
Neurological diseases and disorders such as Alzheimer’s disease, Parkinson’s disease, and autism spectrum disorder affect millions of people worldwide. However, most of the drugs available for these diseases and disorders are ineffective. With the increased prevalence of phenotypic screening, new opportunities exist to discover both new targets and new drugs to treat these diseases. Of the 28 new small-molecule entities (NMEs) approved by the US Food and Drug Administration (FDA) between 1999 and 2008, seven were developed from phenotypic screens based on the central nervous system (CNS). 1
The typical cost of a high-throughput screening (HTS) campaign is estimated to be ~$1.00 per well or $500,000 for a screen of half a million compounds. 2 These costs, however, are greatly increased for screens using primary cells because of the high cost of raising and sacrificing animals to harvest tissue. For neurons specifically, an even greater cost is incurred because of the postmitotic nature of these cells and the density with which they must be plated. Plating densities vary depending on the type of assay performed, but typically screens use between 5000 and 20,000 neurons per well for proper growth and maturation.3–5 In a high-content screen using primary neurons to identify compounds that promote neurite growth, Al-Ali et al. used 1000 cells per well in 96-well plates; however, these cells were fixed and imaged after 48 h. 3 For assays requiring functional neuronal networks, higher densities and longer culturing periods are required. 6 Thus, due to the high costs and the large number of neurons required, there is an unmet need to develop higher-throughput methods for neuronal screens. Plating neurons in 1536-well microtiter plates would increase throughput, but this approach is hindered by evaporation issues and difficulty with seeding cells at the bottom of the wells.
As highlighted in a recent review by Moraes, novel microfluidic and microengineered systems are quickly coming online to address the pitfalls that exist in modern screening methods.
7
Along these lines, we previously reported the use of “microraft” array technology for screening (
Fig. 1A
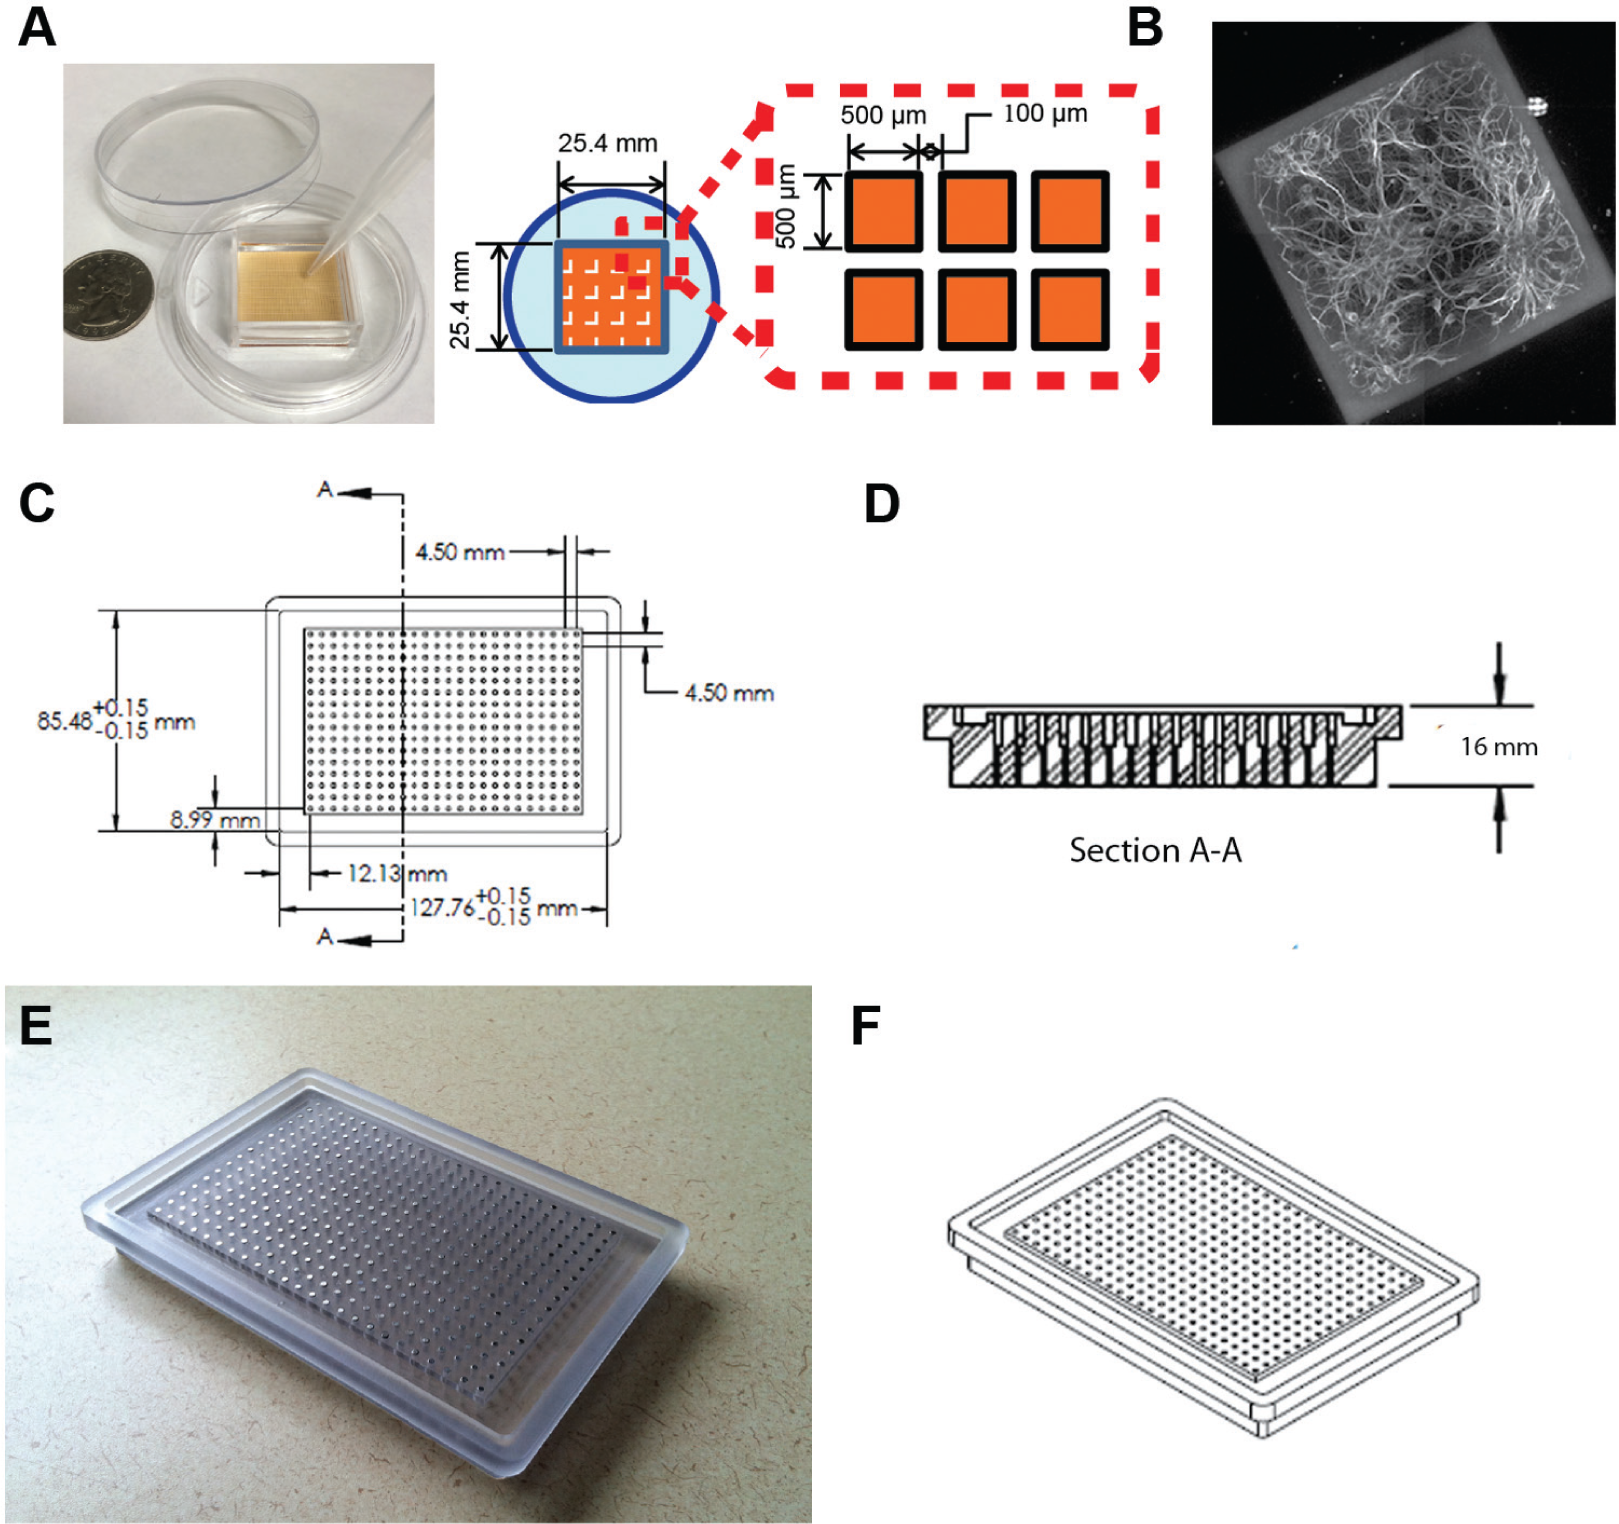
Microraft arrays and three-dimensional modeling and drawings of the magnet array plate. (
One foreseeable application of this technology to screening is in the area of high-content screening. High-content screening is the simultaneous extraction of data from multiple cellular parameters from many cells, usually using high-content imaging systems. 11 High-content imaging systems use automated platforms, plate and fluid handlers, and special software that is beyond that of regular microscopes and designed specifically for high-density microtiter plates. Unlike plate readers, high-content imagers provide morphological and spatial information about the cells being screened. 12 This information is vital in screens for diseases such as Alzheimer’s and fragile X syndrome, for which it is beneficial to observe synapse morphology and function. However, a major caveat to these systems is that, in their automated processes, the objectives are usually positioned at the center of the wells by default as they traverse through the plate. Because microrafts are approximately 11 times smaller than the wells, they can settle at various locations at the bottom of the well. Therefore, to realize the potential for the microraft array technology and increase throughput for high-content screening, we focused on centering the small microrafts within the microtiter wells to facilitate automated imaging. To do this, we developed a special magnet array plate that functions as a centering device to fully exploit the advantages of using microraft arrays for screens.
Materials and Methods
Design and Analysis
Three-dimensional modeling and detailed drawings of the magnet array plate were created using SolidWorks 2012 (Dassault Systemes, Vélizy-Villacoublay, France). Finite element analysis was performed using COMSOL Multiphysics Version 4.3 (COMSOL, Burlington, MA). Model I was created axial-symmetrically, whereas Models II and III were created three-dimensionally. In all cases, the magnets were modeled with a relative permeability of neodymium of 1.05 and a remanent flux density of 1.48 T, which is characteristic of a 52 MGOe neodymium magnet. A “physics-controlled” extra-fine mesh was used in all models.
Magnet Array Plate Materials
The magnet array plate was fabricated from LEXAN polycarbonate. Three hundred and eighty-four magnets (Model D14-N52; K&J Magnetics, Pipersville, PA) were used for the plate. The magnets were cylindrical in shape with a diameter of ~1.6 mm and a length of 6.35 mm. These magnets are made of grade N52 NdFeB with a NiCuNi plating and a maximum field strength of 1.48 T.
Magnet Array Plate Fabrication
The magnet array plate was fabricated via a CNC (computer numerical control) milling process. Holes were drilled at maximum tolerance. Following the machining process, the magnets were inserted by hand and/or glued with cyanoacrylate when a snug fit was not available.
Microraft Array Fabrication
Microraft arrays were fabricated according to previously published methods.9,10 Briefly, soft lithography was used to make the PDMS template containing an array of microwells (each well has width × length × height = 500 µm × 500 µm × 200 µm; array size = 25.4 mm × 25.4 mm). The PDMS template was then dip coated with a 20% polystyrene solution in gamma-butyrolactone (GBL) containing 4% iron oxide particles. The arrays are then placed in a convection oven at 95 °C for 16 h to evaporate GBL to create the microrafts. The array was glued to a polystyrene cassette to facilitate handling, and then surface treated with air plasma (Harrick Plasma, Ithaca, NY) for 2 min.
Microraft Transport
For this study, microrafts were ejected from the array and individually transported to microtiter plates in ~5 µl volumes using a single-channel pipette with a large orifice tip (02-707-134; Fisher Scientific, Hampton, NH). Microtiter plates used for this study were 384-well Small Volume, LoBase, Polystyrene, µClear, black, tissue-culture-treated, sterile plates (788092; Greiner BioOne, Frickenhausen, Germany).
Centering Performance Assessment
Centering performance was evaluated based on the percent centering and the centering efficiency as follows (see Fig. 4 ):

where:
L = The distance from the center of the well to the center of the microraft when it is located flat on the bottom and against the edge of the well (0.643 mm for Greiner BioOne 788092); and d = The distance from the center of the well to the center of the microraft at the position where it rests in the well.

Please note that in calculating centering efficiency, the value of percent centered was taken relative to 75% because this value of centering ensures that a sufficient portion of the centered microraft is within the field of view for automated imaging.
Cell Culture
All animal procedures were carried out in accordance with the University of North Carolina at Chapel Hill Institutional Animal Care and Use Committee (IACUC). Dissociated hippocampal cultures were prepared at embryonic day 18 from Sprague–Dawley rat embryos as previously described 13 with some modifications. Briefly, hippocampal tissue was dissected in dissociation media (DM) containing 82 mM Na2SO4, 30 mM K2SO4, 5.8 mM MgCl2, 0.25 mM CaCl2, 1 mM HEPES, 20 mM glucose, and 0.001% Phenol red. Equal volumes of TrypLE Express (Invitrogen, Carlsbad, CA) and DM were added to the tissue and incubated at 37 °C for 8 min. Tissue was then rinsed and gently triturated in neurobasal media (NBM; Invitrogen) supplemented with 1× B27 (Invitrogen), 1× antibiotic–antimycotic (Invitrogen), and 1× Glutamax (Invitrogen). Dissociated cells were then centrifuged (67×g) for 7 min at 4 °C, and resuspended (12×106 neurons/mL) in NBM. Prior to cell dissociation, microraft arrays were coated with poly-D-lysine (80 µg/mL; high molecular weight: 500–550 kDa) at 37 °C overnight and then rinsed three times with phosphate buffered saline (PBS). Neurons were then plated on the poly-D-lysine-coated raft arrays (1 million neurons/array). Rafts were released the following day and maintained in NBM until 8 days in vitro (DIV). We released and transferred the microrafts after 1 DIV because, at this stage, their processes are not long enough to extend over the PDMS borders between the microrafts while they are still embedded in the array. Waiting longer to release and transfer microrafts may cause injury to the neurons through shearing of processes that have grown over the borders.
Fluorescent Dye Labeling
The cell viability assay was performed as described previously. 8 Briefly, cells were grown for 8 DIV and then stained with a solution containing Sytox Green Nucleic Acid Stain (1:1000; Life Technologies, Carlsbad, CA) and NucBlue Live Cell Stain Ready Probes/Hoechst 33342 (2 drops/mL; Life Technologies) for 5 min at room temperature to label dead/dying cell nuclei and all cell nuclei, respectively. Following staining, the cells were rinsed three times for 2 min each with PBS and then fixed for 30 min with 4% formaldehyde. After fixation, cells were rinsed three times for 2 min each with PBS and finally placed in 0.1% NaN3 before imaging.
Imaging and Image Processing
Imaging was performed on an Andor XDi imaging system featuring a Yokogawa spinning disk confocal unit and an Olympus IX81-ZDC2 inverted microscope with a motorized stage by Ludl as described previously. 14 The speed of image acquisition of this spinning disk confocal imaging system is comparable to that of high-content imagers (e.g., the BD Pathway) with a scan speed of 36 s per well for two-channel fluorescence.
Montages (2×2) were taken of each microraft with a 20× objective and stacks of 10–20 slices each spaced 0.85 µm (z-distance) apart. Dead cells stained by Sytox were captured using 488 nm laser excitation and a 525–530 nm single-band fluorescence filter (Semrock Brightline; Semrock, Rochester, NY), whereas the cell nuclei representing all cells were captured using 405 nm laser excitation and a 447–460 nm single-band fluorescence filter (Semrock Brightline). After acquisition, all images were analyzed with ImageJ as described previously. 8 Briefly, images were imported using the Bio-formats plugin, and slices were summed using maximum intensity projection and then converted to 8-bit. The projected images were thresholded, and the number of stained nuclei were counted within a 300 µm diameter region of interest in the center of the rafts using the “Analyze Particles” command.
Statistical Analysis
Statistical analysis was performed using GraphPad Prism 6 software. Mean percent centering, centering efficiency, and percent viability were plotted as mean ± SEM (standard error of the mean). Statistical significance was tested with a nonparametric Mann–Whitney test. Statistical significance with p-values <0.01 are indicated with asterisks. Correlation values for the magnetic field analysis were calculated using Microsoft Excel’s correlation function, which is based on the sample Pearson correlation coefficient.
Results
Design and Fabrication of Magnet Array Plate
Our goal was to design a magnet array plate that would center microrafts within each well of a standard 384-well microtiter plate and be compatible with high-throughput fluid-handling systems. The design of the magnet array plate began with the ANSI/SLAS 2004 microtiter plate standard footprint, which has been adopted by all major manufacturers and defines the outside footprint and corner radius of all microtiter plates regardless of their well density. Using this standard and typical well-to-well spacing found in 384-well microtiter plates, the geometry of the magnet array plate was designed in plan view ( Fig. 1C ).
In this design, the magnets were positioned at the centers of each well with a center–to-center distance of 4.5 mm. Port holes located on the bottom of the plate, centered under each magnet, allow the magnets to be replaced if needed ( Fig. 1D ). The outer rim of the plate is approximately 5 mm thick and serves to frame and secure the microtiter plate it supports.
The plate was designed to adapt with commonly used high-throughput fluid-handling machines (e.g., Tecan or Hamilton) (
Fig. 1D
). To magnetically secure the microrafts during automated fluid-handling operations, we designed the magnet array plate to fit within fluid-handling plate brackets designed for ANSI/SLAS 2004 microtiter plate footprints. The tops of the magnets were positioned flush with the top of the inside plate face and 2 mm above the channel. This design feature was intended to adhere to the design of low-base microtiter plates such that the magnets are flush against the bottoms of these plate types. Low-base plates are most commonly used in automated imaging because they facilitate the imaging of all wells, including those located on edges, and the flushness of the magnets is important for maximum attraction and centering of the microrafts to the bottom of the microtiter wells. The final design was machine milled from LEXAN polycarbonate and features 384 neodymium magnets (
Fig. 1E
Magnetic Field Analysis
Finite element modeling and analysis were performed to assess the nature of the magnetic field of the cylinder magnets relative to microrafts at various positions within the microtiter wells ( Fig. 2A ). We modeled commercially available magnets and analyzed 1.5 mm diameter (the smallest practical size for fabrication) and 1.6 mm diameter magnets, which are both similar in diameter to wells of a low-base 384-well plate. Results using the 1.5 mm diameter (results not shown) and 1.6 mm diameter cylinder magnets clearly showed that the magnetic field in the axial direction peaked at the center of the magnet ( Fig. 2B ), whereas the field in the radial direction peaked at the edge of the magnet ( Fig. 2C ). Furthermore, both magnetic fields followed a nonlinear decay the further away from the surface of the magnet ( Fig. 2D ). Because the magnetic field in the radial direction peaks at the edge of the magnet, it is more beneficial to use a magnet with a similar diameter to the bottom of the well, thus allowing the magnetic field in the axial direction that peaks at the center to dominate and better serve to center the microrafts. The 1.6 mm diameter magnet is nearly coincident with the area of the bottom of the well, so this magnet was selected and used in the remainder of the study.
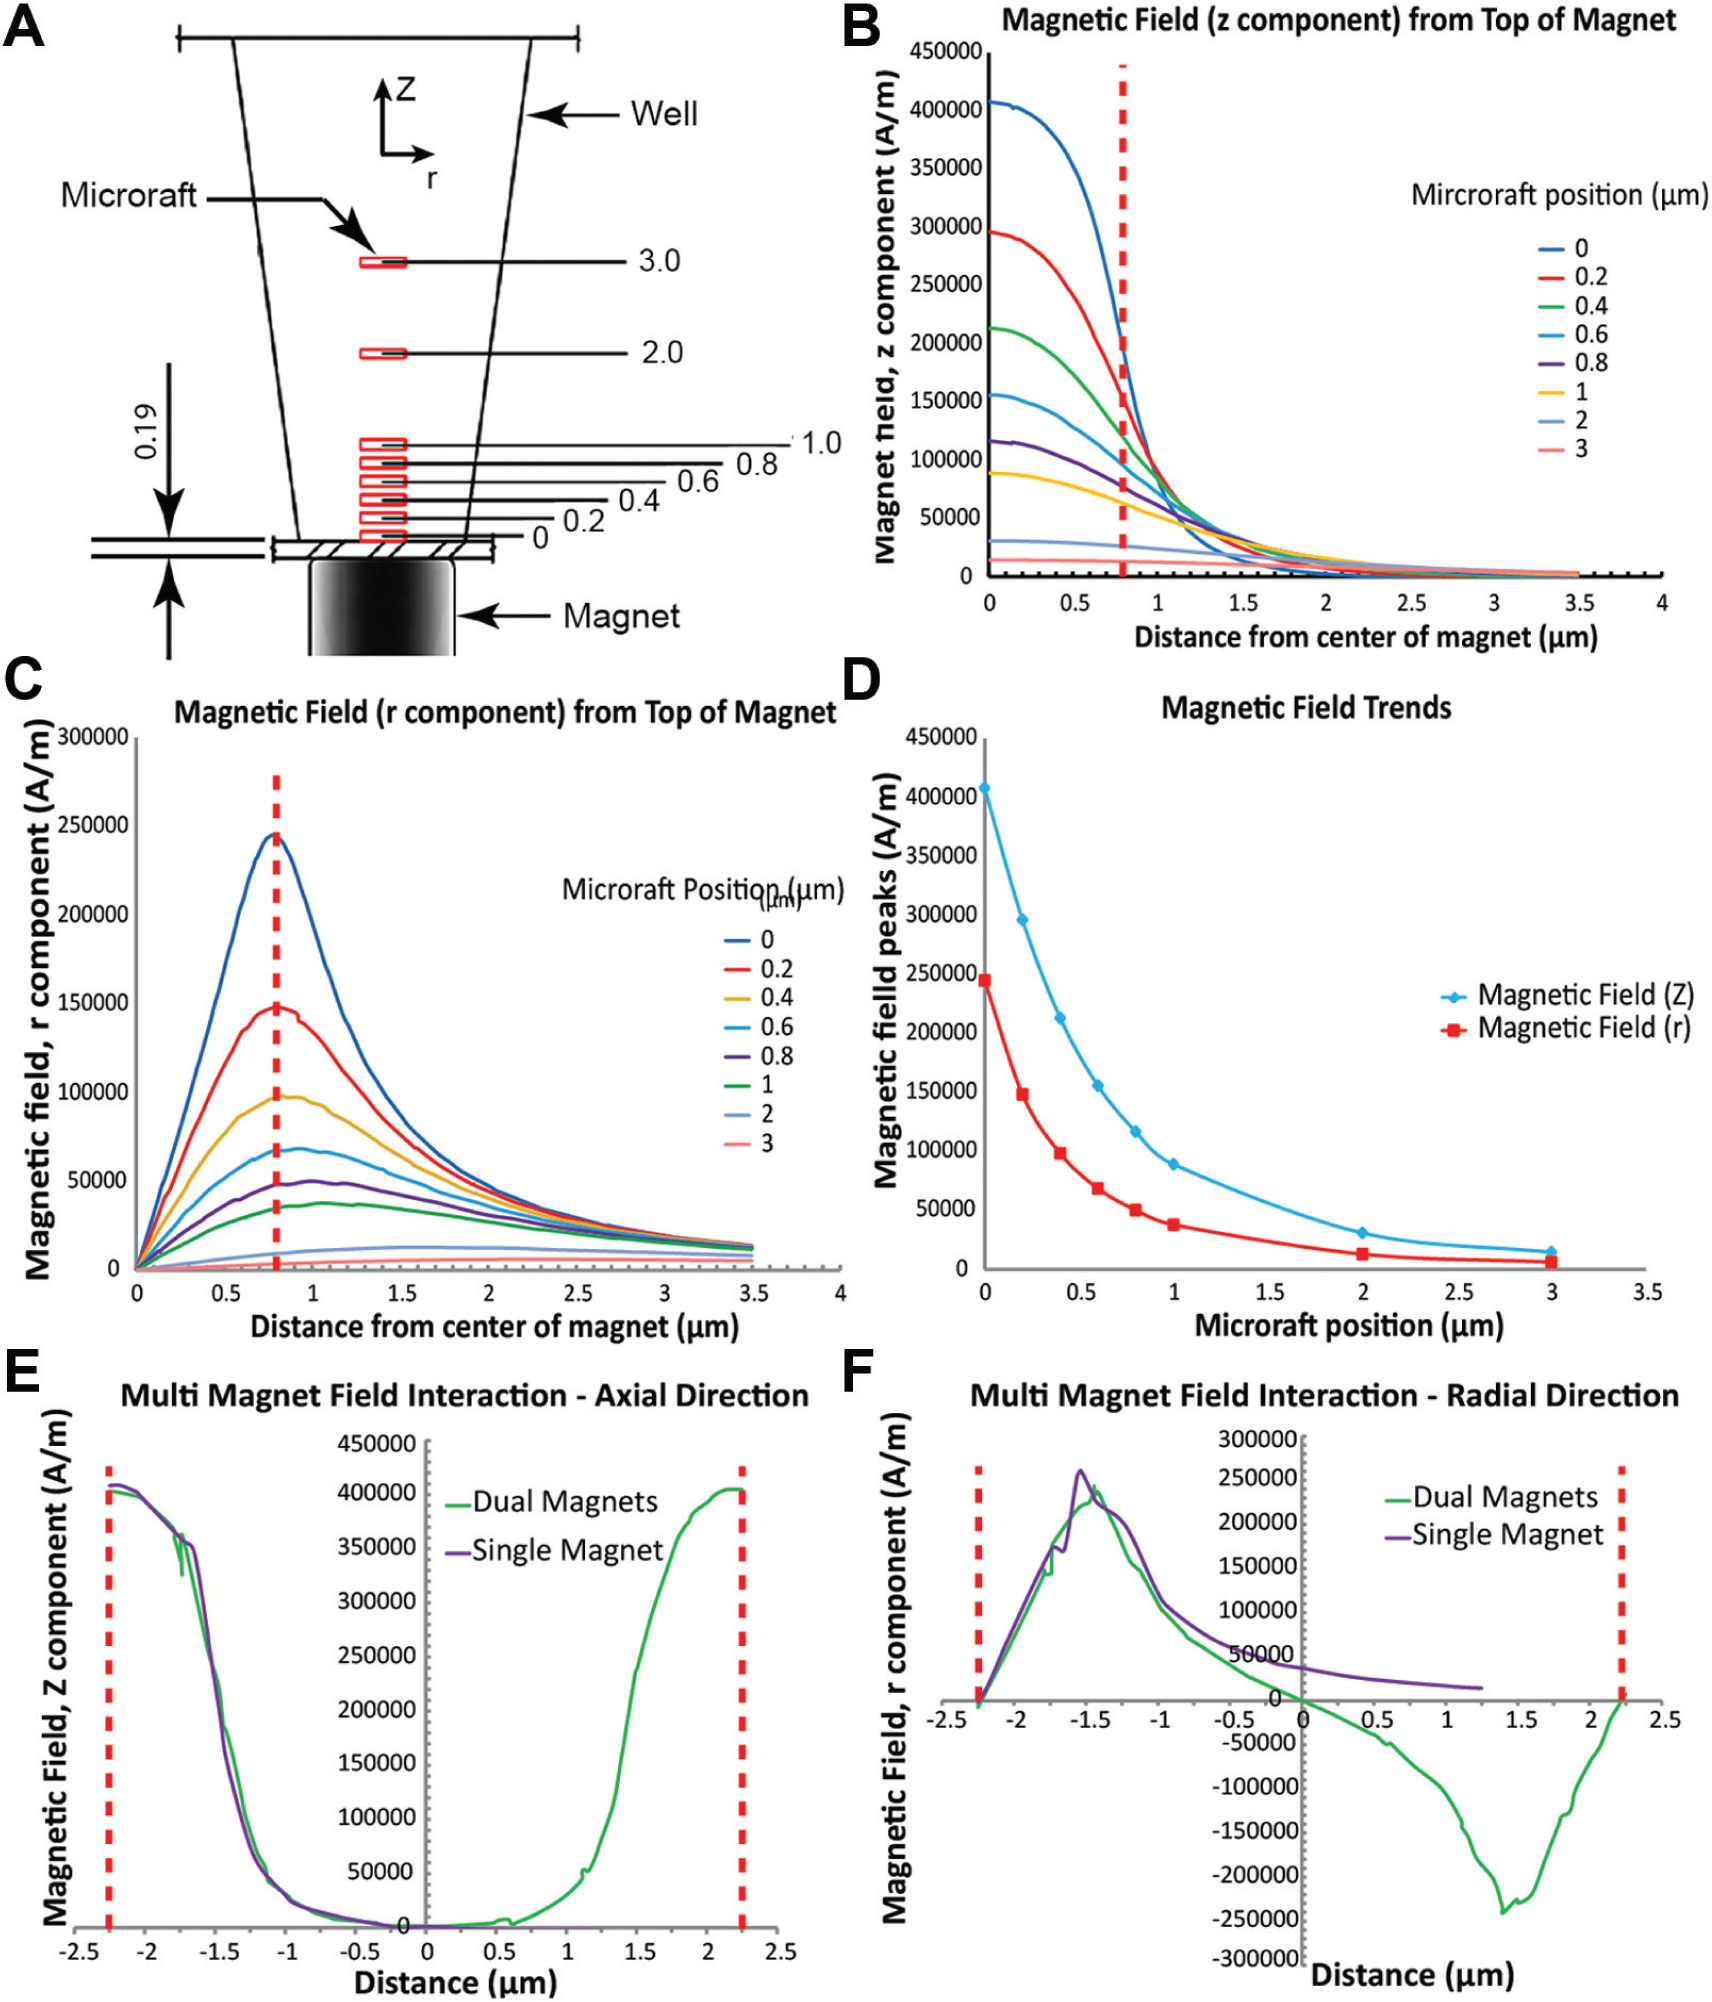
Results of the magnetic field analysis of a microraft at various heights within a microtiter plate well. The magnetic field peaks in the center and edge in the axial and radial directions of the microwell, respectively. Adjacent magnetic fields do not interfere. (
We next analyzed whether field interference existed between adjacent magnets. We created a model with two magnets spaced exactly at the center-to-center distance of adjacent wells. When analyzing the magnetic field in both the axial and radial directions (
Fig. 2E
Magnetic Force Analysis
With the proper size of the magnet determined and the nature of the interactions between adjacent magnets understood, we next sought to determine the force experienced by the microrafts at various locations within the microwells. It was important for us to understand the general trends of these forces in terms of not just how the forces on the microrafts relate to each other as their position changes both axially and radially within the well, but also how those forces relate to the force required to move the raft from a stationary position on the well bottom that was calculated kinematically. Forces were analyzed at center, quarter, and edge positions and heights ranging from 0 to 600 µm above the bottom of the microtiter plate to evaluate the influence of different locations where the rafts would be positioned following transfer ( Fig. 3A ). In the radial direction ( Fig. 3B ), all locations were significantly less than the forces experienced in the axial direction; however, these forces were still greater than the calculated 4.54 × 10⁻⁸ N force required to move a stationary microraft on the bottom of the microwell. The forces in the axial direction were clearly dominant over those in the transversal direction, due in large part to the size of the magnet relative to the microwell as previously described. More significant, however, was that for similar lateral positions (i.e., center, quarter, and edge locations), the forces were approximately the same ( Fig. 3C ). This implies that microrafts falling along the side of the wall would still be centered.
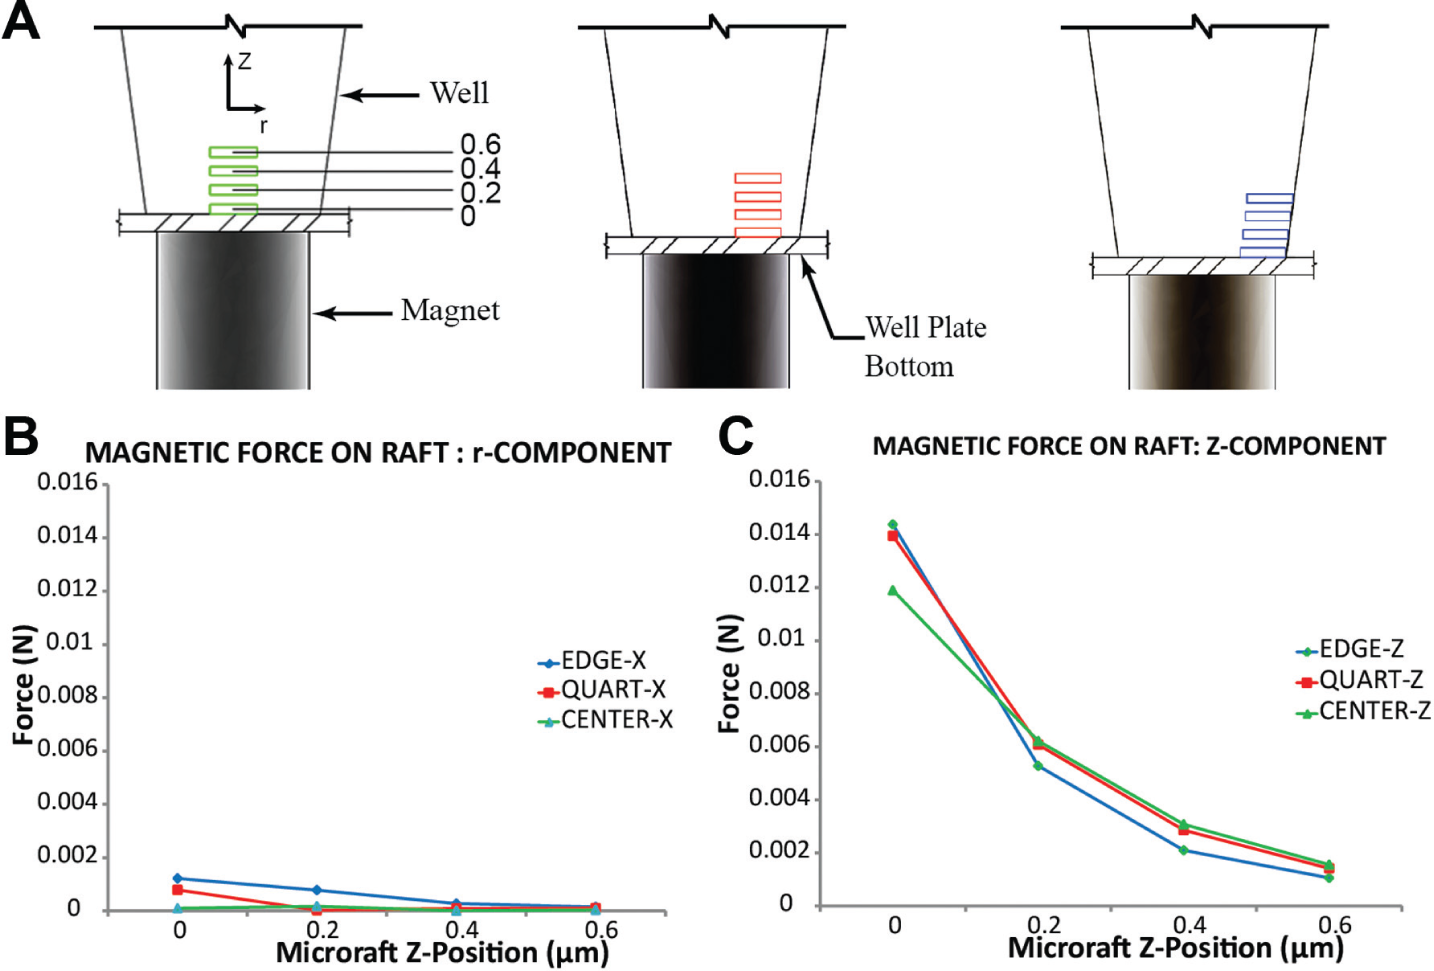
Magnetic force analysis of microrafts at different axial (Z) and radial positions. (
Centering Performance Evaluation
After performing finite element analysis supporting the proper design of the magnet array plate, we next wanted to experimentally test the performance of our prototype. Our goal was to first test the effectiveness of centering using the magnet array plate compared to the use of a conventional flat magnet. We wanted to determine whether having the magnet array plate in place during loading or after loading would yield equivalent centering efficiencies. The metrics used in these tests include percent centering and centering efficiency, which are formulated in the Methods section (
Fig. 4A
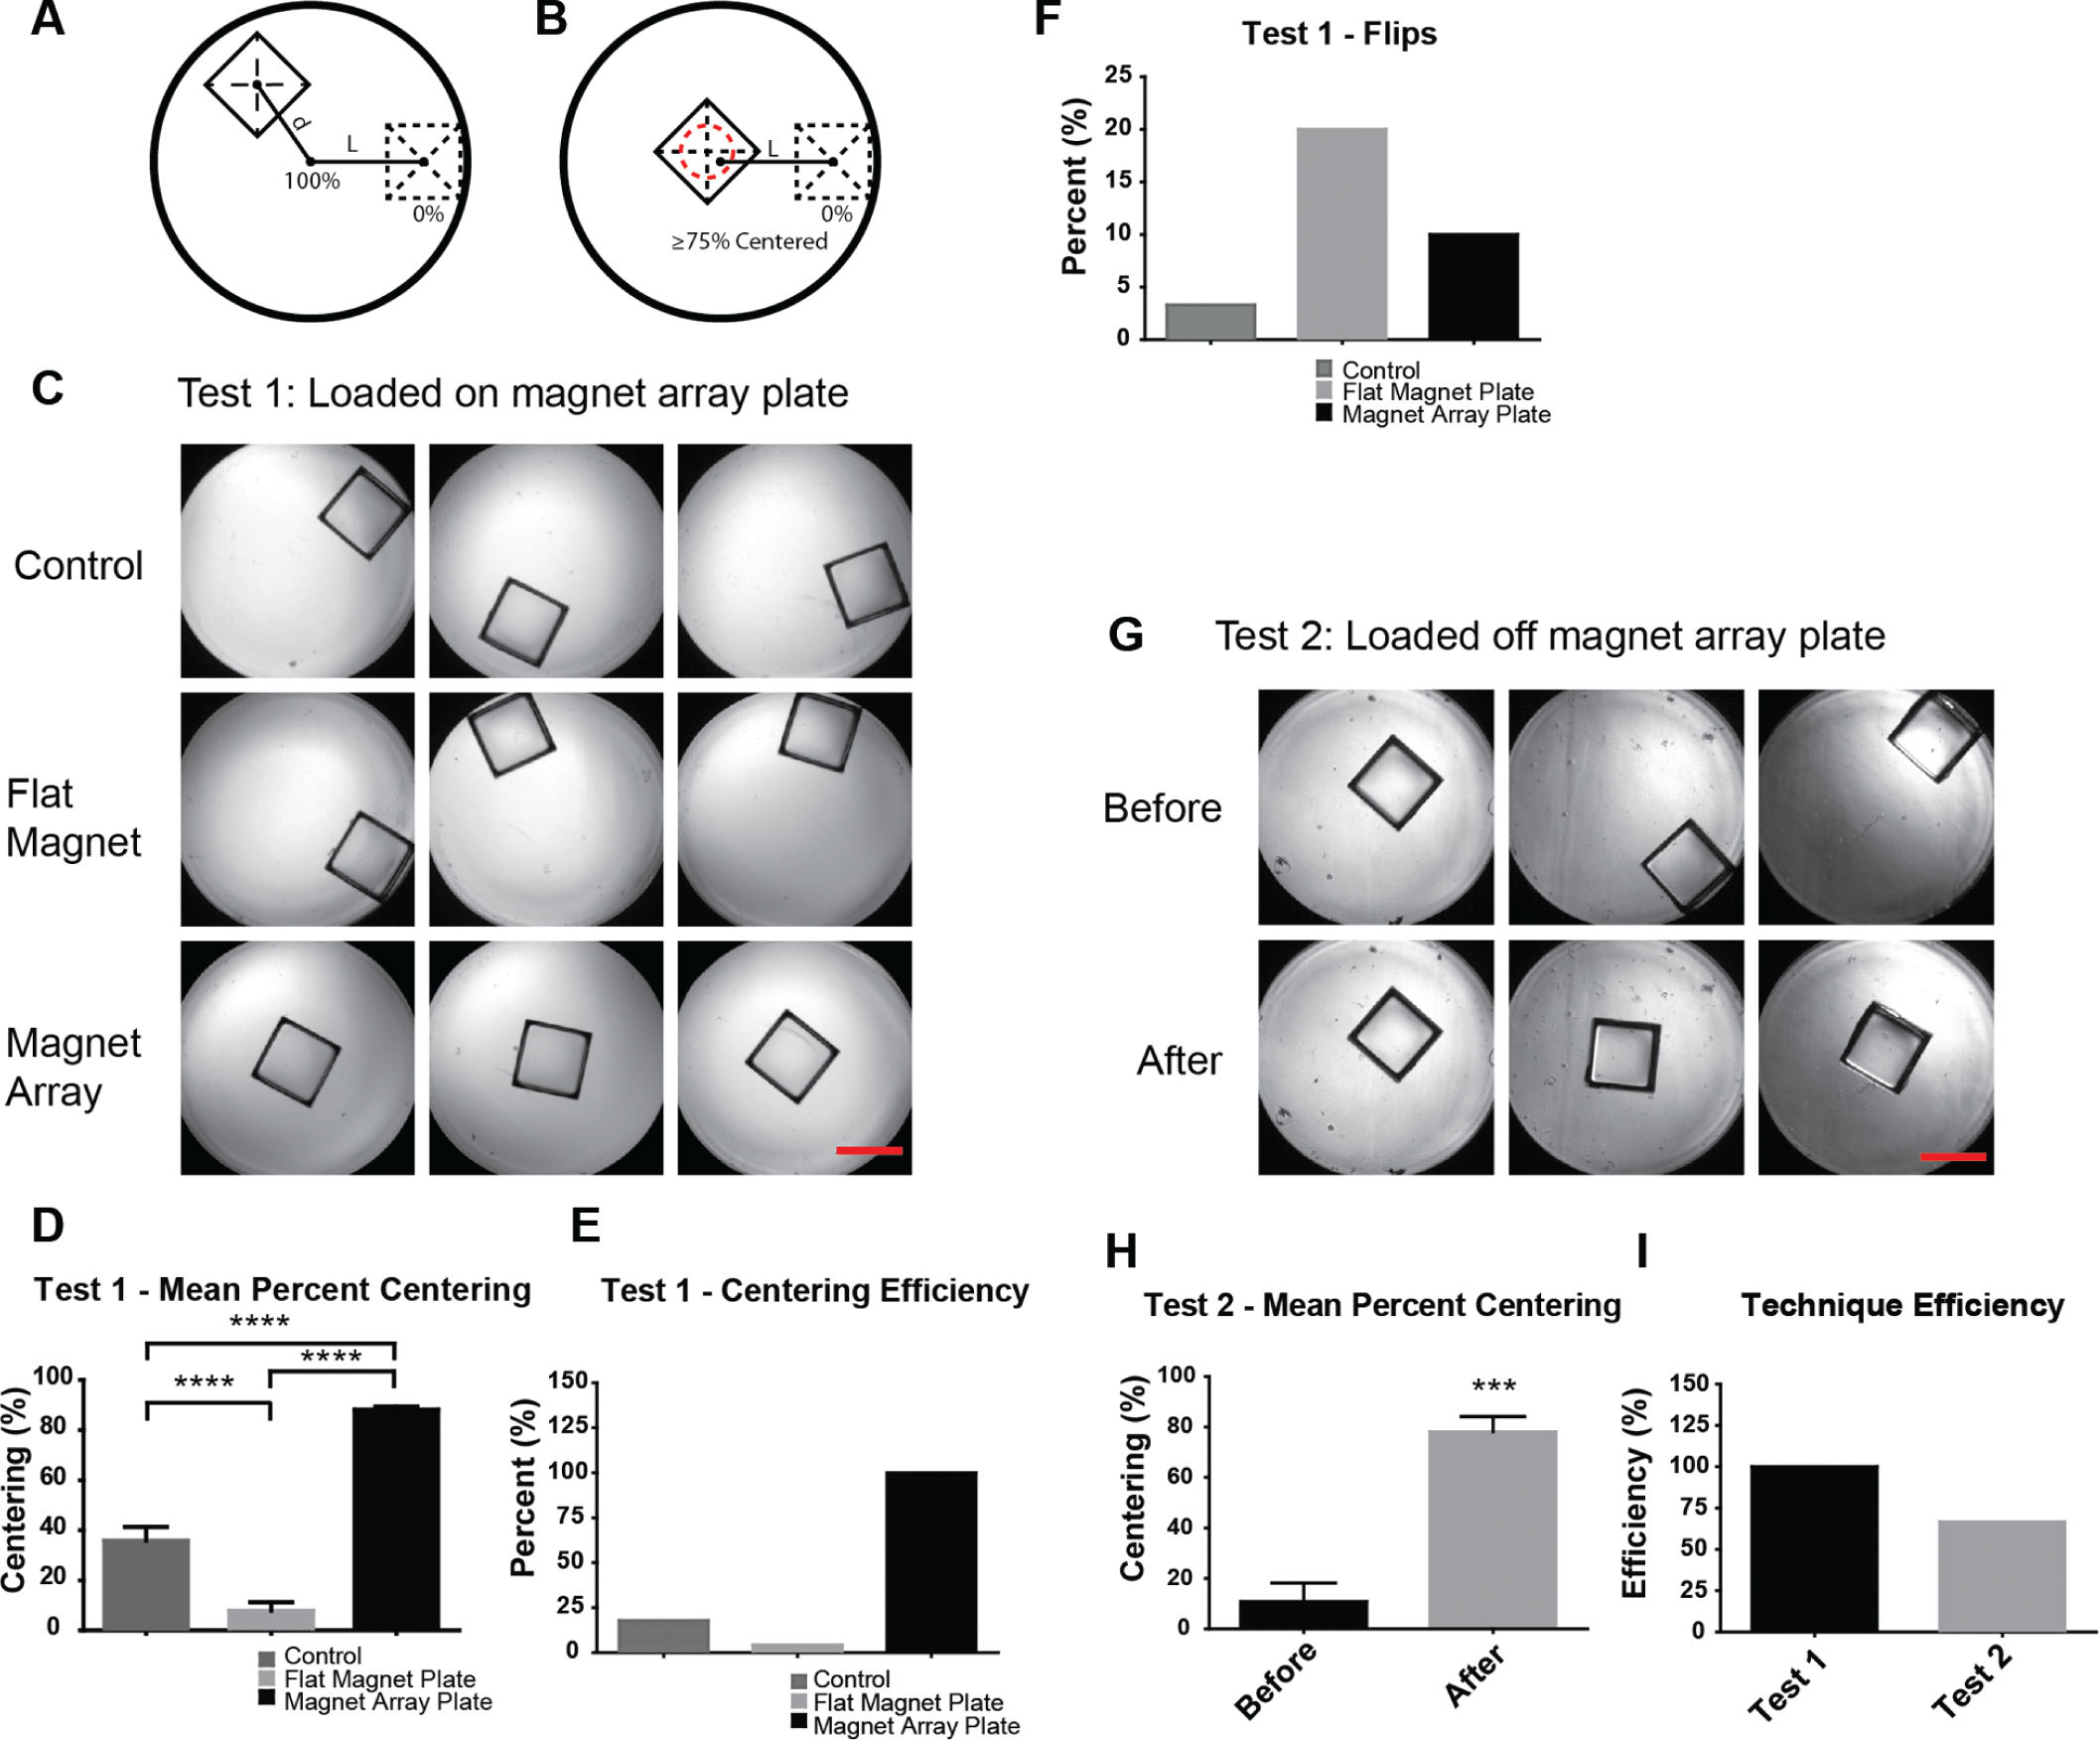
The magnet array plate effectively centers the microrafts. (
In our first test, the microtiter plate was positioned on top of the magnet array plate during loading of the microrafts (Test 1), and individual microrafts were transferred to the wells using a pipette as described in the Methods section. The centering performance of the magnet array plate was compared to a flat magnet plate, which contains a single flat plate magnet with an area similar to that of the microtiter plate, and a control sample that used no magnets. The magnet array plate showed a mean percent centering of 88.16% compared to 7.8% for the flat magnet plate and 35.85% for the control (
Fig. 4C
Although it did not occur in this study, in rare instances microrafts may land cell side down. However, in these instances, neither screening nor imaging is affected because the microrafts are slightly concave on their top surface, which prevents the adhered cells from coming in contact with the bottom of the well when it lands cell side down. This concavity also conveniently allows for similar objective distances regardless of whether the microraft is cell side up or cell side down. 10 We found that the microrafts land cell side up the majority of the time, and we believe this may be attributed to the drag created from the slight concavity on the top surface of the microrafts.
To observe whether the magnet array plate was able to center microrafts after microraft loading, we loaded microrafts into the microtiter plate, let them settle, and then placed the microtiter plate on top of the magnet array plate (Test 2). Images show that the microrafts were initially scattered within the wells, but after placing the microtiter plate on the magnet array plate, centering was achieved ( Fig. 4G ). When quantified, the mean centering was 10.8% before placement versus 78.1% after placement ( Fig. 4H ). Finally, comparing the technique used in Test 1 versus Test 2, the centering efficiency was 100% versus 66.7%, respectively ( Fig. 4I ). This result shows that to best achieve centering, it is better to first place the microtiter plate on top of the magnet array plate before loading the microrafts. However, should the microrafts become decentered as the result of movement or the plate being hit, centering can still be achieved by placing the loaded microtiter plate back on the magnet array plate. We’ve determined, however, that dislodging of the microrafts is unlikely because it would require moving the plate at a speed of 5.66 ft/s (calculation not shown) and stopping abruptly to create enough inertial force to overcome the frictional forces holding the raft in place.
Cell Viability Evaluation
We successfully demonstrated the ability of the magnet array plate to center microrafts. As a final measure of performance, we tested whether centering the microrafts affected cell viability. With the added acceleration of the microrafts, beyond that of gravity, due to the attractive force of the magnet, there was some concern that increased fluid shear forces may endanger the neurons attached to the microrafts. To determine if this was a threat, a cell viability assay was performed to determine the differences in viability between unreleased microrafts, microrafts that have been released and transferred, and microrafts that have been released, transferred, and centered.
Primary hippocampal neurons were plated on a microraft array at a density of 1 million cells. After 1 DIV, the microrafts were released from the array and transferred to a 384-well microtiter plate. At 8 DIV, cell viability was quantified using a live/dead assay, and immunostaining for MAP2 was used as a neuronal marker to characterize neuronal morphology (
Fig. 5A
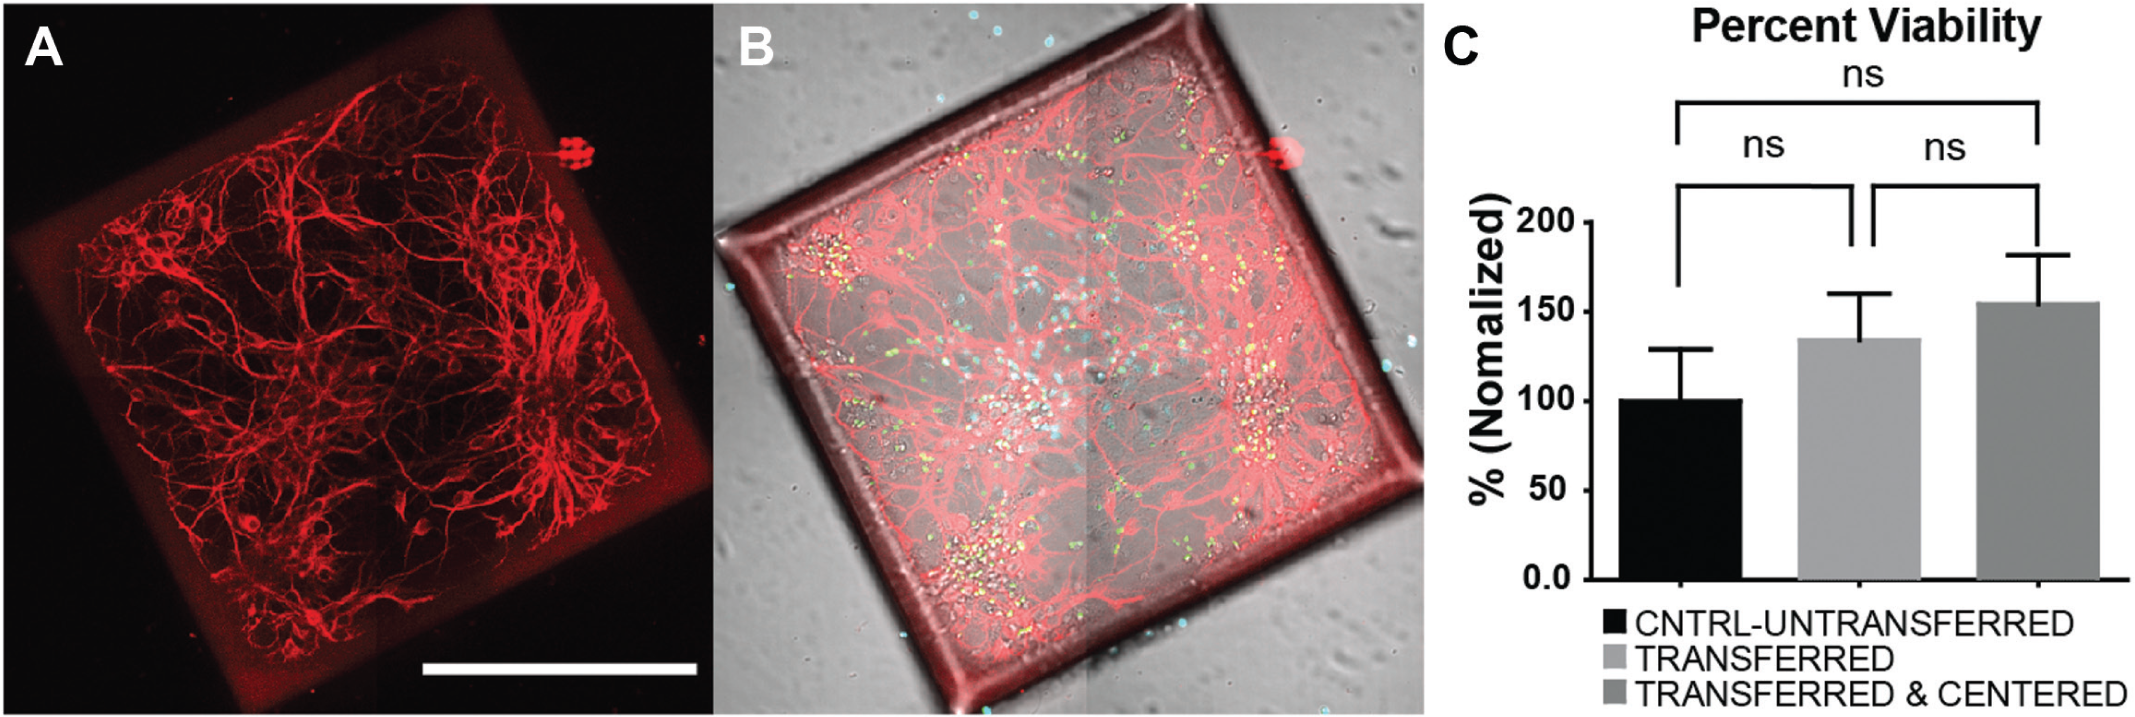
Cell viability was not affected by the transfer and centering process. (
Discussion
Although other magnetic plates exist commercially, mostly used for PCR assays, these plates are usually designed for 96-well microtiter plates and operate by pulling magnetic beads to the side of the wells. To the authors’ knowledge, the magnet array plate described herein is the only one designed for HTS in 384-well microtiter plates and is unique in that it centers microraft culture platforms, which offer the opportunity to scale up screening for neurological diseases.
With a well-to-well spacing half that of 96-well microtiter plates, fabricating a 384-magnet array plate can be difficult because of the risk of thermally induced cracking when drilling the magnet holes. For this reason, we wanted to use a hard plastic with a low glass transition temperature to comply with the heat produced during machining. LEXAN is form of polycarbonate that has a relatively low glass transition temperature and an extremely low thermal expansion coefficient, which allows it to be machined relatively easily without cracking.
Another factor in the fabrication of the plate was imaging. Importantly, we found that after the magnet array plate centers the microrafts, they remain in place after removing the magnet array plate and also while subjected to mild perturbations. Thus, it is unnecessary for the magnet array plate to be in place during imaging. However, an additional reason why LEXAN was chosen was its semitranslucency. This characteristic is beneficial for situations in which microrafts must be centered and secured while simultaneously performing tasks and imaging stereoscopically.
In creating the magnet array plate, one of the unique design features is its ability to fit within commercial fluid-handling machines, which allows it to secure the microrafts during fluid processes while preserving their centered position for imaging. In honing this design, we conducted a thorough analysis and concluded that it was better to use magnets similar in diameter to that of the microtiter well to achieve the best centering results. Smaller magnets would trap the microrafts at the magnet edge, where the field in the radial direction peaks, and prevent centering. Our design decision was confirmed by our empirical results, which not only showed a centering efficiency far beyond that of a flat magnet plate but also proved that it is preferable to have the magnet array plate positioned under the microtiter plate prior to loading the microrafts. This conclusion concurred with our analysis that microrafts loaded with a magnetic field already in place aligned themselves with the axial field, and they were drawn toward the center where this field peaks. However, when loaded prior to placement of the magnetic field, the settled microraft at the bottom of the well must rely on a weak radial field to be centered. Although this radial field is weaker, we found that centering occurred after microrafts randomly settled within the microtiter plate well, as shown in Test 2. This result is important in the event that microrafts become dislodged from their centered position, although our calculations show it would take a significant amount of acceleration for dislodging to occur.
Finally, viability experiments further validated the effectiveness of the magnet array plate, proving that neither transporting, nor transporting and centering create adverse effects on cell viability. These experiments concluded the overall success of this tool as a device to center paramagnetic microraft culture platforms for automated imaging, opening the opportunity for these microrafts to reduce costs, preserve animal life, increase throughput, and make cell-based screens of neurological disorders more accessible.
Footnotes
Acknowledgements
The authors thank Tharkika Nagendran for the neuronal cultures and Matthew Disalvo and Mark Niedringhaus for their contributions.
Author Contributions
KG designed and performed experiments and wrote the manuscript. YW designed experiments. NLA designed experiments. AMT designed experiments and wrote the manuscript.
Declaration of Conflicting Interests
The authors declared the following potential conflicts of interest with respect to the research, authorship, and/or publication of this article: NLA and YW are inventors (Patent No. 20130066031) and have financial interest in Cell Microsystems, Inc. AMT has financial interest in Xona Microfluidics, LLC. KG declares no competing financial interests.
Funding
The authors disclosed receipt of the following financial support for the research, authorship, and/or publication of this article: AMT is an Alfred P. Sloan Research Fellow. AMT acknowledges support from the US National Institutes of Health (NIH; R41MH097377). NLA acknowledges NIH support (R01EY024556). The content is solely the responsibility of the authors and does not necessarily represent the official views of the NIH.