
Abstract
The generation of therapeutic antibodies with extremely high affinities down to the low picomolar range is today feasible with state-of-the art recombinant technologies. However, reliable and efficient identification of lead candidates with the desired affinity from a pool of thousands of antibody clones remains a challenge. Here, we describe a high-throughput procedure that allows reliable affinity screening of unpurified immunoglobulin G or antibody fragments. The method is based on the principle of solution equilibrium titration (SET) using highly sensitive electrochemiluminescence as a readout system. Because the binding partners are not labeled, the resulting KD represents a sound approximation of the real affinity. For screening, diluted bacterial lysates or cell culture supernatants are equilibrated with four different concentrations of a soluble target molecule, and unbound antibodies are subsequently quantified on 384-well Meso Scale Discovery (MSD) plates coated with the respective antigen. For determination of KD values from the resulting titration curves, fit models deduced from the law of mass action for 1:1 and 2:1 binding modes are applied to assess hundreds of interactions simultaneously. The accuracy of the method is demonstrated by comparing results from different screening campaigns from affinity optimization projects with results from detailed affinity characterization.
Keywords
Introduction
Antibody generation using in vitro selection technologies often encompasses an affinity maturation step to optimize the affinity and cross-reactivity profile. The combination of phage display technology and sophisticated affinity optimization strategies is routinely used to generate therapeutic antibody candidates with the desired binding properties.1–3 Due to the typically large number of antibodies generated in such maturation campaigns, exhaustive affinity characterization with purified material is hardly practicable. For this reason, the ability to reliably estimate affinities with unpurified samples is a prerequisite for efficient screening. The use of high-throughput affinity-screening processes enables the reduction of overall project costs and duration by avoiding time-consuming purification steps and enabling the initial characterization of thousands of antibody candidates within a short time. Essential features of such an affinity-screening tool are (1) a reliable identification of affinity-improved candidates; (2) a reasonable equilibrium dissociation constant (KD) estimation of the respective clones; (3) compatibility with crude production matrices, such as bacterial extracts or cell culture supernatants; and (4) high-throughput processing (e.g., by automation of all sample-handling steps). Although state-of-the-art technologies, like surface plasmon resonance (SPR; e.g., Biacore) and bio-layer interferometry (BLI; e.g., Octet), partially fulfill these criteria,4,5 discrimination of affinities in the picomolar (pM) range in reasonable throughput remains a challenge.
Here, we describe a high-throughput method for affinity estimation of antibodies in crude sample matrices by electrochemiluminescence (ECL)-based solution equilibrium titration (SET) screening. This method is based on SET as originally described by Haenel and coworkers in 2005, 6 and it has been applied by different groups since then.7,8 To further increase the throughput, we transferred the former bead-based approach to the plate-based Meso Scale Discovery (MSD; Meso Scale Diagnostics, Rockville, MD) platform, which shares the same ECL detection principle. This MSD-based method for affinity characterization in solution has been performed robustly for many years in our laboratory and was also successfully applied by others.2,9–12 In general, a good correlation of SET KD determinations with KD determined by other platforms, such as Biacore (SPR), 13 Octet (BLI), or kinetic exclusion assay 14 (KinExA), was observed.
The MSD–SET assay is generally performed as follows: In several wells of an assay plate, a constant concentration of antibody is incubated with decreasing concentrations of antigen in solution. After the equilibrium of the antibody–antigen interaction is reached, the portion of free antibody is quantified: In a second assay step, the equilibrated samples are briefly incubated on an antigen-coated MSD plate, allowing binding of free antibody to the coated antigen and subsequent detection with an ECL-labeled secondary antibody. For data evaluation, it is noted that the ECL intensity is directly proportional to the concentration of free antibody. From the resulting titration data, the equilibrium dissociation constant (KD) can be determined by a customized fit model (see Materials and Methods), deduced from the law of mass action, taking the applied antibody and antigen concentrations into consideration.
In this article, the adaptation of the above-depicted SET assay to a high-throughput screening method is described. Furthermore, the applicability of SET screening in various projects with diverse target classes was investigated, and the correlation with KD determinations using purified samples is shown.
Materials and Methods
Materials
Selected antibodies were obtained from the Human Combinatorial Antibody Library (HuCAL GOLD or HuCAL PLATINUM) by phage display technology2,23 via selection on the respective targets. The selection output was cloned into an expression vector for expression, and, if necessary, either Fab fragments or full-length immunoglobulin G (IgG) was purified.
HuCAL-derived antibody Fab fragments were produced and purified as described previously. 2 Fab fragments with a His6-tag were produced in Escherichia coli; cells were lysed by the addition of lysozyme and then processed without further clarification. To receive purified Fab fragments, bacterial lysates were purified via immobilized metal affinity chromatography (IMAC), and the buffer was exchanged to phosphate buffered saline (PBS).
HuCAL-derived antibodies were produced and purified as previously described. 24 In short, IgG1 was transiently produced by using the human cell line HKB11. 25 For screening, cell culture samples were subjected to centrifugation (10 min at 600×g) to remove cells, and supernatants were processed without further purification. Antibody purification was performed via Protein A, antibodies were eluted with glycine buffer at low pH, and the buffer was exchanged to PBS. Protein concentrations of purified Fab fragments or whole IgG were determined by ultraviolet spectrophotometry.
SET Screening Procedure
The SET screening experiments were carried out in 96- and 384-well polypropylene microtiter plates, and 96- and 384-well standard or streptavidin plates (MSD) for detection. DPBS (Dulbecco’s PBS, pH 7.4; Life Technologies, Carlsbad, CA) with 0.5% (w/v) bovine serum albumin (BSA; Sigma-Aldrich, St. Louis, MO) and 0.02% (v/v) Tween 20 (Merck, Darmstadt, Germany) was used as assay buffer (i.e., for diluting antibody- or Fab fragment–containing matrices and antigens). Goat antihuman F(ab)2 fragment (Dianova) was labeled with ECL-sulfo-tag N-hydroxysuccinimide (NHS)-ester from MSD according to the manufacturer’s protocol, and it was used as detection antibody for either Fab fragments or IgGs. Read buffer T with surfactant (MSD) was used for the detection of the ECL signal.
The SET screening was performed using 96- and 384-well microtiter plates (MTPs) for the processing steps. One source plate (a 96-well MTP) contained 88 samples, that is, antibodies or Fab fragments in their corresponding expression matrix, which were analyzed in parallel. These lysates were diluted in assay buffer and split onto two MTPs (1 96-well and 1 384-well) representing the different parts of the screening assay: One plate was used for the titration with the specific antigen (the SET plate), and the second plate was used to determine antibody concentrations in a crude sample matrix (the quantification plate) ( Fig. 1 ). Because several source plates needed to be processed in screening campaigns, an automated liquid-handling system was used for preparing the different dilutions of antibody containing sample matrix required for SET experiments and quantification (PlateMate Plus; Thermo Scientific, Carlsbad, CA). In the following, the procedure of a SET screening with unpurified His6-tag Fab fragments is described. For the analysis of whole IgG, the procedures had to be adjusted accordingly.
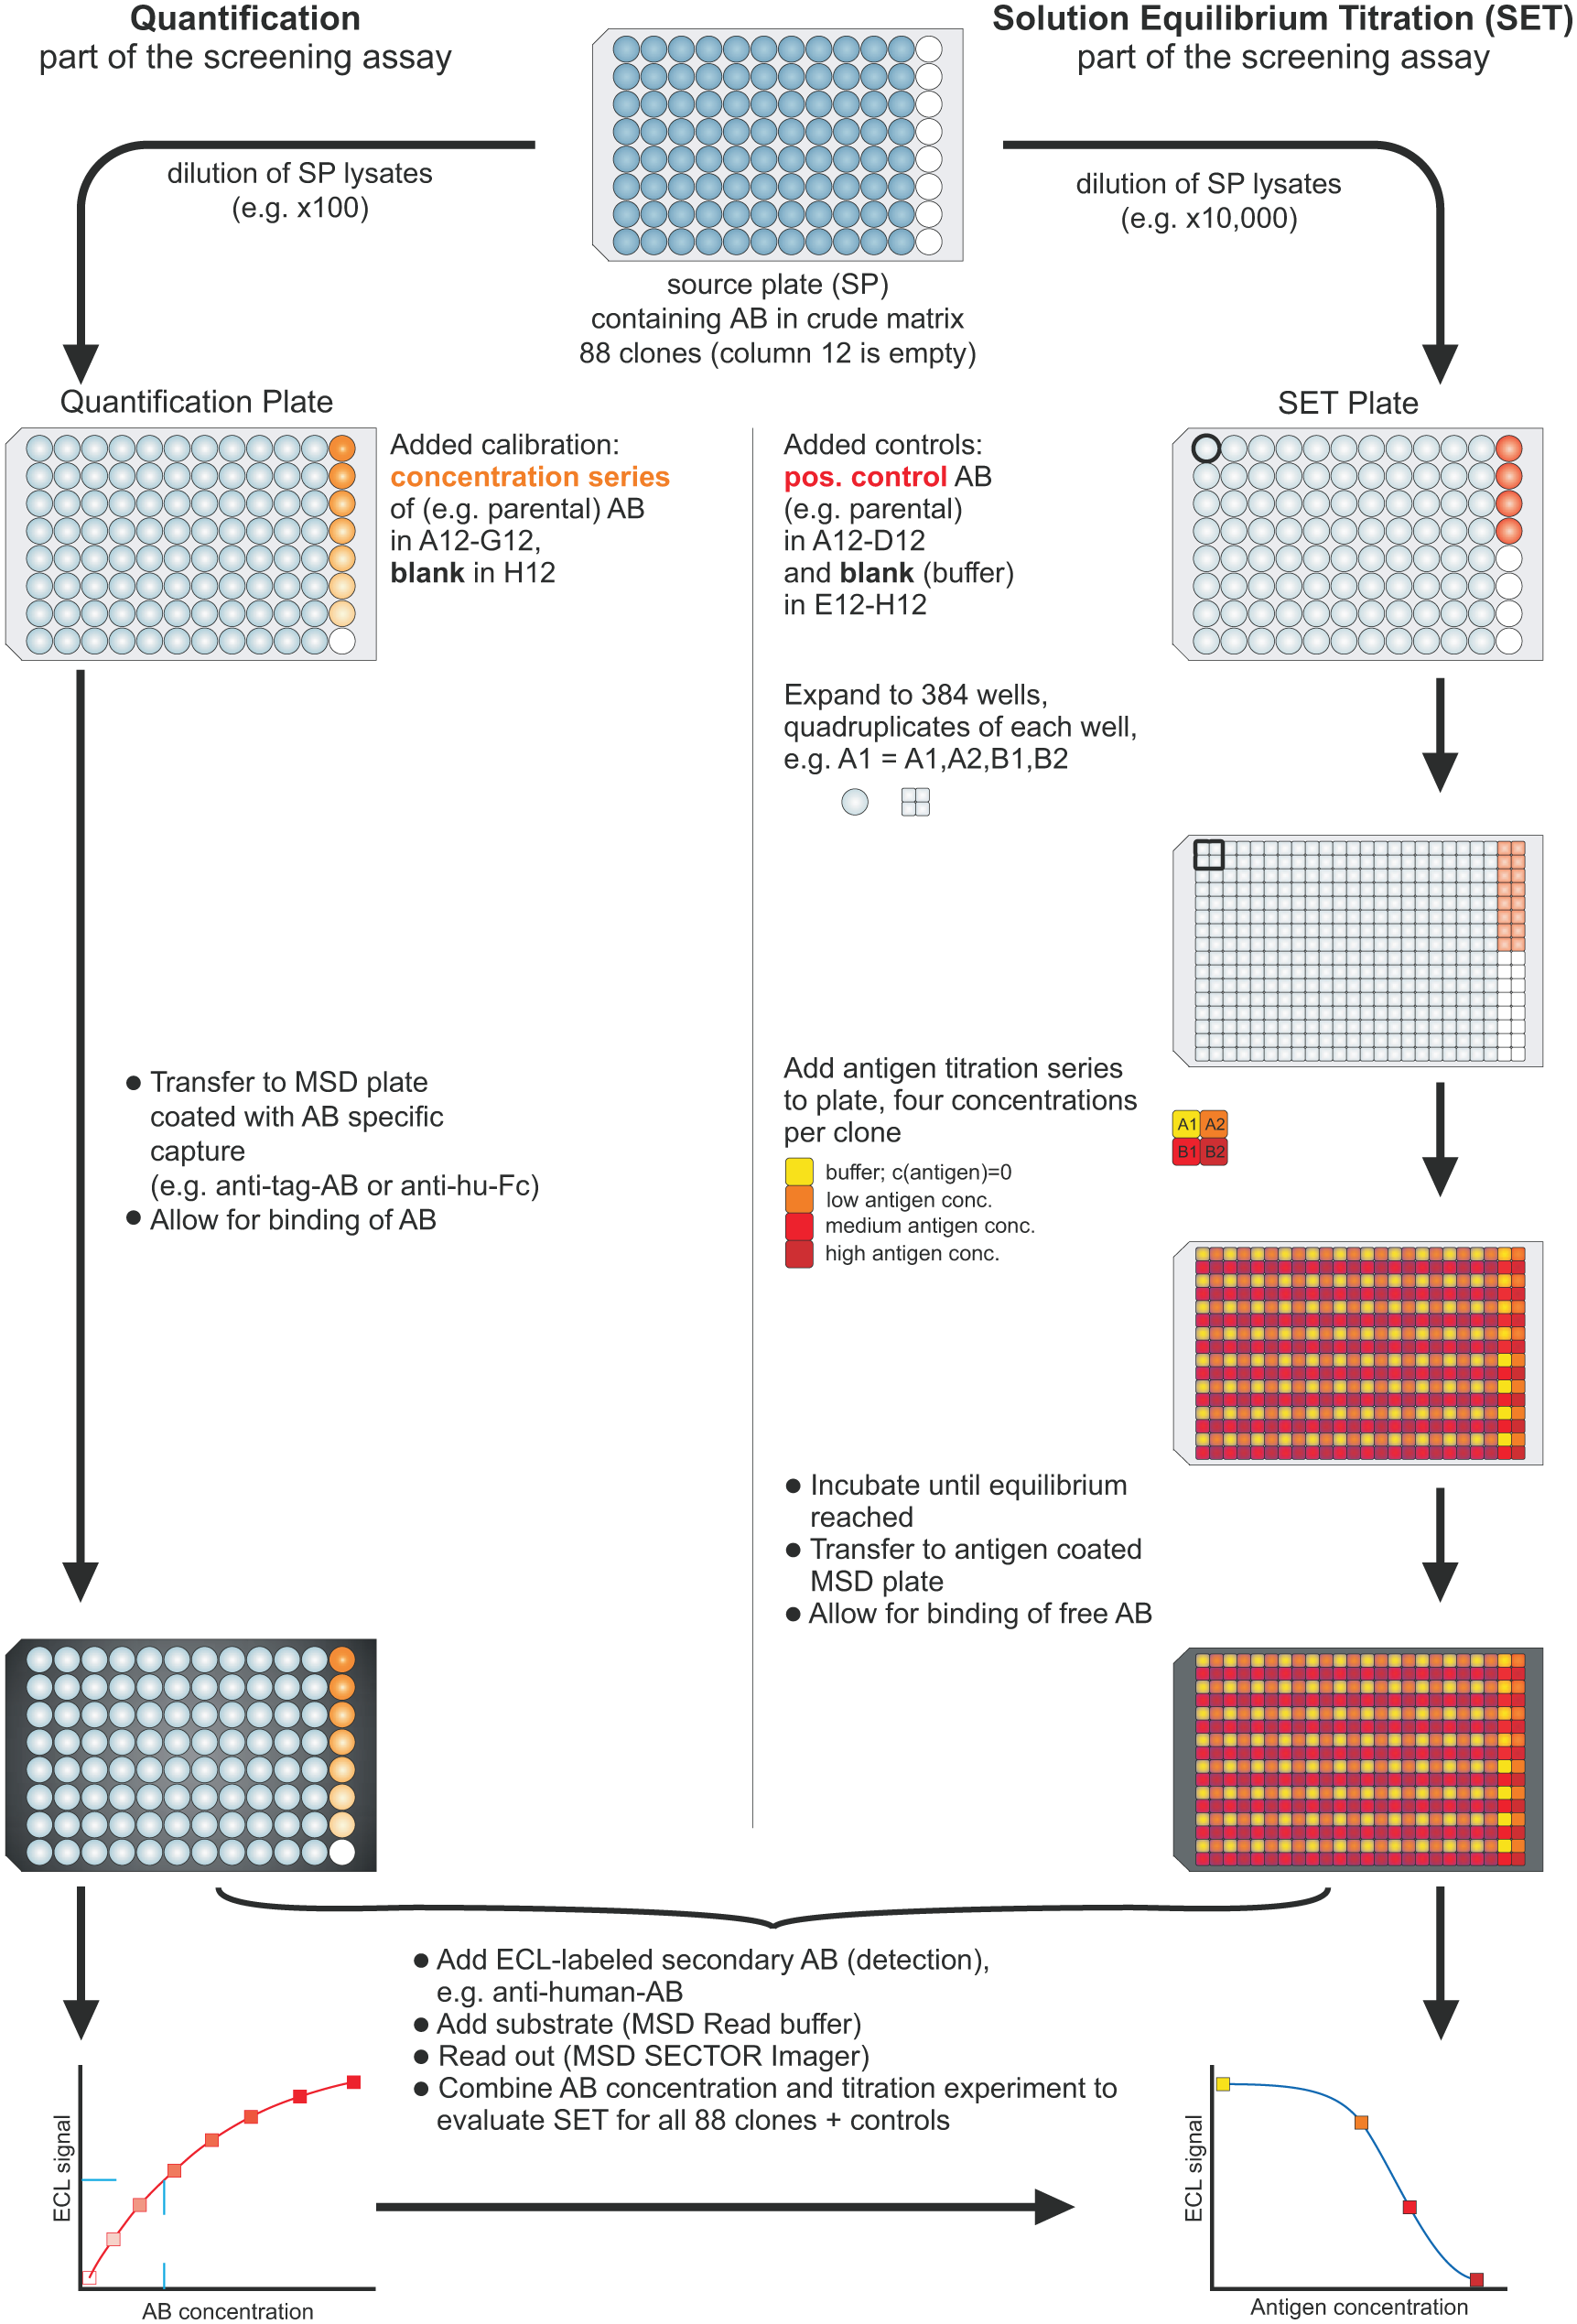
Solution equilibrium titration (SET) screening flowchart. The flowchart depicts the SET screening procedure for 88 clones from one source plate (SP). For each clone, the concentration of Fab [or immunoglobulin G (IgG)] in the bacterial lysate (or cell culture supernatant) is determined using a calibration curve (on the left: quantification plate). Via SET (on the right: SET plate), for each clone the amount of free antibody (AB) is determined at four different antigen concentrations at equilibrium. For details, refer to Materials and Methods.
SET Plate
For the processing of the SET plate, the dilution of the antibody-containing solutions was adjusted so that a minimal binding signal of 1000 ECL units on the antigen-coated MSD plate was achieved. A minimum signal-to-background ratio of 5–10 was defined as reasonable for the later titration. Four replicates of the diluted Fab samples (30 µl each) were transferred onto a 384-well microtiter plate in such a way that, for example, a clone in position A1 of the 96-well source plate was replicated on positions A1, A2, B1, and B2 of the 384-well MTP (PlateMate Plus; Thermo Scientific). This plate was further used for preparing the solution equilibrium: 30 µl of three different antigen concentrations (and blank) were added to the four replicates of each clone, so that each sample lysate was mixed with a high, a medium, and a low antigen concentration and with assay buffer only. As a rule of thumb, the highest antigen concentration (well B2) was aimed to be roughly 10–20-fold higher than the aspired KD, the medium concentration (well B1) in the range of the KD, and the lowest concentration (well A2) 5–10-fold lower than the aspired KD. If no information was available on the expected KD range, this could be easily tested with a short pre-experiment with a representative subset of the screened samples. The well containing only the diluted antibody was used to determine the Bmax value, that is, a signal of 100% free antibody (antigen concentration = 0; well A1).
A suitable assay positive control, such as a purified (parental) antibody spiked into diluted empty (i.e. antibody-free) matrix at a known concentration, was added to free wells of the SET plate, which was processed in parallel as an additional sample. Wells containing only assay buffer were added to assess background signals. To process several SET screening plates, a Tecan Freedom liquid-handling system (Tecan, Männedorf, Switzerland) was applied to add the antigen solutions. The antibodies and antigen in solution were incubated until binding equilibrium was sufficiently approximated [usually achieved after overnight incubation at room temperature (RT)].
In parallel, for each SET plate, a MSD 384-well detection plate was prepared by coating antigen (typically in the range of 0.1–1.0 µg/ml in PBS, 30 µl/well) and incubation at 4 °C overnight. The coating solution was discarded, and plates were blocked with 50 µl/well 3% (w/v) BSA in PBS for 1 h at RT, followed by three washing steps with 50 µl washing buffer [PBS-T: PBS with 0.05% (v/v) Tween 20]. In those cases in which biotinylated antigen and a streptavidin-coated MSD plate were used, the coating procedures were adapted according to the manufacturer’s protocol.
After equilibration, 30 µl of the sample solutions were transferred and incubated for 20–30 min onto an antigen-coated MSD plate to allow for binding of free antibody without significantly shifting the equilibrium. Subsequently, the solution was discarded, the plate was washed 3× with 50 µl PBS-T, and 30 µl/well detection antibody (ECL-labeled antihuman Fab, diluted 1:2000 in assay buffer) was added and incubated for 1 h. After discarding the solution and further washing steps, 35 µl/well 1× Read buffer T with surfactant was added. ECL signals were detected immediately using an MSD SECTOR Imager 6000 instrument (Meso Scale Discovery).
Quantification Plate
For the quantification of the applied Fab fragment concentration (the quantification plate), a 96-well MSD plate was coated for 2 h at RT with 100 µl/well anti-His antibody (Dianova; 0.1 µg/ml in PBS). After blocking with 100 µl 3% (w/v) BSA in PBS for 1 h at RT, the content of the diluted quantification plate prepared from the same source plate as the SET plate was transferred onto the MSD plate, as well as a serial dilution of known concentrations of a calibrator (e.g., a parental clone, purified). The dilution of the quantification plate was adjusted in such a way that signals were within the calibration range (0.5–30 nM). The samples were allowed to bind at RT overnight. After 3× washing with PBS-T, 60 µl/well detection antibody was added (ECL-labeled antihuman Fab, diluted 1:2000 in assay buffer) and incubated for 1 h. After washing, 150 µl/well 1× Read buffer T with surfactant was added. ECL signals were detected immediately using an MSD SECTOR Imager 6000 instrument.
For IgG samples, any quantification method compatible with cell culture supernatants and high throughput could be applied, such as quantification via Protein A or specific antihuman antibodies. Preferably, this was also realized in a plate-based format to enable parallel processing of plates, as described above. In principle, the same is true for the tagless Fab format, which could be quantified (e.g., via antihuman Fab-specific antibodies).
Data Evaluation
For data evaluation, the readout of the MSD instrument for both SET and quantification plates was imported into a customized Excel-based evaluation sheet (with IDBS XLfit 5.3.1 as plug-in software), which automatically plotted the 88 titration curves per source plate, and calculated for each sample the antibody concentration and the KD value, as well as statistical parameters (for more details, refer to Results). Depending on the valence of the antibody format, two different binding models were available that had to be applied for the analysis of titration curves: For a monovalent binding interaction (e.g., a Fab fragment and mono- or multimeric antigen), Equation 1 was applied 6 (modified according to Abraham et al. 26 ). For IgG and monomeric antigens, the bivalent model (Equation 2) was used (modified according to Piehler et al. 27 ). These models allow one to determine the dissociation constant (KD), taking into account the applied free antibody and antigen concentrations.
Equation 1 is a binding model for a 1:1 interaction:
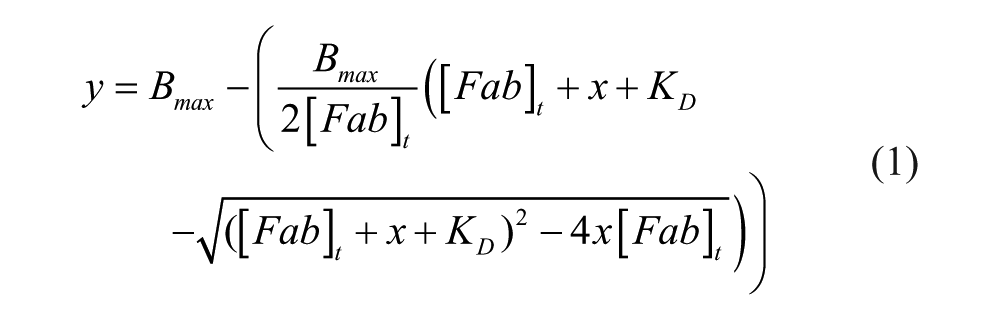
where [Fab]t: applied total Fab concentration; x: applied total soluble antigen concentration (binding sites); Bmax: maximal signal of Fab without antigen; and KD: equilibrium dissociation constant.
Equation 2 is a binding model for a 2:1 interaction:
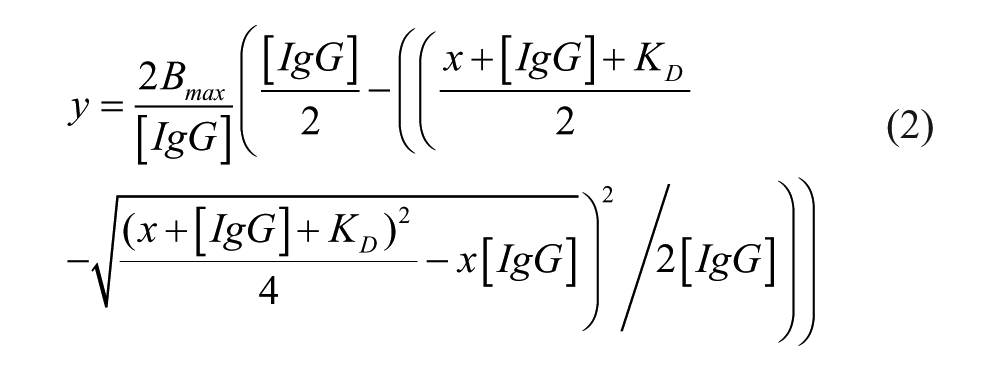
where [IgG]: applied total IgG concentration; x: applied total soluble antigen concentration (one binding site); Bmax: maximal signal of IgG without antigen; and KD: equilibrium dissociation constant.
Results
SET as an Affinity-Screening Platform
To make the MSD-based SET assay applicable for screening approaches, the number of data points per sample were reduced to a minimum, and the method was adapted to crude bacterial lysates and cell culture supernatants. For the SET screening method, only three concentrations of free antigen (high, medium, and low) and buffer without antigen (maximum signal) are used for titration. In parallel, the concentration of the antibody in the nonpurified matrix is quantified using an ECL-based immunoassay. As outlined in the flow chart ( Fig. 1 ), highly diluted bacterial lysates or cell culture supernatants provided in a 96-well source plate (SP) are replicated fourfold into a 384-well plate. These replicates are mixed with the three different antigen concentrations or buffer and incubated overnight at RT (SET plate). The equilibrated mixtures are then transferred to a 384-well MSD plate coated with antigen and incubated for a short period of time. After washing, the complex of antibody and immobilized antigen is detected with an ECL-labeled detection antibody. In parallel, a replicate of the 96-well source plate is transferred to a 96-well MSD plate coated with an antitag antibody for quantification (quantification plate). Both plates are read out with the MSD instrument. For details of the procedure and adjustment of the screening assay to the desired affinity range, refer to the Materials and Methods section.
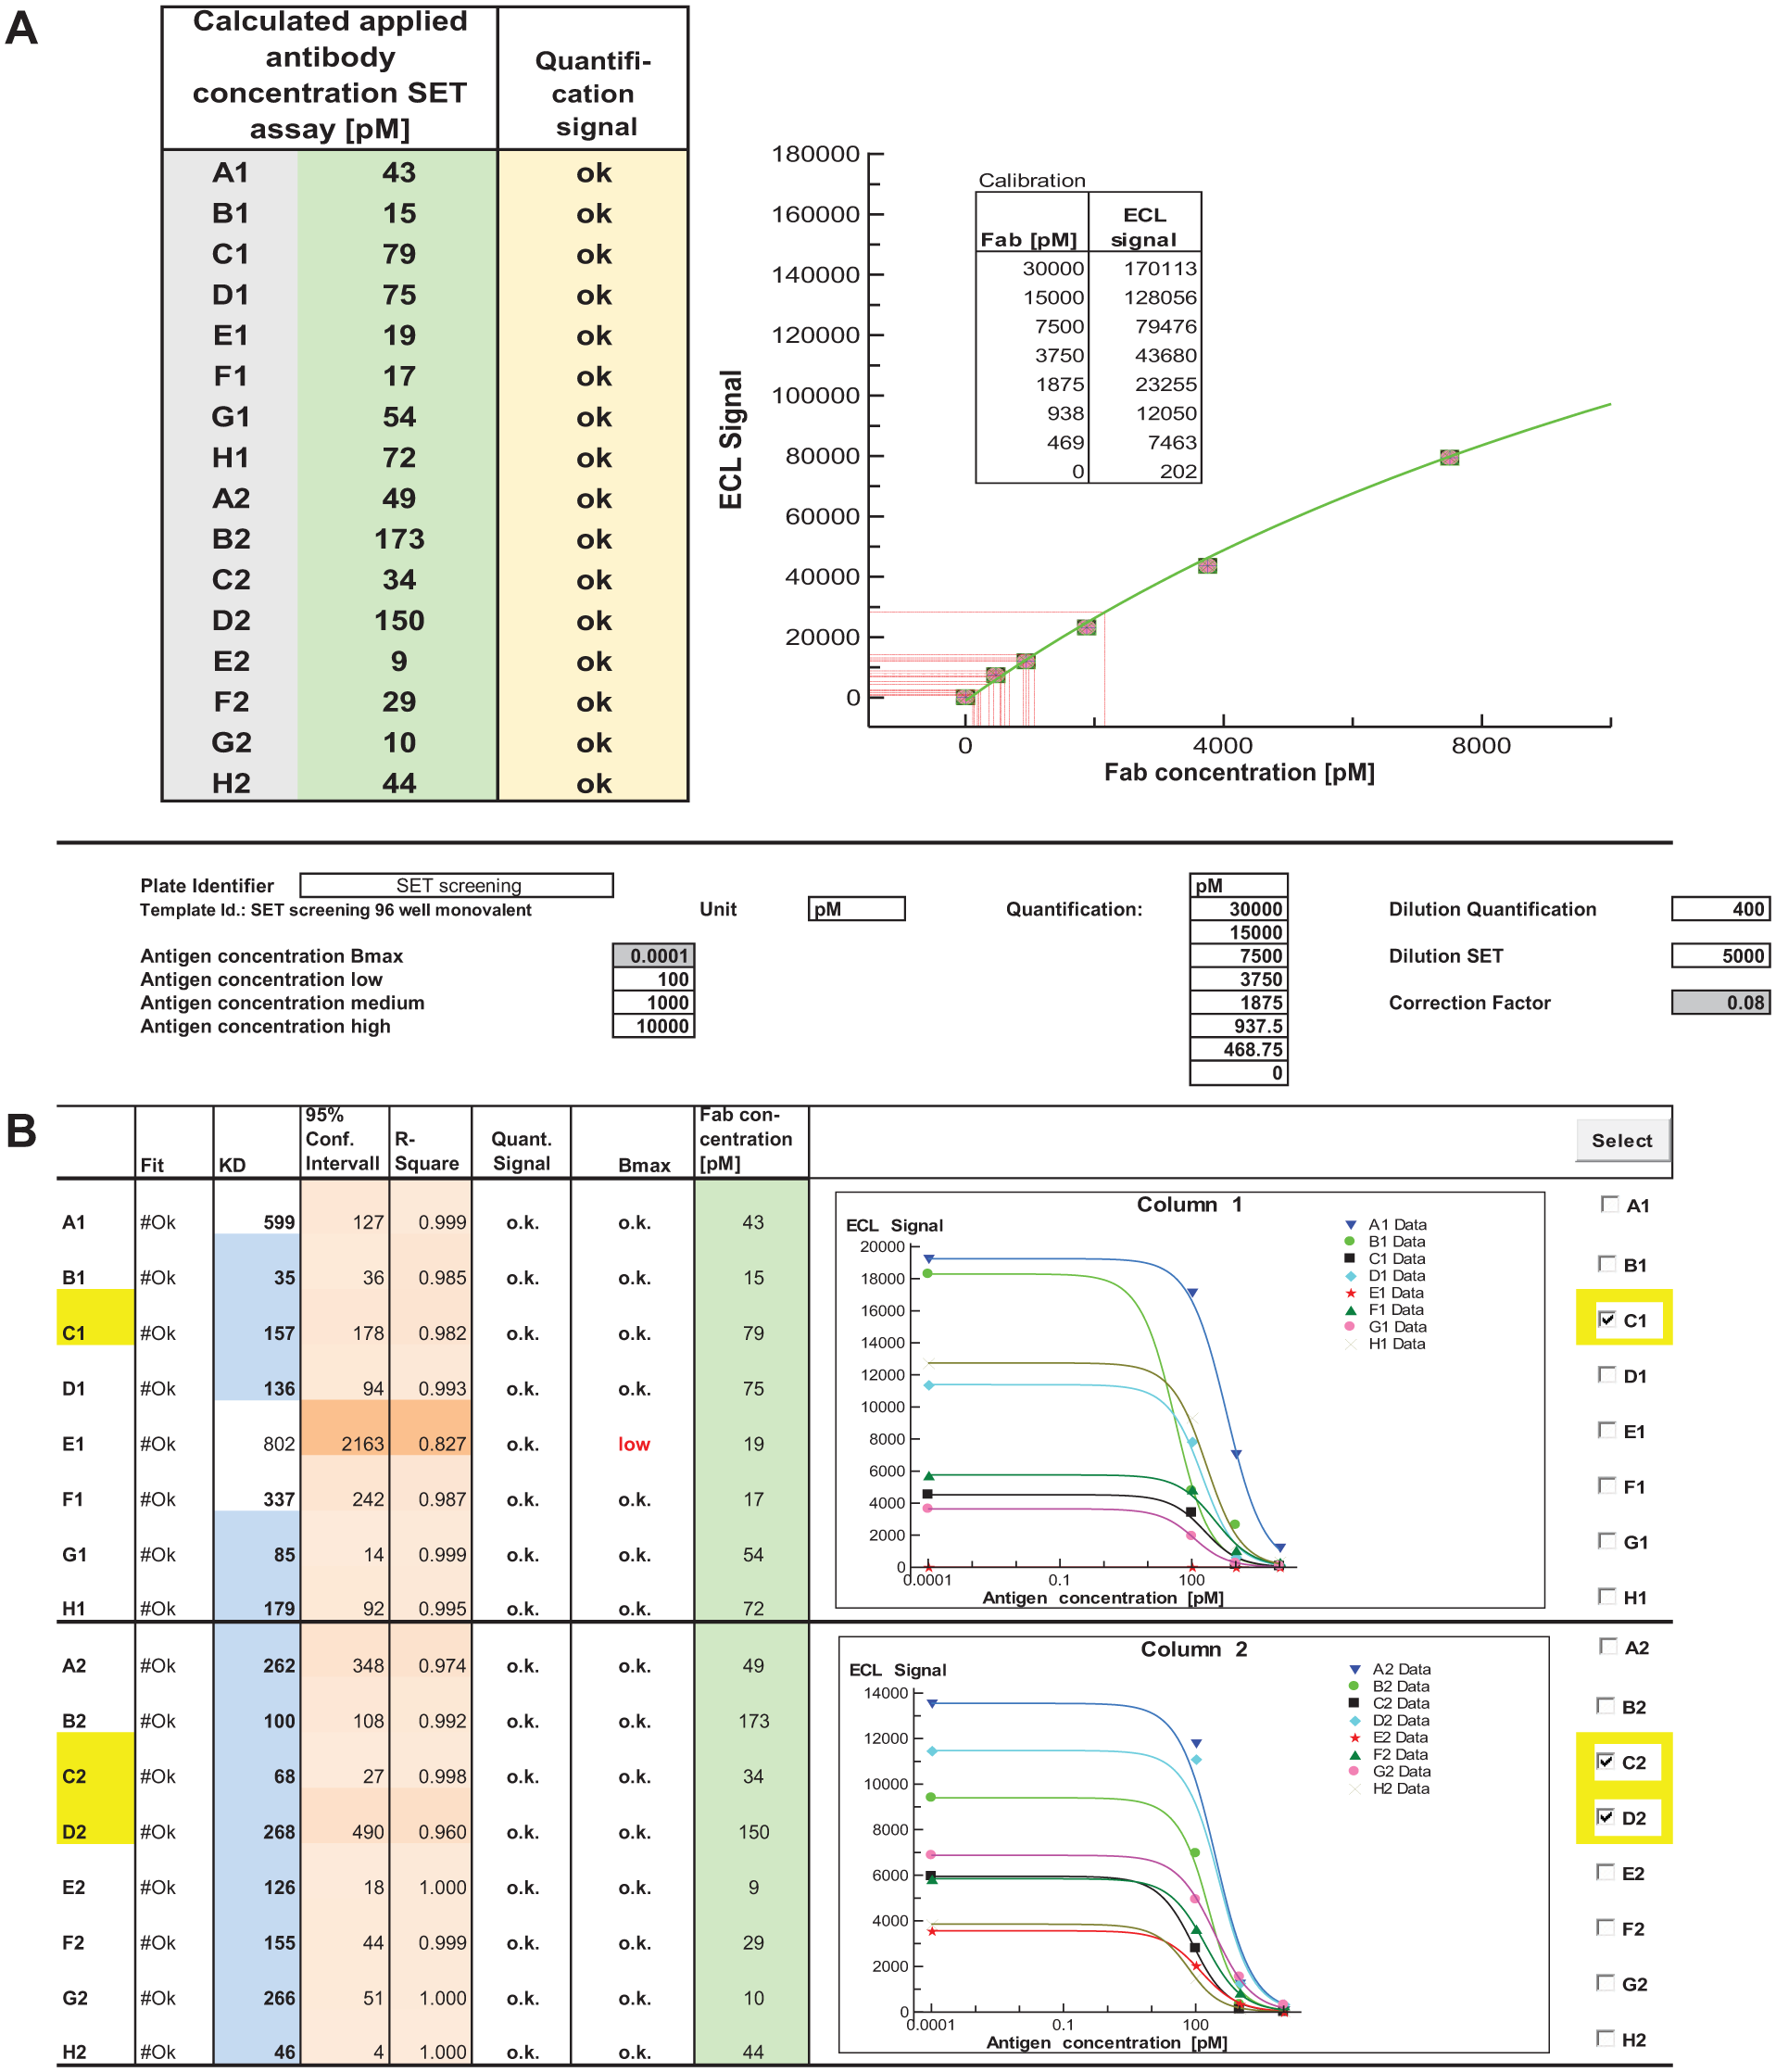
For data assessment, an Excel-based evaluation sheet with customized fit models is realized by using XLfit (IDBS) plug-in functionality. The ECL readout of both plates is imported to the evaluation sheet, and plots of all 88 titration curves per 384-well SET screening plate are displayed, comprising the data fit and the calculated KD values. In addition, for assessment of data quality, the 95% confidence intervals and correlation coefficients (R²) of the fits are displayed, and it is indicated if the maximal signals are sufficiently above background for reliable data evaluation ( Fig. 2B ).
(
Results of SET Screening Experiments
As a first example for SET screening, the results of an affinity-screening campaign are presented, which were generated following diversification and stringent phage display selection of a large pool of parental antibodies (rapid maturation, or “RapMAT,” technology; see Prassler et al. 15 ).
The screening was carried out with E. coli lysates containing His6-tagged Fab molecules, as described in Figure 1 . Exemplary results of the Fab quantification, including calibration and display of interpolated analyte concentrations, are shown in Figure 2A . The resulting concentration information was directly included for fitting the SET data (i.e., for each clone, four titration data points and the interpolated antibody concentration were used to calculate the KD values; Fig. 2B ).
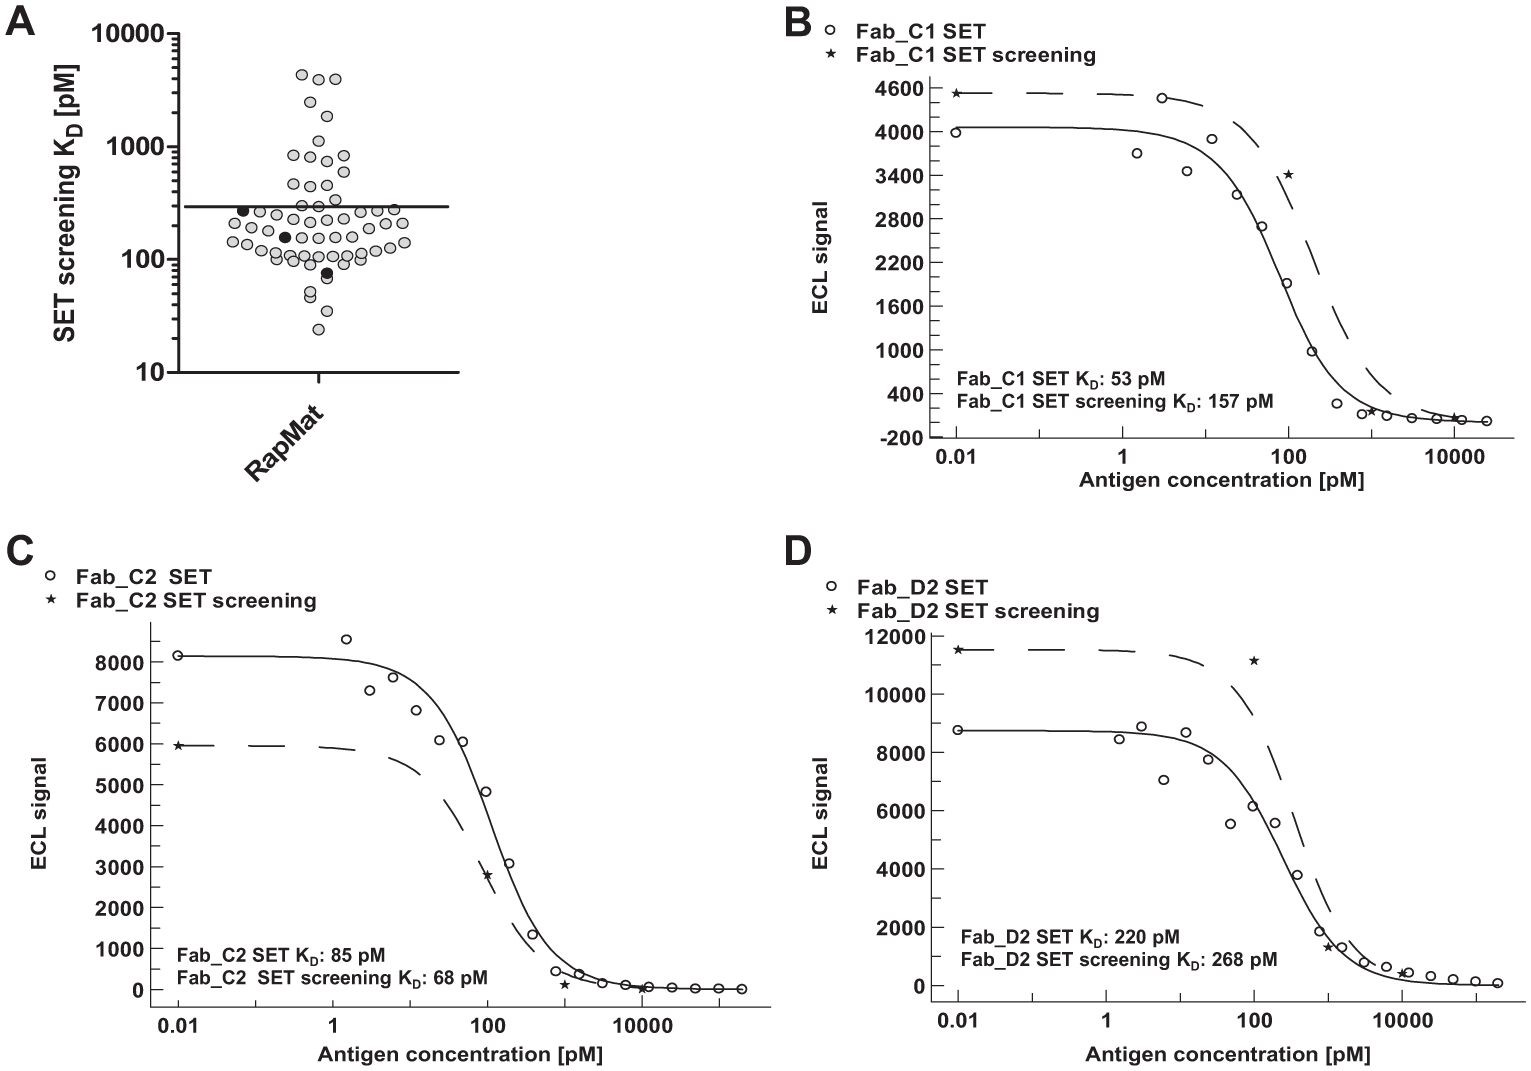
Figure 3A summarizes the results of the RapMAT SET screening. Only results were plotted in which titration curves fulfilled predefined data quality criteria (e.g., sufficient signal intensity). From the resulting KD range of 20–4000 pM, candidates with affinities lower than a threshold of 300 pM were selected as potential hits and further characterized after sequencing and purification. The black-filled circles represent the highlighted candidates (potential hits) from Figure 2B .
(
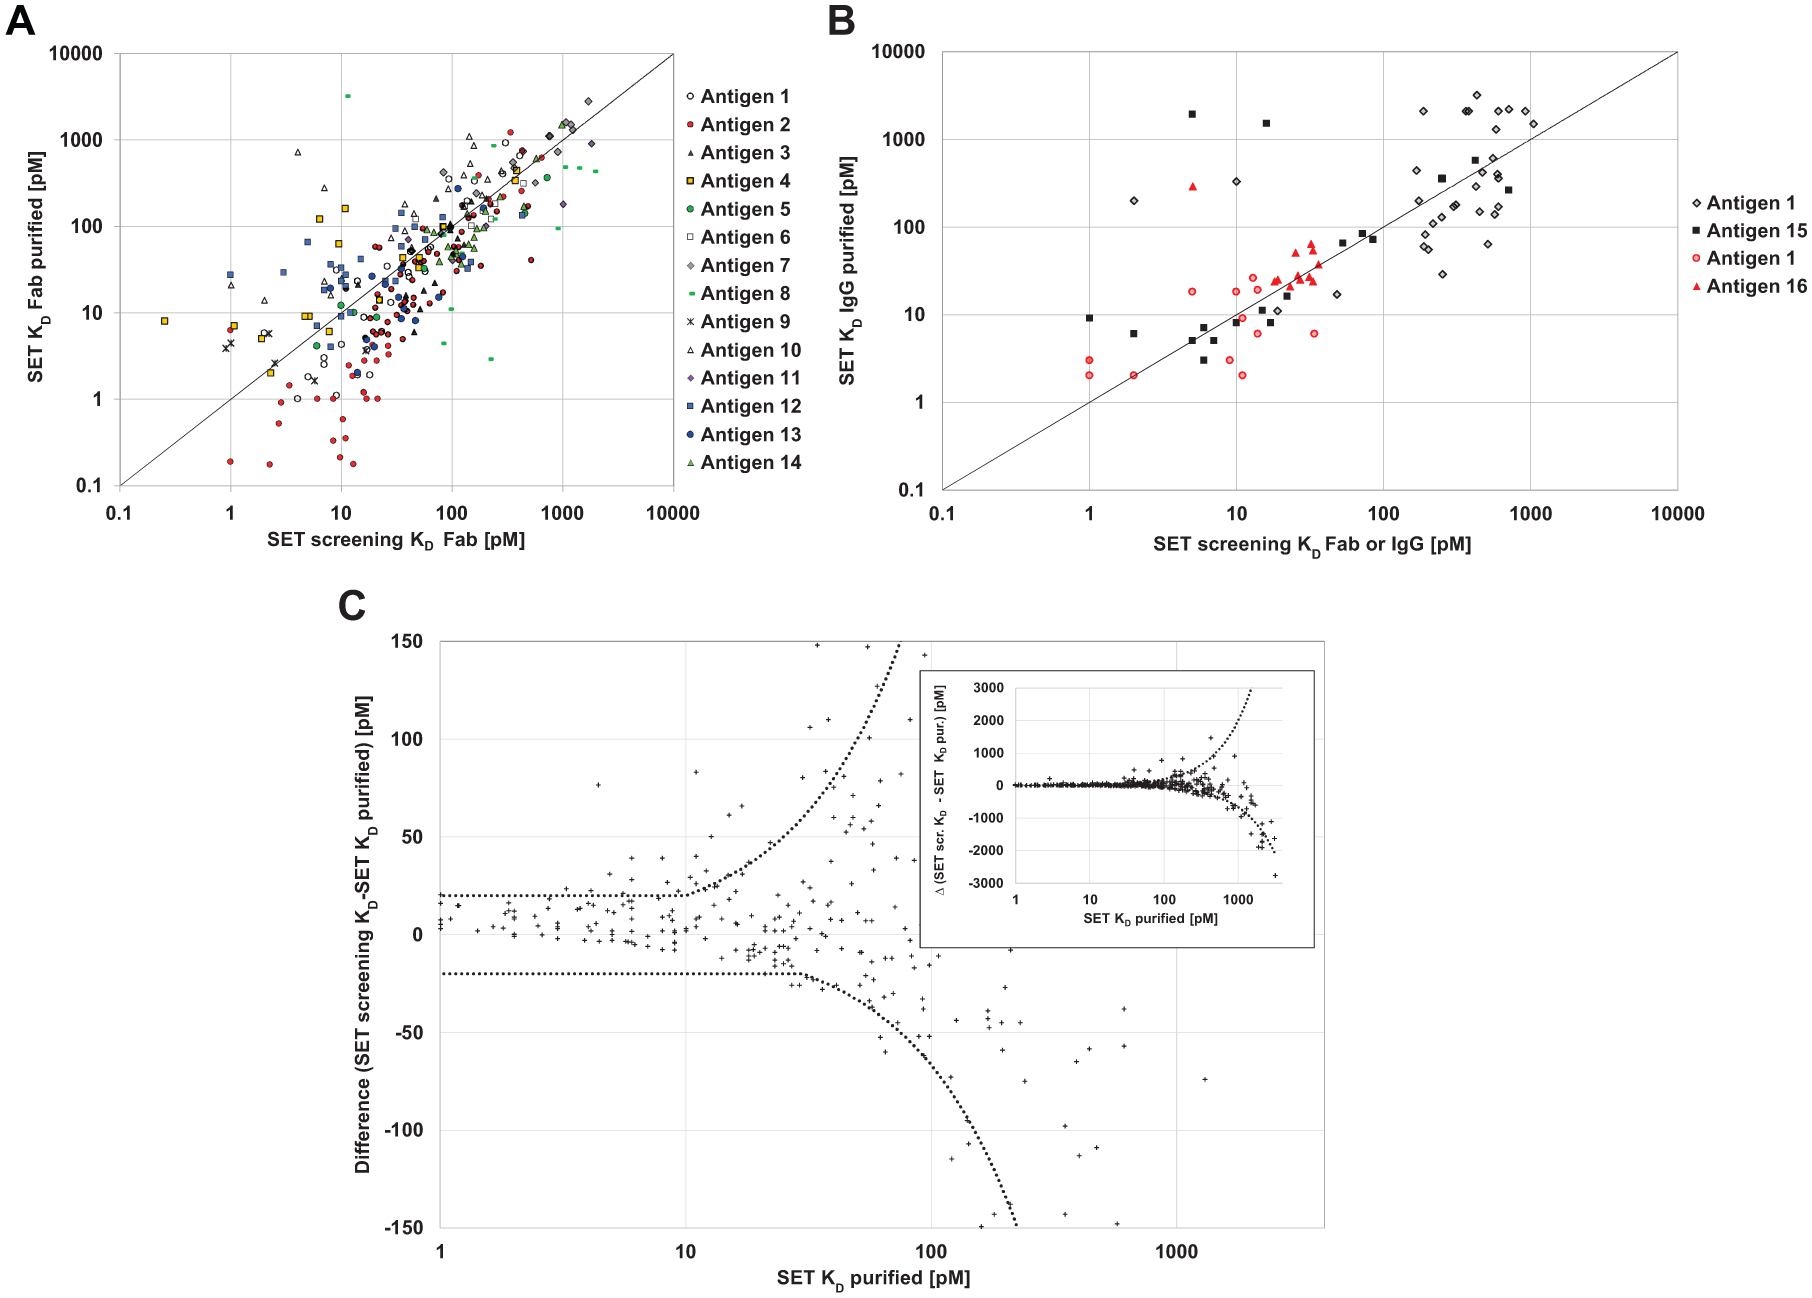
These three exemplary candidates (clones C1, C2, and D2; Fig. 2B ) were selected to assess the reliability of SET screening (i.e., four-point titration) compared to detailed SET affinity determination (SET characterization) with purified material. The SET characterization was done with 24 data points. Good agreement was observed between the KD values obtained from SET characterization with purified Fab and SET screening in crude bacterial lysates, as summarized in Table 1 (upper panel). The deviation factor between affinities estimated by SET screening and the actual KD determined by detailed SET characterization was between 1.2 and 3.0, which indicates reasonable accuracy of SET screening. Moreover, the predefined affinity threshold of <300 pM was confirmed in all cases.
KD Values Obtained from SET Screening and Detailed SET Characterization.
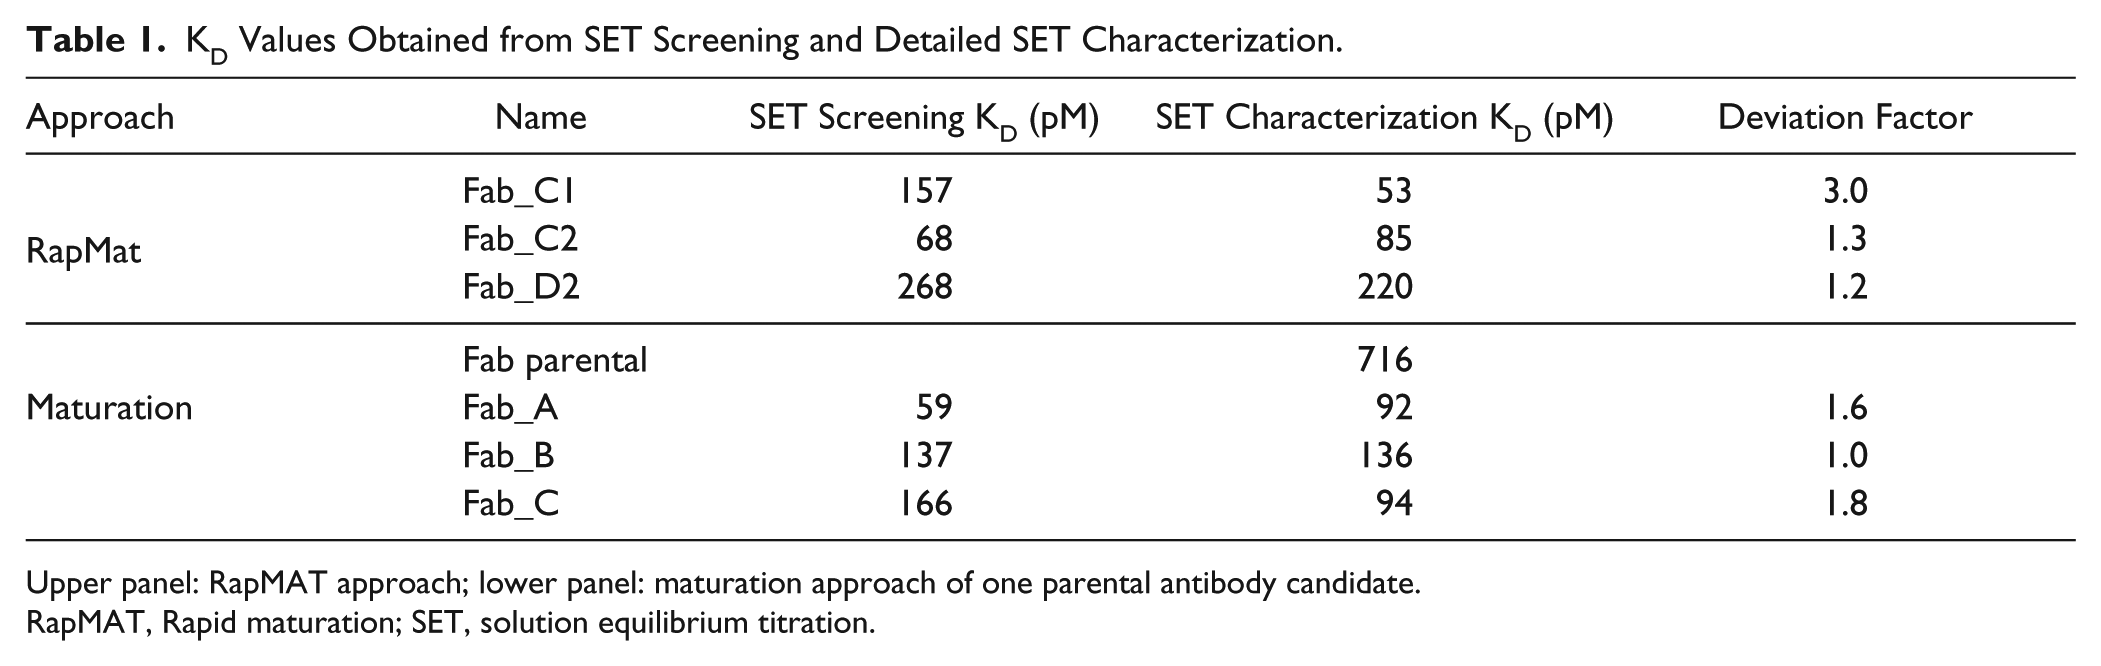
Upper panel: RapMAT approach; lower panel: maturation approach of one parental antibody candidate.
RapMAT, Rapid maturation; SET, solution equilibrium titration.
Figure 3B–D and Table 1 (upper panel) show the overlays and results of SET screening and detailed SET titration curves for the three selected hits. Due to the fact that varying antibody concentrations were used during screening and in the detailed SET characterization performed with purified Fab, the maximum signals and the inflection points of the curves were slightly different, even though the applied fit model appears to allow a reliable analysis of the antibody affinity in the screening setting (i.e., with four data points and only roughly estimated antibody concentrations).
As a second example, we chose a screening campaign following classical affinity maturation of a fully characterized antibody lead candidate (i.e., parental antibody). The screening was again performed with His6-tagged Fab fragments in E. coli lysates. In the present maturation example, different washing conditions or alternating presentation modes of the antigen were applied in three different panning strategies (named A, B, and C, with A being the most stringent one). Figure 4A shows the estimated affinities derived from the different panning conditions. The screening results indicate that all panning strategies yielded candidates with improved affinities compared to their common parental antibody. Beyond this, the most stringent panning strategy (A) appeared to be most successful with regard to the number of affinity-improved clones.
(
For further characterization, we selected potential hits lower than a threshold of 200 pM (marked in black). Again, good agreement even with a deviation factor lower than 2 was observed (Table 1, lower panel). Figure 4 B–D shows the overlays of SET screening and the respective detailed SET characterization of the selected clones ( Fig. 4A , black symbols). For comparison, the titration curve of the parental clone is plotted as well. The detailed SET characterization confirmed the affinity improvement by a factor of approximately seven of the selected hits. This finding demonstrates that the achieved affinity improvements can be reliably predicted already during screening. Again, for all three potential hits, the predefined affinity threshold lower than 200 pM was clearly met.
General Applicability of SET Screening
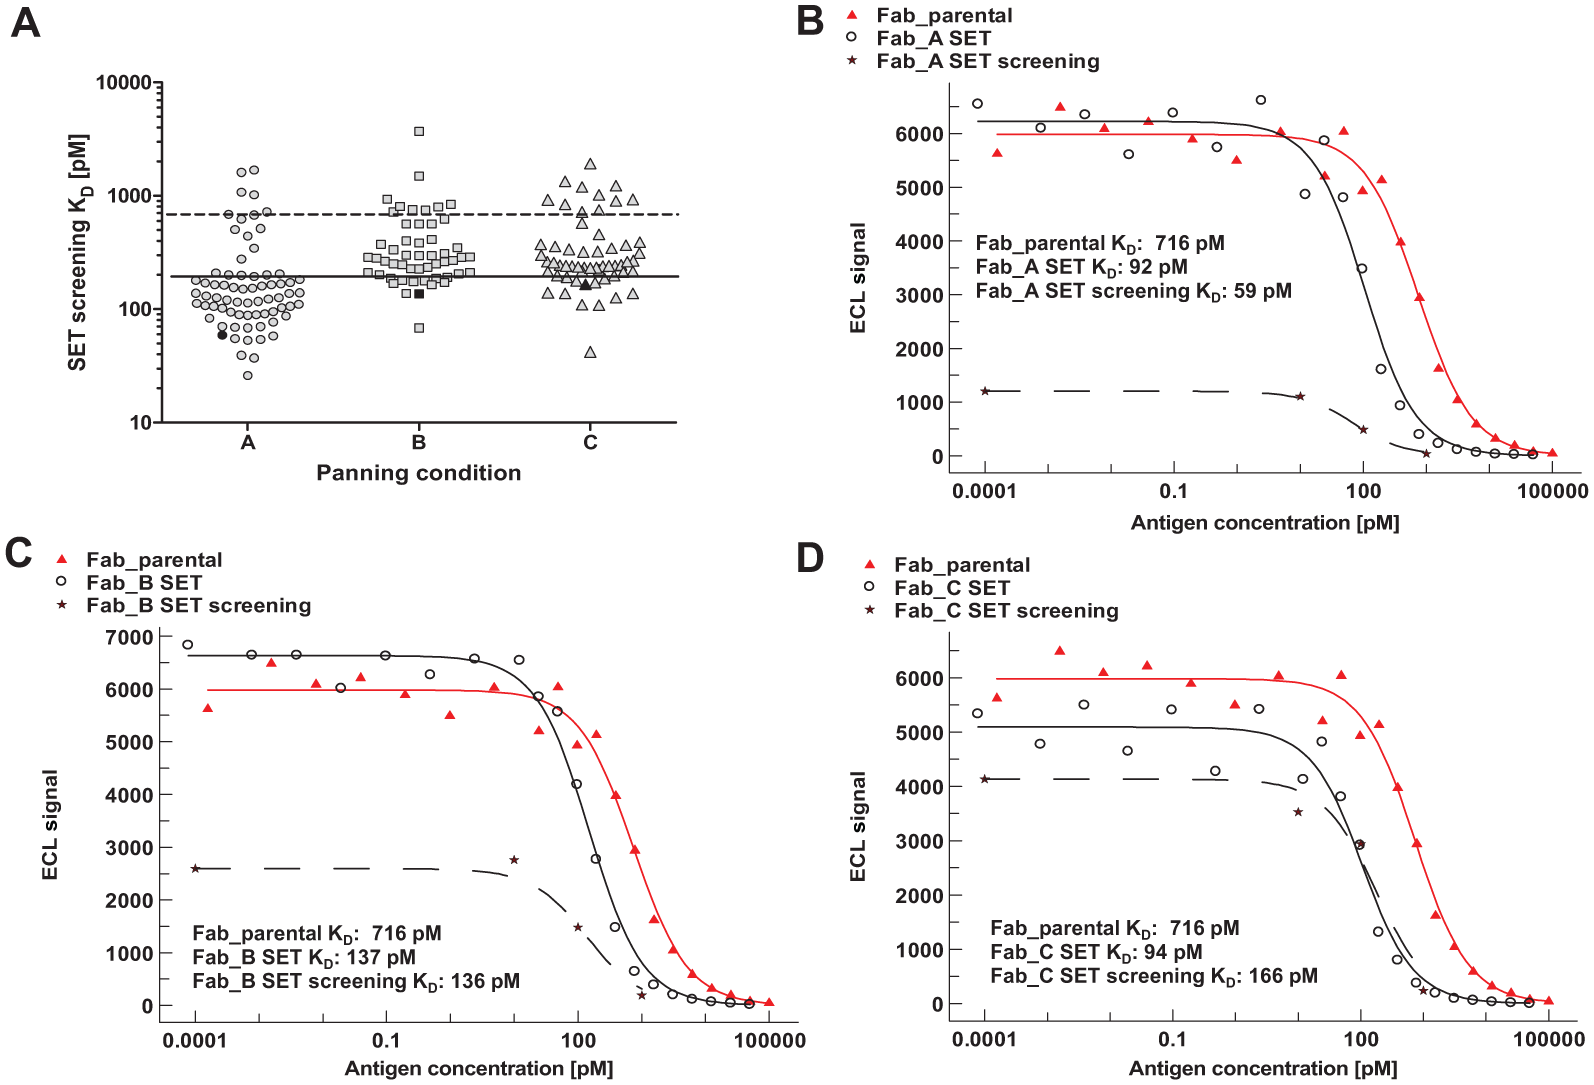
To demonstrate the general applicability of SET screening for different target classes (e.g., soluble antigens, cell surface receptors, and different molar masses), we analyzed the correlation of the affinity values generated during SET screening with the corresponding SET KD characterization values from several screening campaigns with Fab fragments ( Fig. 5A ). As can be seen, there is good overall correlation for the different target molecules spanning a pM-to-nanomolar (nM) affinity range.
(
Depending on the project strategy, a switch from Fab to the bivalent IgG may be done immediately after phage display selection or after affinity maturation and in-depth characterization of the monovalent Fab format. To demonstrate the general applicability of SET screening for IgG, we compared SET screening performed with either cell culture supernatants containing IgG, or bacterial lysates containing Fab fragments with SET determination of the corresponding purified IgGs using monomeric antigens ( Fig. 5B ). These data show that reliable affinity screening is also possible in the IgG format with the more complex 2:1 interaction fit model.
In the following, the predictive power of the SET screening approach is further illustrated. To this end, we transformed SET screening and corresponding characterization data by using a modified Bland–Altman plot16,17 ( Fig. 5C ). We used a logarithmic scale for better resolution of the high-affinity range, which is the usual target range for most screening campaigns. Thus, the best available approximation to the “true” affinity in solution (SET KD) is plotted versus the deviation of the screening estimate.
To exemplify which assay performance we consider appropriate for such a screening method, we included a cutoff line (dotted black) representing a deviation of the SET screening KD estimation from the “true” SET KD by a factor of 3, or an absolute value of 20 pM. According to these criteria, the following examples of KD estimations compared to “true” KD (in brackets) would be considered reasonably accurate: 100 pM (40 pM) or 6 pM (25 pM), but not 100 pM (30 pM) or 4 pM (25 pM). As obvious from the modified Bland–Altman plot, the majority (i.e., 79%) of the 365 data points lie inside the defined corridor.
Furthermore, to assess the precision of the SET screening method, we made use of the fact that four clones were enriched during an affinity optimization campaign and thus were identified several times during screening (as confirmed by sequencing). We found average KD values of 60 ± 32 pM (standard deviation, n = 39), 7 ± 5 pM (n = 23), 18 ± 8 pM (n = 27) and 13 ± 8 pM (n = 30), respectively (data not shown).
Discussion
We developed a high-throughput affinity-screening method (SET screening) suited for KD estimation of complex samples (i.e., antibody fragments and full-length antibodies in unpurified matrices). The solution-based affinity ranking is particularly suited for soluble protein antigens, but it was also successfully applied to large recombinant extracellular domains of cell surface receptors and peptides. The method was designed to enable efficient screening of affinity-matured antibodies derived from phage display libraries. It should, however, likewise be applicable to other antibody platforms or different classes of binding moieties like scaffolds or peptides, as long as the anticipated affinities are in the nM range or below and the interaction follows a 1:1 or 2:1 binding mode.
In contrast to many other screening methods, SET screening enables not only qualitative ranking of binding strength but also, at the same time, reliable estimation of true dissociation constants. Because KD estimations from SET screening and those from detailed analysis using purified samples are in very good agreement (see Fig. 5A–C ), the described approach allows the selection of antibodies within a desired affinity range with a high level of confidence. Moreover, success of an antibody maturation project with regard to affinity improvement can be assessed without purification and detailed affinity characterization of selected hits, leading to significant streamlining of antibody discovery.
The typical throughput of an affinity SET screening campaign is approximately 1500 antibodies within 2 days (including data evaluation). This is rather fast compared to kinetic screening platforms based on SPR or BLI,5,18,19 which additionally suffer from their susceptibility to artifacts due to matrix effects or low sample concentrations. An equivalent analysis in a high-affinity range by label-free methods like koff ranking would increase both the processing time and the data evaluation significantly. A typical screening of KD values in the 2–3-digit pM range would be equivalent to kinetic rate constants down to koff = 10−5 s−1. To resolve such interactions by time-resolved methods, relatively long run times are necessary (e.g., koff = 10−5 s−1 means that 5% dissociation takes place in approximately 90 min). Thus, depending on the capability of different platforms to analyze interactions in parallel and to run unattended, an equivalent screening would increase the processing time by at least 1 day (Octet HTX, up to 96 sensors; ForteBio, Port Washington, NY) or to 6 days (Biacore 4000, 16 parallel interactions; Biacore, Uppsala, Sweden) without taking into account the sensor preparation and data evaluation. Although label-free methods can often be successfully applied to characterize even high-affinity interactions, in our experience the demand for both high throughput and especially the compatibility with crude sample matrices, such as bacterial lysates, can be fulfilled more reliably and efficiently with the presented SET screening method. Because assay robustness with regard to sample matrices is a key factor for successful affinity screenings, we clearly favor SET screening over BLI-based methods here, even though processing time is not considerably faster.
Enzyme-linked immunosorbent assay (ELISA)-based methods using immobilized antigen are routinely applied for antibody screening2,20 and are usually compatible with unpurified samples. However, there is no reliable correlation between binding behavior on coated antigen in ELISA and the true affinity of the analyte. 21 Although applicable in high-throughput settings, ELISA-based approaches are not considered the method of choice for affinity screening. Even with more sophisticated setups, like ELISA-based SET, reliable ranking in the pM affinity range may be hardly feasible because standard ELISA plate readers might not provide a sufficient detection limit and linear range to comply with this application.
MSD-based SET and KinExA share the same basic principle: Interaction partners are titrated in solution and incubated until they reach equilibrium, followed by a detection step to quantify free analyte (e.g., antibody)—in KinExA, by flowing the equilibrated sample over beads (e.g., coated with antigen) and adding a fluorescence-labeled detection antibody. Thus, KinExA is likewise suited to determine pM affinities in solution. 22 However, this method usually consumes more sample volume and processes samples sequentially, and it is thus neither intended nor suitable for high-throughput applications such as the described affinity-screening process.
With regard to the accuracy of the method, we usually find good agreement between screening and detailed SET characterization data. The majority of KD values in the nM to low pM range deviated by less than a factor of three, compared to results from detailed SET KD analysis. To ensure reliable identification of high-affinity antibodies, especially in the low pM range (e.g., <30 pM), the absolute difference from the true affinity is considered more relevant than the deviation factor. In our experience, an absolute difference of less than 20 pM is acceptable in the vast majority of affinity optimization projects. Because about 80% of the overall 365 screening results compiled in Figure 5C met these criteria, the method proved to be fit for purpose during real-life performance. The dataset also comprises a number of screenings in which the affinity maturation exceeded the anticipated improvement factors [e.g., Fig. 5A , Antigen 2 (red circles)]. In these cases, the screening had been optimized for a higher KD range (i.e., the applied concentrations of antigen in solution were too high, and the test samples were not sufficiently diluted). Thus, significant titration was often already observed with the lowest antigen concentration. Although KD values in these screenings were often only estimated by rather poor fits, the ranking still allowed identification of the best affinities with sufficient reliability. Therefore, instead of repeating these screenings under optimized conditions, purification and detailed affinity characterization of the identified hits were in that case pursued as the more efficient strategy. However, in cases in which screenings were specifically optimized for extremely high affinities, reliable ranking was possible even for KD values lower than 20 pM.
Because the screened Fab fragments are supplied in crude, nonpurified matrix, their possible aggregate content cannot be easily assessed, for example by high-performance size exclusion chromatography (HP-SEC). Significant amounts of functional Fab aggregates may lead to a potential bias (i.e., KD values would be estimated too low due to avidity effects). However, this is only relevant for screenings with multimeric antigens, and these affinity-overestimated candidates could be identified during the confirmatory KD determination with purified samples later in the process.
Weak affinities may also limit the optimal performance of the assay because high KD values may lead to a bias in SET screening due to potential disturbance of the equilibrium during incubation on the immobilized antigen. 12 Based on our experience, KD values in the nM range and lower can be determined reliably. For interactions of very high affinity, extremely low analyte concentrations at the border of, or lower than, the detection limit of the MSD instrument (typically, in the single-digit pM range) need to be applied. However, these limitations are rather of theoretical interest, because the affinity range required for the vast majority of therapeutic antibody projects is clearly covered with the method described here. Therefore, SET screening is applicable not only for antibody maturation campaigns but also for screening of candidates with already adequate affinities (i.e., in the single-digit nM to sub-nM KD range) from initial panning outputs.
Furthermore, we tested the performance of SET screening without experimental analyte quantification. To this end, the concentration value used in the fit algorithm was assigned as variable parameter allowing a restricted concentration range based on typically observed analyte concentrations in lysates or supernatants. For evaluation, SET screenings were performed with and without experimental sample quantification. In our experience, the resulting KD estimations differed only to a negligible extent (data not shown). Reliability of this simplified approach is currently being evaluated during routine affinity screenings with the intention to further increase the efficiency and flexibility in affinity-screening campaigns.
Footnotes
Acknowledgements
The authors gratefully acknowledge all colleagues at MorphoSys AG who were involved in executing the presented screening campaigns or helped in tracking and compiling the presented data, the Protein Production Group for providing high-quality antibody and antigen proteins, and Kathrin Tissot for critically reviewing the manuscript.
Declaration of Conflicting Interests
The authors declared no potential conflicts of interest with respect to the research, authorship, and/or publication of this article.
Funding
The authors received no financial support for the research, authorship, and/or publication of this article.