
Abstract
Cyclic adenosine 3′,5′-monophosphate (cAMP) is an important second messenger, and quantification of intracellular cAMP levels is essential in studies of G protein–coupled receptors (GPCRs). The intracellular cAMP levels are regulated by the adenylate cyclase (AC) upon activation of either Gs- or Gi-coupled GPCRs, which leads to increased or decreased cAMP levels, respectively. Here we describe a real-time Förster resonance energy transfer (FRET)–based cAMP high-throughput screening (HTS) assay for identification and characterization of Gs-coupled GPCR ligands and phosphodiesterase (PDE) inhibitors in living cells. We used the β2-adrenergic receptor (β2AR) as a representative Gs-coupled receptor and characterized two cell lines with different expression levels. Low receptor expression allowed detection of desensitization kinetics and delineation of partial agonism, whereas high receptor expression resulted in prolonged signaling and enabled detection of weak partial agonists and/or ligands with low potency, which is highly advantageous in large HTS settings and hit identification. In addition, the assay enabled detection of β2AR inverse agonists and PDE inhibitors. High signal-to-noise ratios were also observed for the other representative Gs-coupled GPCRs tested, GLP-1R and GlucagonR. The FRET-based cAMP biosensor assay is robust, reproducible, and inexpensive with good Z factors and is highly applicable for HTS.
Keywords
Introduction
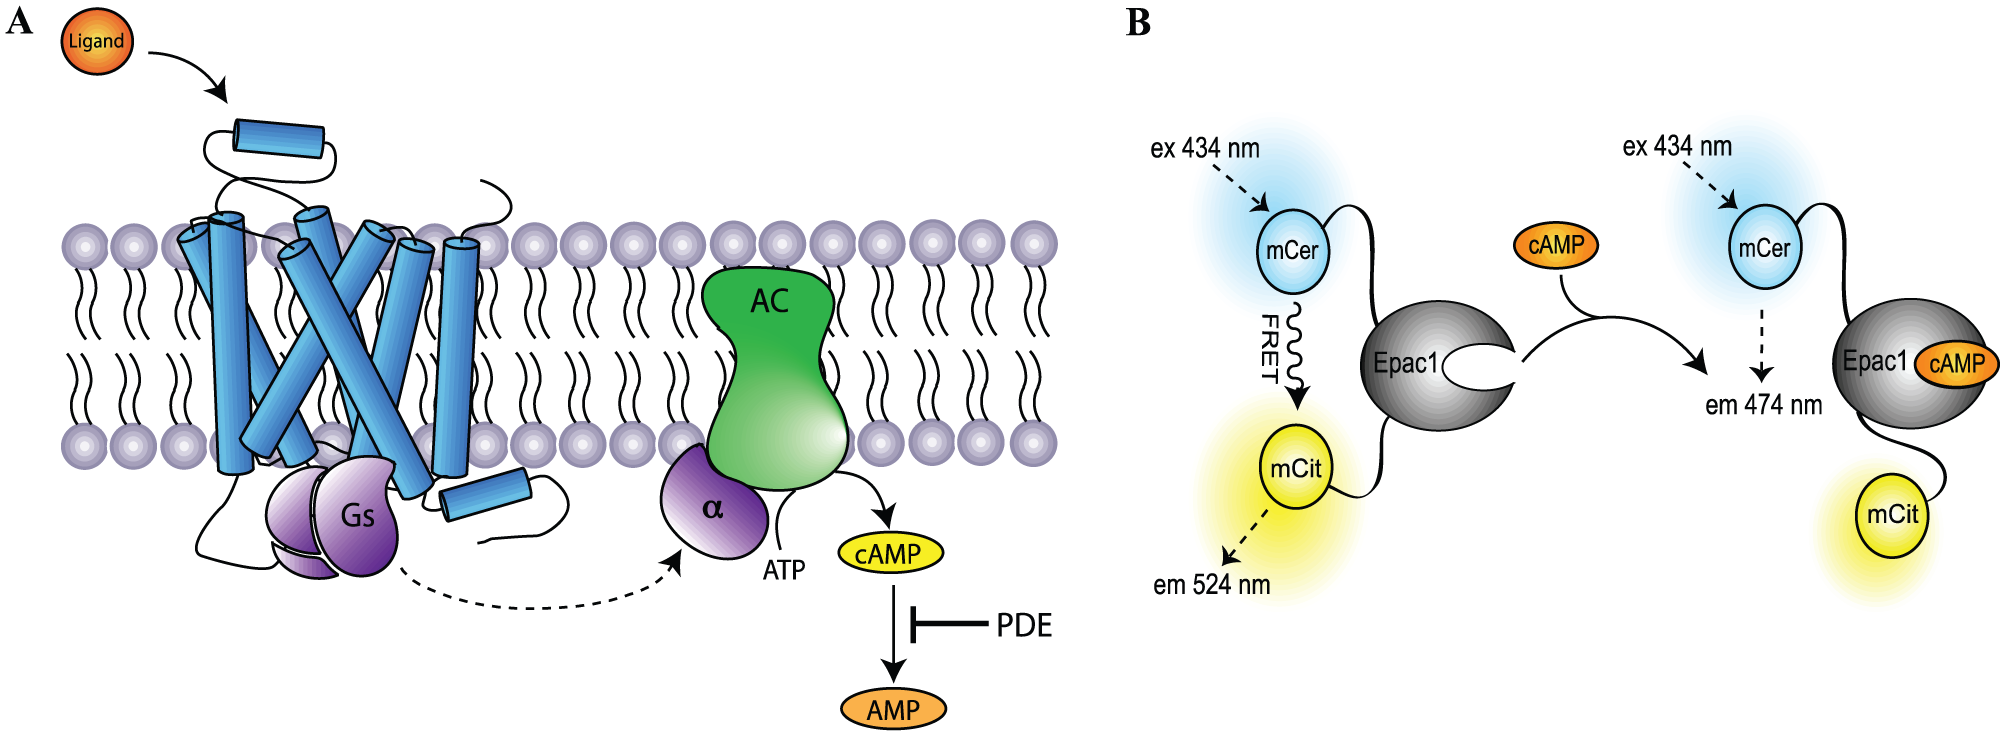
Cyclic adenosine 3′,5′-monophosphate (cAMP) is a common second messenger that serves to propagate intracellular signal transduction. Formation of cAMP is regulated via adenylate cyclases (ACs), which upon activation catalyze adenosine triphosphate (ATP) into cAMP and inorganic pyrophosphate. cAMP can lead to activation of protein kinase A (PKA) that regulates the activity of several other cellular proteins to mediate numerous biological responses. Once formed, cAMP is degraded to adenosine 5′-monophosphate (AMP) by specific phosphodiesterases (PDEs). G protein–coupled receptors (GPCRs) modulate intracellular cAMP levels through the heterotrimeric GTP binding protein complexes Gs and Gi. Activation of Gs-coupled GPCRs and thus Gαs results in stimulation of the AC and formation of cAMP, whereas activation of Gi-coupled GPCRs causes an inhibition of the AC via Gαi and a decrease in the intracellular cAMP levels ( Fig. 1A ).1,2
(
Since GPCRs comprise one of the largest gene families and ~26% of marketed drugs work by modulating GPCR activation,3,4 quantification of intracellular cAMP levels remains an important methodology in molecular pharmacological studies of GPCRs. In recent years, biosensors that monitor intracellular cAMP levels have been developed, and the ongoing improvement of these assays provides several opportunities compared with previously employed assays, 5 including the possibility to continuously measure the intracellular cAMP levels in real time. One such group of cAMP biosensors includes cAMP binding proteins fused to bioluminescent and/or fluorescent proteins for, respectively, Förster resonance energy transfer (FRET) and bioluminescence resonance energy transfer (BRET) measurement.6,7
High-throughput screening (HTS) enables testing of large libraries of compounds for activity at a given target. Besides a relevant assay readout, the assays for HTS have additional requirements. To be compatible with automation, miniaturization, and a suitable plate reader, an HTS assay should be amenable for 96, 384, or 1536 microplate formats and have a good signal-to-noise ratio, which is stable over the time it takes to quantify the readout with a suitable plate reader. An inexpensive and preferably homogenous assay format with minimal handling further adds to the HTS assay usability. 8
In previous work, we optimized a cAMP biosensor consisting of the Epac1 (exchange protein directly activated by cAMP) cAMP binding protein, flanked by yellow and cyan fluorescent proteins on either side with a more efficient FRET pair of fluorescent proteins. 9 During the characterization of the cAMP biosensor, we observed that the readout-obtained format was surprisingly stable and reproducible and thus possibly amendable for HTS. Here we describe the development of a FRET-based HTS assay for identification and characterization of Gs-coupled GPCR ligands and PDE inhibitors in live cells.
The β2-adrenergic receptor (β2AR) was used as a representative of a Gs-coupled GPCR receptor. Overexpression of GPCRs results in saturation of the cellular desensitization capacity and thus continuous G protein coupling, reflected by prolonged downstream signaling.10–13 Prolonged signaling may be preferable in HTS applications, and we therefore characterized two cell lines with different expression levels of the β2AR for comparison.
The β2AR can form an active-state complex without an agonist, a phenomenon also known as constitutive or basal activity. This agonist-independent activity can, however, be inhibited by inverse agonists. Drugs that inhibit the constitutive activity might be more effective therapeutics than neutral antagonists, and the interest for these types of compounds have been growing. 14 In the cell line overexpressing the β2AR, accumulation of cAMP due to constitutive activity was evident when the PDE inhibitor 3-isobutyl-1-methylxanthine (IBMX) was added, which we exploited to develop assay conditions compatible with identification of β2AR inverse agonists and PDE inhibitors. As described above, specific PDE inhibitors prevent the natural degradation of cAMP into AMP, resulting in increased cAMP concentrations. The various PDE isoforms are activated by a number of different mechanisms and are involved in numerous cellular processes due to their ability to hydrolyze and thus control the breakdown of the second-messenger signaling molecules cAMP and cyclic guanosine monophosphate. 15 The cAMP PDE enzymes play a crucial role in regulating temporal and spatial changes in intracellular cAMP concentrations and have been used as important therapeutics for decades.5,16
Although FRET-based cAMP biosensors were developed a decade ago,17–19 they have not previously been applied in an HTS setting. As described above, we recently developed an optimized cAMP biosensor, 9 and here we demonstrate that this biosensor shows great reproducibility and signal stability when used with overexpressed Gs-coupled GPCRs, enabling cAMP biosensor-based HTS.
Materials and Methods
Materials
Isoproterenol, forskolin, ICI 118-551 (ICI), epinephrine, norepinephrine, salbutamol, salmeterol, ritodrine, fenoterol, alprenolol, glucagon, oxyntomodulin, GLP-1-(7-36), rolipram, zaprinast, caffeine, HEPES, IBMX, magnesium and calcium chloride, bovine serum albumin (BSA), and Whatman glass microfiber filters (grade GF/B) were purchased from Sigma-Aldrich (Broendby, Denmark). Dulbecco’s modified Eagle’s medium (DMEM), Hank’s balanced salt solution (HBSS), fetal bovine serum (FBS), zeocin, geneticin G418, and penicillin/streptomycin were purchased from Invitrogen (Naerum, Denmark). Black 384-well plates were purchased from Greiner Bio-One (Kremsmünster, Austria). [3H] dihydroalprenolol and EnVision Xcite multilabel plate reader were from PerkinElmer (Waltham, MA).
Methods
cAMP FRET biosensor construct
The cAMP FRET biosensor consists of Epac1 fused with mCerulean (mCer) in the amino terminal and mCitrine (mCit) in the carboxy terminal. Binding of cAMP to Epac1 results in a conformational change within Epac1 by which the distance between the two fluorescent proteins increases and leads to a decrease in FRET. Generation of the construct has previously been described in Mathiesen et al. 9 In short, the engineered expression vector for FRET biosensors (pcDNA3.1(+)zeo-mCer-MCS-mCit) was generated by sequential subcloning of PCR-amplified DNA encoding mCerulean and mCitrine into a small multiple cloning sequence (MCS) of pcDNA3.1(+)zeo. Complementary DNA (cDNA) encoding Epac1 amino acids 149 to 881 was then amplified and subcloned in between the two fluorescent proteins using the MCS.
Cell culture and expression of the cAMP biosensor in HEK293 cells
The β2AR used as a representative Gs-coupled GPCR is endogenously expressed in native HEK293 cells. The cAMP FRET biosensor construct was therefore stably expressed in HEK293 cells using the calcium phosphate transfection method as described in Mathiesen et al. 9 The cAMP FRET biosensor cells were maintained in DMEM supplemented with 10% fetal bovine serum and 1% penicillin/streptomycin at 37 °C with 5% CO2. Zeocin at 60 µg/mL was used for selection and maintenance of the stably transfected cells.
Overexpression of the β2 adrenergic receptor
To enhance the β2AR signaling, the β2AR was recombinantly overexpressed in the parent Epac149 biosensor cell line by transfecting cells with a plasmid encoding the human β2AR in pcDNA3.1(+)neo by the calcium phosphate transfection method. To obtain stably transfected cells, G418 at 500 µg/mL was used for selection, while zeocin at 60 µg/mL and G418 at 500 µg/mL were used to maintain the cells. The β2AR-overexpressing Epac149 biosensor cell line will be referred to as the β2AR Epac149 biosensor cell line or the overexpressing cell line.
Determination of β2AR expression levels by saturation binding
Expression levels of β2AR in the native and overexpressing cell lines were determined by whole-cell [3H] dihydroalprenolol ([3H]DHA) saturation binding. Adherent cells grown in T175 flasks or 150-mm dishes to approximately 80% to 90% of confluence were detached by removing growth medium, and rinsing with DPBS once (no Ca2+ and no Mg2+), followed by incubation with DPBS supplemented with 2 mM EDTA for approximately 5 min or until detachment of cells. Cells were spun down at 1000 rpm for 5 min in a swinging bucket centrifuge; meanwhile, 10-µL single-cell suspension cells were counted using a hemocytometer. The supernatant was carefully removed and the cells resuspended to 1.0 × 10⁶ cells/mL in assay buffer consisting of HBSS (without Mg2+ and Ca2+) supplemented with 20 mM HEPES, 1 mM MgCl2, 1 mM CaCl2, and 0.2% BSA.
Saturation binding was carried out in a total volume of 500 µL with 500,000 cells/tube for native expressing cells and 30,000 cells/tube for β2AR-overexpressing cells in assay buffer to minimize the potential ligand depletion. Cells, native or β2AR-overexpressing, were incubated with 0.12 to 7.5 nM [3H]DHA for 3 h on ice and terminated by three washes of 2 mL of the above HBSS buffer. Nonspecific binding was determined in the presence of 10 µM cold alprenolol. Total and nonspecific binding as well as the exact concentrations of [3H]DHA used were quantified by liquid scintillation counting for total and nonspecific binding after overnight incubation of filters in UltraGold (Perkin Elmer, Denmark) scintillation fluid. Determinations were made in duplicates and counts recalculated to the number of receptor binding sites.
Measurement of Gs-coupled GPCR activation using the cAMP biosensor
In vitro experiments were performed on HEK293 cells stably expressing the cAMP FRET biosensor and either endogenously or recombinantly overexpressed β2AR. Cells were prepared as described above and resuspended at 750,000 cells/mL in assay buffer. The cells were left in the dark while preparing ligand solutions. For agonist screening, ligand solutions were prepared in two times the final concentration in assay buffer, and 20 µL ligand solution was added to a black 384-well plate. Then, 20 µL cell suspension (corresponding to 15,000 cells/well) was added by hand or with the EnVision pump (PerkinElmer). The plate was read continuously immediately after adding the cells on an EnVision plate reader, measuring the fluorescence of mCer (474 nm) and mCit (524 nm) upon mCer excitation (434 nm).
Detection of inverse agonists
To detect inverse agonism, the PDE inbibitor IBMX was added to the assay buffer to induce cAMP accumulation in the receptor-unstimulated condition. A cell suspension with 750,000 cells/mL of β2AR Epac149 biosensor cells was prepared as described previously. The inverse agonist ICI 118-551 (ICI) was prepared in 20 µM (corresponding to two times the final concentration) in assay buffer with 100 µM IBMX. Then 20-µL ligand solution and 20-µL cell suspension (corresponding to 15,000 cells/well) were added to a black 384-well plate, and the plate was read continuously on an EnVision plate reader as described above.
Detection of phosphodiesterase inhibitors using the cAMP biosensor
For PDE inhibitor characterization, IBMX, rolipram, caffeine, and zaprinast were prepared in serial dilutions (two times the final concentration) in assay buffer. A cell suspension with 750,000 cells/mL of β2AR Epac149 biosensor cells was prepared as described above. Then, 20 µL PDE inhibitor and 20 µL cell suspension were added to a black 384-well plate, and the plate was read on an EnVision plate reader immediately after adding the cells.
Data analysis
Data were analyzed and presented using GraphPad Prism (GraphPad Software, San Diego, CA). In principle, the FRET ratio decreases upon cAMP accumulation, but to obtain graphs that correlate positively with cAMP concentrations, the FRET ratios were calculated as the ratio between the fluorescence of mCerulean and mCitrine.
Z factors was calculated as Z = 1 – [(3*SDsample + 3*SDcontrol)/(meansample – meancontrol)] as described by Zhang et al. 20
Results and Discussion
Assay Characterization and Detection of Gs-Coupled GPCR Activation
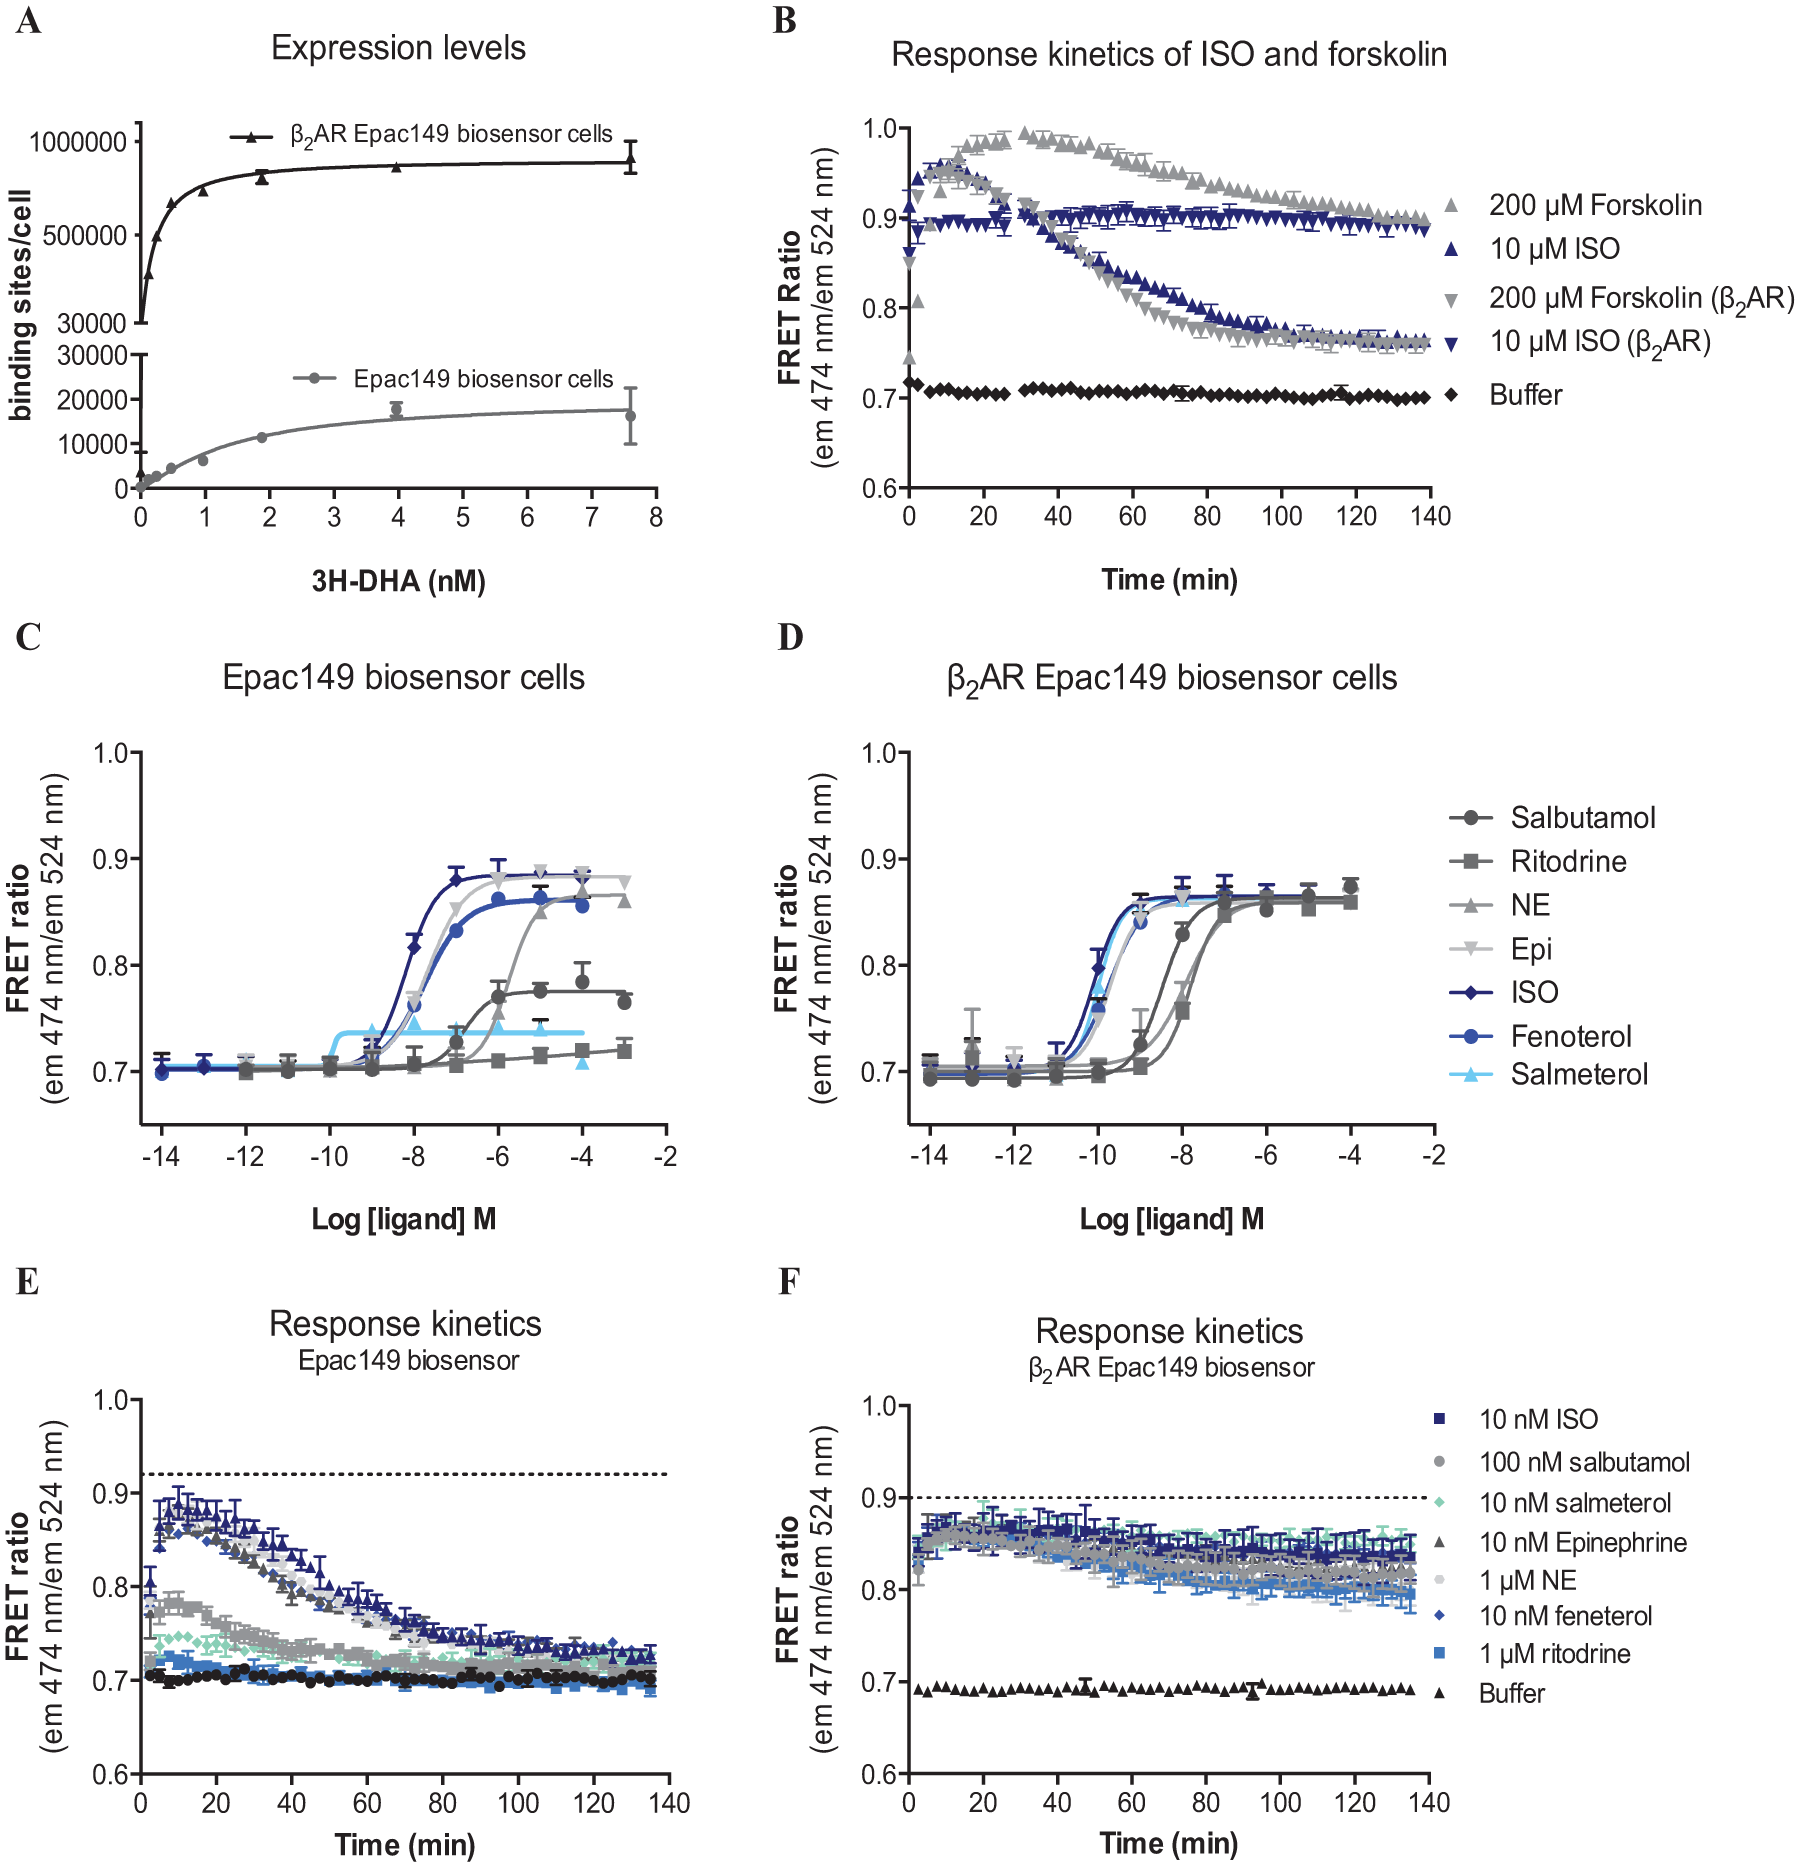
The assay presented here allowed measurement of Gs-coupled receptor activation through quantification of the intracellular cAMP levels in live cells. Agonist activation of the β2AR results in Gs-mediated adenylate cyclase activation and increased intracellular cAMP levels ( Fig. 1A ). Binding of cAMP to the Epac1 part of the biosensor induces a conformational change within the Epac1 protein, leading to an increased distance between the fluorescent proteins of FRET pair ( Fig. 1B ) and a decreased FRET signal. Two Epac149 biosensor HEK293 cell lines with different expression levels of the β2AR were used in the initial studies to establish the effect of receptor overexpression on biosensor signal magnitude and duration. The low-expressing β2AR cell line expressed the β2AR endogenously, whereas the high-expressing β2AR cell line was obtained by stable overexpression of β2AR. Expression levels of the two cell lines were determined by [3H]DHA saturation binding ( Fig. 2A ). The low-expressing cell line displayed a Bmax corresponding to 19.800 ± 4.500 binding sites/cell, whereas the high-expressing cell line had a Bmax of 900,000 ± 30,000 binding sites/cell. The Kd values of the low- and high-expressing cell lines were averaged to 1.02 ± 0.37 nM and 0.61 ± 0.20 nM (mean ± SEM), respectively (no significant difference, Student t test). Thus, there was a 45-fold difference in β2AR expression levels between the two cell lines.
(
To determine the effect of the receptor expression level on the intracellular cAMP kinetics on agonist activation, the low and high β2AR-expressing cell lines were stimulated with different reference agonists. Isoproterenol (ISO) at 10 µM produced a substantial increase in the cAMP level in both cell lines over time ( Fig. 2B ) that decayed significantly within 120 min for the low-expressing cell line. Forskolin, a direct activator of AC, also produced a significant increase in intracellular cAMP. The maximal forskolin response was higher than that produced by ISO, suggesting that full β2AR activation did not reach cAMP levels that saturated the dynamic range of the cAMP biosensor ( Fig. 2B ).
Both cell lines were subsequently stimulated with the β2AR agonists ISO, salbutamol, salmeterol, fenoterol, ritodrine, epinephrine (Epi), and norepinephrine (NE) to generate concentration-response curves ( Fig. 2C , D ). The time point at which maximal cAMP levels were reached (12.5 min) was used for concentration-response curve generation. In the low-expressing cell line, ISO, Epi, NE, and fenoterol produced similar maximal responses, whereas salbutamol and salmeterol only activated the receptor partially ( Fig. 2C ), in agreement with previously published data.21,22 In contrast, all agonists produced similar maximal responses ( Fig. 2D ) in the high-expressing cell line due to overexpression of the β2AR. Potencies were determined in both cell lines and were found to be approximately 100-fold more potent in the high-expressing cell line. The rank order of agonist potencies in the cAMP assays of both the low- and high-expressing cell lines was found to correlate with each other and with the profile of β2AR agonists in the literature.21,23
To examine a potential difference in kinetics of ligands and between cell lines, the cAMP response kinetics were plotted at the concentration at which signal saturation was reached ( Fig. 2E , F ). In the parent Epac biosensor cell line with low native β2AR expression, a fast and transient cAMP response was observed upon agonist-mediated receptor activation, and there were no significant differences in the cAMP response kinetics between the different β2AR agonists ( Fig. 2E ). In the β2AR Epac biosensor cell line, all agonists induced an immediate and prolonged cAMP signal ( Fig. 2F ) that did not return to the basal level as seen for the parent Epac149 biosensor cell line in the measured time frame of 140 min. This phenomenon is most likely due to the presence of spare receptors in the high-expressing cell line. These results are consisting with previous studies, enlightening that receptor overexpression may cause a saturation of the desensitization capacity of the cell, resulting in prolonged downstream signaling. 13 Another consequence of receptor overexpression was that partial agonism was masked. Salbutamol and even ritodrine, which produced only a negligible cAMP increase in the parent Epac149 biosensor cell line, appeared as full agonists in the overexpressing cell line ( Fig. 2D ). The desensitization capacity of the cell, on the other hand, was not saturated in the parent Epac149 biosensor cell line with low native β2AR expression, consistent with the transient cAMP production.
Based on the above comparison of the low- and high-expressing cell lines, it is clear that overexpression of the β2AR 1) enables detection of weak and/or partial agonists and (2) results in a sustained signal over time, which is highly advantageous in large HTS screens aimed at hit identification. On the other hand, endogenous expression levels allow for examination of desensitization kinetics and differentiation of full from partial agonists, which may be a problem in general cAMP accumulation assays. 5 The initial cAMP kinetics of agonist stimulation can, however, not be reliably quantified due to the fast onset of cAMP formation.
HTS Applicability
Overexpression of the β2AR resulted in a sustained signal over time, and even though the cAMP kinetics are far from the physiological response, these conditions are likely preferable in ligand screening setting. Consequently, only the high-expressing β2AR Epac biosensor cell line was further studied for its HTS applicability.
Detection of agonists and inverse agonists
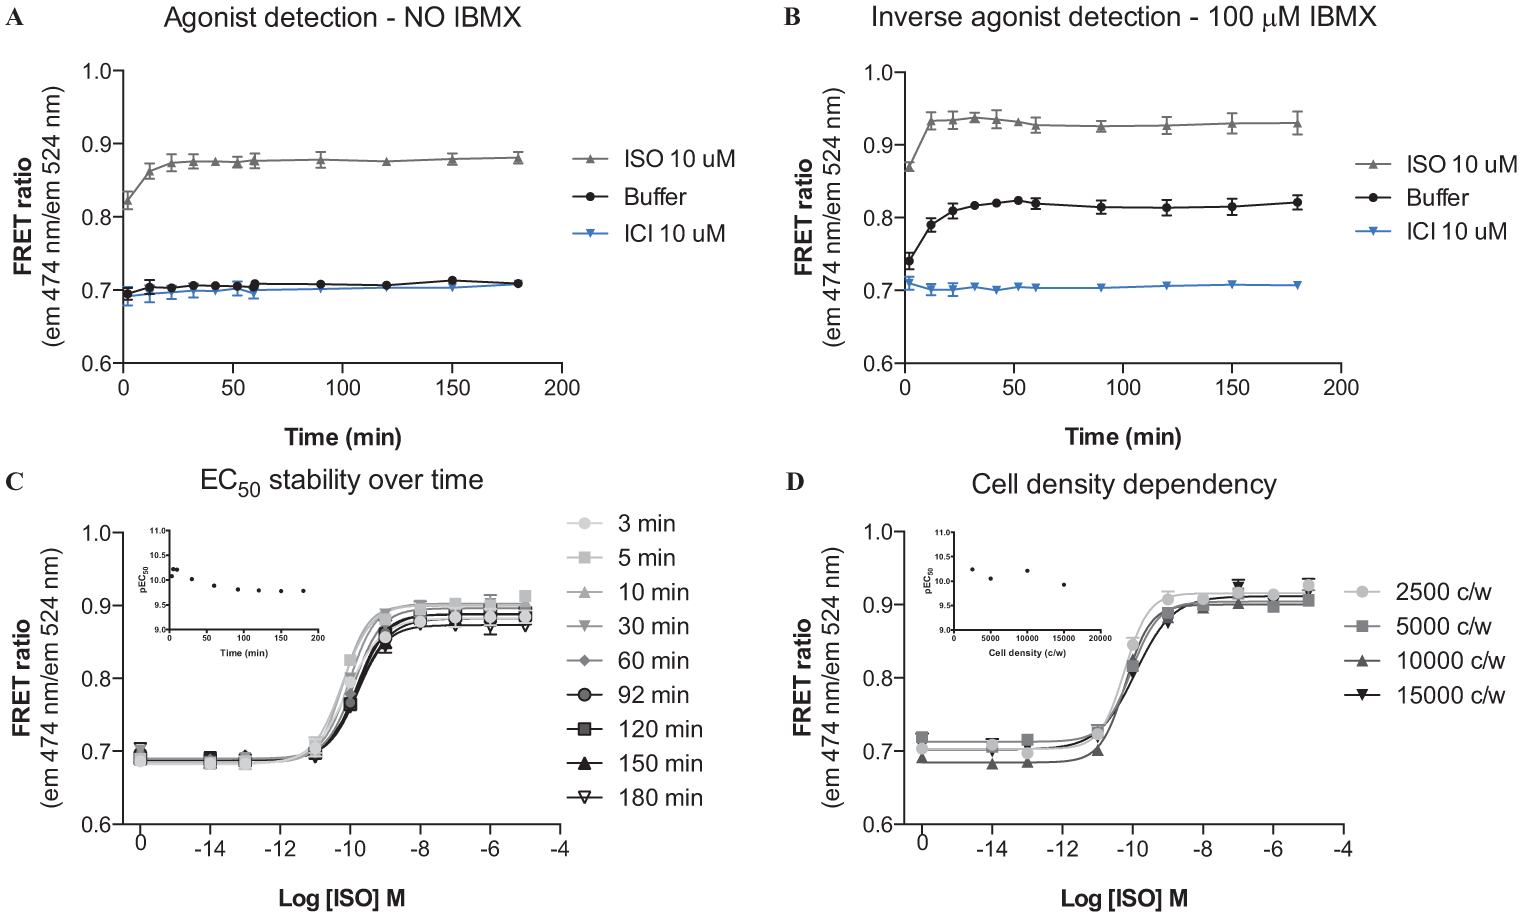
To further explore conditions optimal for a stable and a sustained signal, the effect of IBMX, a known PDE inhibitor used for accumulating cAMP in relation to other cAMP detection principles, was tested. The effects of buffer, ISO, and the inverse agonist ICI on cAMP levels over 180 min were examined in the absence ( Fig. 3A ) and presence ( Fig. 3B ) of IBMX. IBMX at 100 µM perturbed the cAMP turnover and increased unstimulated cAMP levels toward the stimulated ISO state, reflecting the constitutive activity of the β2AR.
(
Without addition of IBMX, a large assay window that allowed agonist detection was obtained, and ISO produced a prominent increase in cAMP and thus a large change in the FRET ratio ( Fig. 3A ). Addition of the PDE inhibitor IBMX allowed the cAMP formed, due to constitutive activity, to accumulate and thereby enabled inverse agonist screening. Under these conditions, the inverse agonist ICI efficiently inhibited the cAMP levels below the basal level ( Fig. 3B ), confirming that the assay can also be applied for screening for inverse agonists.
Reproducibility of assay parameters over time
To generate reproducible data, functional assays often have limitations to assay parameters such as the time point at which the assay response is quantified and the amount of cells used. To test the assay stability over time, ISO concentration-response curves and EC50 values were examined at different time points and at different cell densities.
The EC50 of ISO was determined at nine different time points ranging from 3 to 180 min to test the assay stability over time ( Fig. 3C ). Only small variations were observed, and the average EC50 value was determined to 0.12 nM with a pEC50 value of 9.9 ± 0.04. Over time, there was a tendency toward a minor right shift of the ISO concentration-response curves with the EC50 increasing from 0.08 nM to 0.17 nM (twofold) over 3 h.
The EC50 of ISO was also determined at four different cell densities covering a sixfold difference in cell densities ranging from 2500 cells/well to 15,000 cells/well ( Fig. 3D ). Only minor variations in the concentration-response curves were observed, with an average EC50 of 0.08 nM ranging from 0.06 to 0.12 nM with a pEC50 of 10 ± 0.05, also corresponding to a twofold change. Unlike most other functional assays, the cAMP biosensor FRET assay is less dependent on the cell density between assays. Many functional assays rely on quantification of the absolute levels of the second messenger formed by a specific number of cells. Because the cAMP biosensor FRET readout is quantified by FRET in each single cell by the unimolecular cAMP biosensor, the assay is less dependent on the cell density. For the FRET cAMP biosensor, the limitation on cell density is rather due to the plate reader sensitivity range (too high or too low signal) for the fluorescence protein intensity determination used to calculate the FRET ratio.
The assay is thus stable over a range of time points and cell densities, which is an advantage when using the assay in an HTS campaign. Although we here described how to use cells in suspension, similar results are also observed for adherent cells (data not shown). If necessary, the cAMP concentrations can be calculated via a standard curve as described in Mathiesen et al. 9
Assay reproducibility and Z factors
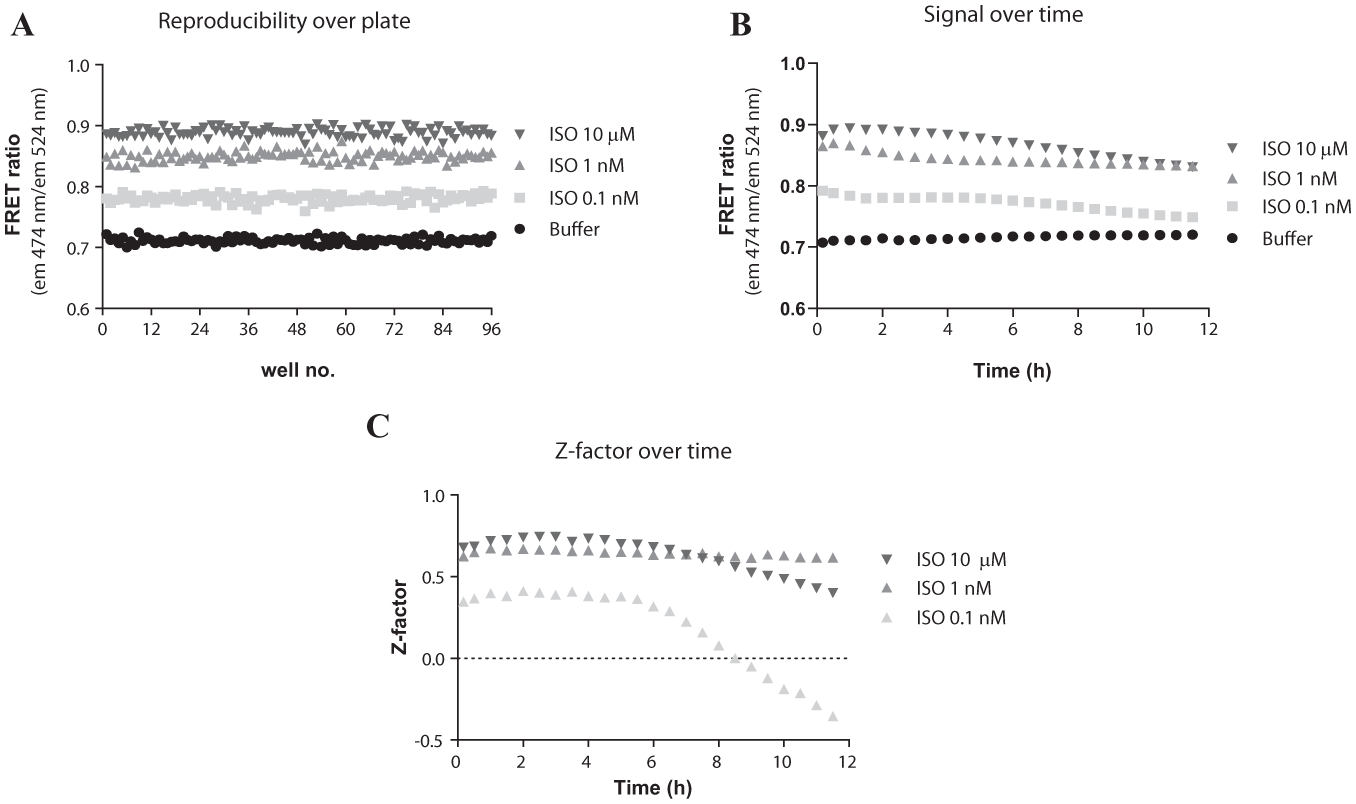
The assay reproducibility was assessed by determination of the Z factor at optimal and more challenged conditions since the signal-to-noise ratio appeared to be stable for over 3 h when stimulated with a full agonist at a 10 µM saturable concentration ( Fig. 3A ). The Z factor determination was thus determined 1) continuously for 12 h after initiation and 2) at different ISO concentrations corresponding to EC100, EC80, and EC40 cAMP levels. The assay was reproducible ( Fig. 4A ) and the signals stable for at least 6 h ( Fig. 4B ). The calculated Z factors were correspondingly good and stable for at least 8 h ( Fig. 4C ). However, at the lower EC40 ISO concentration, the Z factor was ~0.4 for the first 6 h, after which it rapidly declined.
(
Phosphodiesterase Inhibitor Detection
Phosphodiesterase inhibitors have been used as important therapeutics as well as tool compounds for decades. 16 As mentioned previously, PDEs degrade cAMP by catalyzing the hydrolysis of the 3’ester bond to form AMP. During assay optimization using IBMX to accumulate cAMP ( Fig. 3B ), we hypothesized that the Epac1 biosensor might also be used to identify and characterize PDE inhibitors in addition to Gs-coupled GPCR ligands.
To test this, four PDE inhibitors were tested in the β2AR Epac biosensor cell line. IBMX and rolipram both produced dose-dependent inhibition of the cAMP degradation and thus an increase in the cAMP levels ( Fig. 5 ), whereas only the highest concentrations of caffeine and zaprinast led to increased cAMP levels. These differences are most likely due to the subtype selectivity of the PDE inhibitors in relation to the PDEs expressed in HEK293 cells. The results indicate that the β2AR Epac biosensor cell line can also be used for detection of PDE inhibitors. Likely, in the Epac biosensor cell line, the overexpressed constitutive active β2AR continuously generates cAMP, which is continuously degraded by PDEs. Therefore, perturbation of the constant steady-state cAMP level ( Fig. 3A ) by a PDE inhibitor results in a new increased cAMP steady-state level ( Fig. 3B ). This difference in cAMP levels by PDE inhibitors may thus be used for identification and characterization of PDE inhibitors.
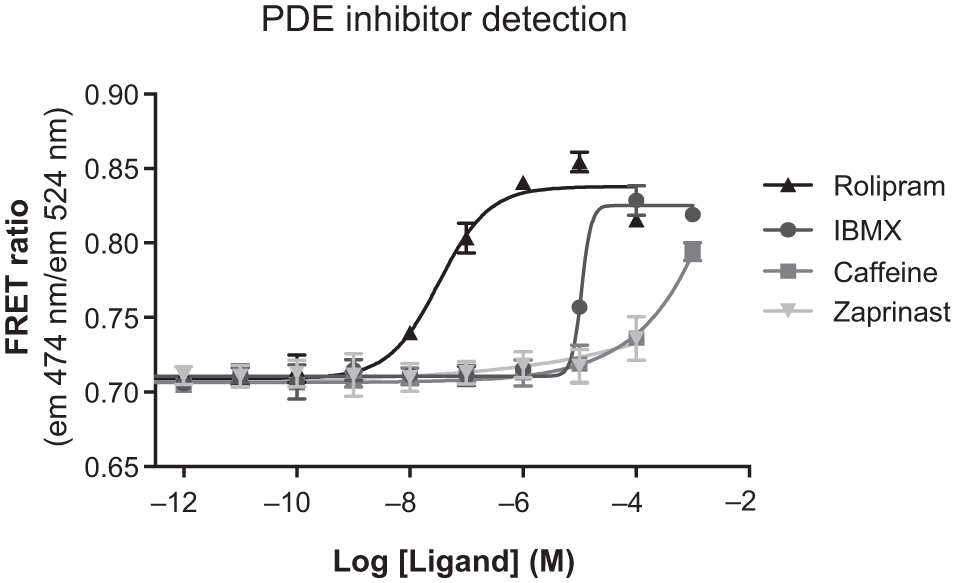
Concentration-response curves of four phosphodiesterase (PDE) inhibitors (3-isobutyl-1-methylxanthine [IBMX], rolipram, caffeine, and zaprinast) in β2AR Epac149 biosensor cells. Full curves were obtained with rolipram and IBMX, whereas only the highest concentrations of caffeine and zaprinast were able to induce changes in Förster resonance energy transfer (FRET).
cAMP Epac Biosensor and Other GPCRs
In this study, the β2AR was used as a representative Gs-coupled receptor, although the Epac biosensor may also be expressed with other GPCRs to detect Gs signaling. The glucagon-like peptide 1 receptor (GLP-1R) and glucagon receptor, which both increase cAMP levels in HEK293 cells when activated, were stably expressed in the native Epac biosensor cell line as described for the β2AR. The agonists GLP-1(7-36), oxyntomodulin, and glucagon all produced dose-dependent increases in the FRET ratio according to their known pharmacology in the respective cell lines ( Fig. 6 ), verifying that the biosensor may be used with other Gs-coupled GPCRs. A similar increase in cAMP response upon agonist stimulation has previously been observed in HEK293 cells expressing the Epac biosensor and the GLP-1R. 24
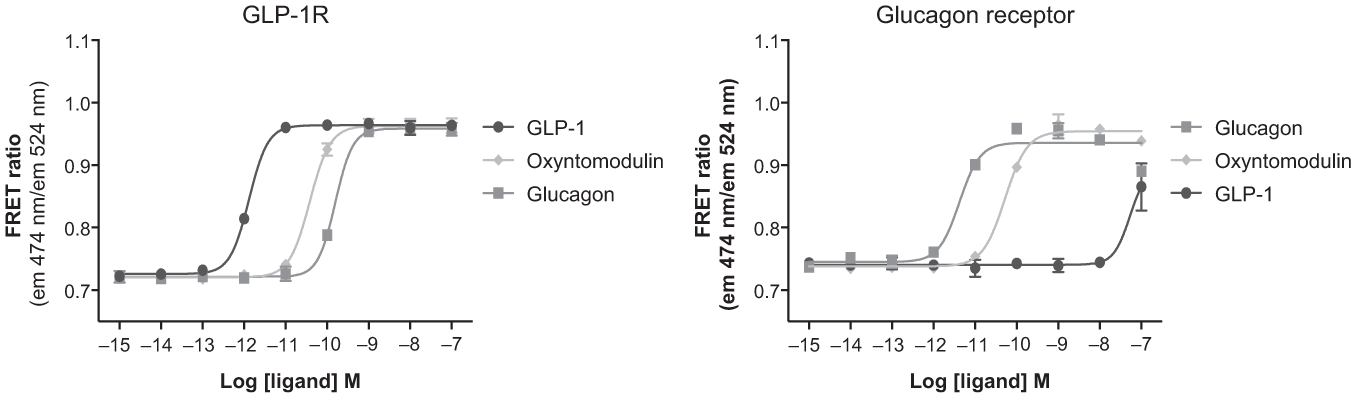
Concentration-response curves of glucagon-like peptide-1 (GLP-1), oxyntomodulin, and glucagon in cells expressing the Epac149 biosensor and either the glucagon-like peptide 1 receptor (GLP-1R) or the glucagon receptor. FRET, Förster resonance energy transfer.
In conclusion, we here show that the FRET-based cAMP biosensor cell line overexpressing a Gs-coupled receptor can be used for HTS. The assay is amenable for the 384-well plate format and does not require any costly reagents to quantify the intracellular cAMP levels. The readout is robust, largely independent of cell density, reproducible with good Z factors, and stable for at least 8 h. Overall, the presented assay is highly amenable for HTS applications and hit confirmation of Gs-coupled GPCR agonists, PDE inhibitors, and other GPCR ligand classes such as inverse agonists.
Footnotes
Declaration of Conflicting Interests
The authors declared no potential conflicts of interest with respect to the research, authorship, and/or publication of this article.
Funding
The authors disclosed receipt of the following financial support for the research, authorship, and/or publication of this article: This work was supported by grants from the Lundbeck Foundation, the Carlsberg Foundation and The Danish Council for Independent Research, Medical Sciences.