
Abstract
High-content screening of compound libraries poses various challenges in the early steps in drug discovery such as gaining insights into the mode of action of the selected compounds. Here, we addressed these challenges by integrating two biological screens through bioinformatics and computational analysis. We screened a small-molecule library enriched in amphiphilic compounds in a degranulation assay in rat basophilic leukemia 2H3 (RBL-2H3) cells. The same library was rescreened in a high-content image-based endocytosis assay in HeLa cells. This assay was previously applied to a genome-wide RNAi screen that produced quantitative multiparametric phenotypic profiles for genes that directly or indirectly affect endocytosis. By correlating the endocytic profiles of the compounds with the genome-wide siRNA profiles, we identified candidate pathways that may be inhibited by the compounds. Among these, we focused on the Akt pathway and validated its inhibition in HeLa and RBL-2H3 cells. We further showed that the compounds inhibited the translocation of the Akt-PH domain to the plasma membrane. The approach performed here can be used to integrate chemical and functional genomics screens for investigating the mechanism of action of compounds.
Introduction
The delivery of new drugs to the market has been declining in past years because of failures in clinical phase II and III trials that have caused a concomitant increase in the costs of drug development. 1 Part of the problem in drug discovery lies in the difficulty of analyzing how cellular networks are regulated, integrated, and respond to chemical perturbations. Initial efforts focused on gene expression profiling on drug treatment to create connectivity maps, 2 but more recently, phenotypic and high-content assays have been employed. Data have shown that phenotypic screening resulted in the development of more new drugs than with target-based assays.3,4 However, many of these phenotypic screening assays do not use all of the information collected and are limited to only one or two parameters. 5 This is because the high level of complexity and large amount of data pose challenges for their analysis and interpretation. Nevertheless, the high complexity and granularity provide a means to identify the molecular pathways affected, just as in genetic screens the phenotypic alterations in a mutant are the signature of specific signaling pathways. With this complexity also arises the problem of defining hits and reducing the number of hits to a manageable number for follow-up studies. In phenotypic screening, two major obstacles, mechanism of action identification and hit definition, require novel methodologies to be developed, including computational approaches.
To improve hit and pathway identification, we used an approach based on the integration of chemical and functional genomics high-content screens. We have previously conducted a genome-wide, image-based RNAi screen on the endocytosis and the endosomal distribution of two types of fluorescent cargo, epidermal growth factor (EGF) as a prototype for signaling cargo and transferrin (Tf), a recycling cargo, in HeLa cells. 6 An important feature of this screen was that the genes were profiled using a set of 62 quantitative parameters describing endocytic features such as the amount of total endocytosed cargo, the number of endosomes, size, the amount of cargo per endosome, and the intracellular position of the endosomes. This approach led to the identification of ~4600 genes involved in various pathways, including signaling and metabolism. 6 In principle, the multiparametric profiles obtained in the functional genomic screen could serve as reference profiles for a comparison with phenotypes induced by pharmacological perturbations. Indeed, such a comparison has been successfully applied to identify and characterize compounds that restore mycobacterium killing by the host. 7 By bridging functional genomics with compound screens, this method cannot identify the precise target protein(s) but can be used to predict pathways modulated by the compounds. How applicable this method is to other assays and cell types remains to be determined.
In this study, we wanted to further test whether the combination of chemical and genomic screens and computational approaches could be used to identify both hits and pathways modulated by the selected compounds. First, we addressed a biological process governed by signaling molecules partitioning in membrane microdomains and undergoing intracellular trafficking. We chose mast cell degranulation to modulate pharmacologically, which is highly relevant for both basic and applied research. During allergic reactions, mast cells degranulate and release histamine, the main causative agent for allergic symptoms. 8 Most therapeutics target the histamine-1 receptor using antihistamines, but other signaling receptors and pathways are involved in the allergic response. One particular pathway involves the binding of IgE to the receptor FCεRI, to release mediators, such as histamines and cytokines. 9 FCεRI has been shown to be endocytosed upon activation and reside in membrane microdomains. 10 We aimed to identify novel inhibitors of IgE-mediated degranulation of mast cells with an improved pharmacological profile compared with miltefosine, our internal reference compound. Miltefosine is a potent mast cell inhibitor in vitro and ex vivo and effective in the clinic in mast cell related diseases,11,12 although it can induce adverse effects when administered systemically. Furthermore, to identify the pathways modulated by hit compounds, we screened the same library in an endocytosis assay and correlated the screen results using computational and bioinformatics analysis. The pathways identified were then tested in several cell lines to validate the predictions of our method.
Methods and Materials
Degranulation, Cytotoxicity Assays
The degranulation assay was as previously described. 13 Briefly, RBL-2H3 cells were lysed in 0.1 mL complete MSD lysis buffer/well (MSD Tris Lysis buffer containing phosphatase inhibitor 1, phosphatase inhibitor 2, protease inhibitor solution, and 2 mM PMSF) for 30 min at 4 °C with gentle agitation. Lysates were pooled and centrifuged 10 min with 10,000 × g at 4 °C. Aliquots were taken for hexosaminidase measurement and determination of protein concentration. Lysates were aliquoted, snap-frozen in liquid nitrogen, and stored at −80 °C. The controls used are defined as follows: negative control was the supernatant of unstimulated cells measured for unspecific β-hexosaminidase release, positive control was the supernatant of DNP (dinitrophenyl)–human serum albumin (HSA)–stimulated cells measured for specific, antigen-stimulated β-hexosaminidase release, and the maximum control was the lysate of unstimulated cells measured for total β-hexosaminidase content. Degranulation was calculated as the percentage of β-hexosaminidase released with respect to maximum control (total β-hexosaminidase) after subtraction of negative control (unspecific release) using the formula % degranulation = 100 × (test compound – negative control)/(maximum control – negative control).
Cytotoxicity was determined using a commercially available membrane integrity assay (Promega Cytotox-One). 13 The maximum tolerated concentration (mtc) was defined as the highest concentration tested leading to a mean LDH release of ≤15% of that of the maximum control.
Degranulation hits were determined to be compounds with a degranulation inhibition ≥75%. Subsequently, hits were ranked according to their safety index to select the compounds with the largest margin between desired effect (inhibition of degranulation) and cytotoxicity (compromised membrane integrity). The safety index is the mtc determined in a membrane-integrity assay over the IC50 in the degranulation assay (safety index = mtc/IC50).
Endocytosis Assay
HeLa cells were seeded in 384-well plates at ~500 cells/well. After 72 h, compounds were given and incubated for 2 h in the presence of serum. The medium was completely removed and the staining solution was added consisting of DMEM, Penn/Strep, 100 ng mL−1 EGF-Alexa 488, and 5 µg mL−1 Transferrin-Alexa 647 (Molecular Probes) in serum-free medium for 10 min at 37 °C before fixation with formaldehyde. Nuclei and cytoplasm were stained, respectively, with 0.4 µg mL−1 DAPI and 0.2 µM SYTOblue (Molecular Probes).
Triple color images were acquired using an automated spinning disk confocal microscope (OPERA, Evotec Technologies/Perkin-Elmer). Fifteen images were taken per well. Image analysis and correction were performed using custom-designed image analysis software (see the supplementary information in ref. 6 for more details).
The data were normalized to the median of the negative control wells, DMSO. Significance for each parameter is a z-score of ±2. Strong endocytic regulators shown in bold in
Correlation and Enrichment Analysis
Correlation and enrichment analysis was primarily performed similar to the previously published protocol.
14
Briefly, profiles consisting of 32 endocytic parameters for each compound (EGF and Tf parameters 1–15:
Phosphoprotein Analysis: Meso Scale Discovery Plates
All buffers and solutions used for the phosphoprotein assay were provided by Meso Scale Discovery. Lysis buffer consisted of 150 mM NaCl, 20 mM Tris, pH 7.5, 1 mM EDTA, 1 mM EGTA, and 1% Triton-X-100. Protease, two different phosphatase inhibitor solutions, and PMSF were added freshly each time. The 10X MSD Tris Wash buffer consisted of 500 mM Tris, pH 7.5, 1.5 M NaCl, and 0.2% Tween-20 and was diluted with deionized water to make a 1X solution. MSD Blocker A was made up of bovine serum albumin in Tris wash buffer and was kept at 4 °C for no longer than 1 wk. the 4X MSD Read buffer T was made by diluting in deionized water to make a 1X stock solution.
The analysis of phosphoproteins was performed according to the instructions of each multispot assay by Meso Scale Discovery. Initially, the amount of protein to add per well was determined by testing 5 µg, 10 µg, and 20 µg protein lysate. Reproducibility between experiments and between wells was analyzed to determine one amount of protein to use for each phosphoprotein. We used 5 µg of protein lysate/well for STAT5 and ERK; 10 µg for Akt, p38, and JNK; and 20 µg for GSK3β.
Briefly, MSD plates were first blocked using 25 µL/well with MSD Blocker A. The plates were shaken at 320 rpm for 1 h at room temperature. Lysates were thawed and diluted in complete lysis buffer accordingly.
The plates were washed four times in MSD Tris wash buffer. Twenty-five microliters per well of the lysate was added to the washed plate. The plates were incubated for either 1 h or 3 h at room temperature at 320 rpm according to the manufacturer’s recommendations (1 h: Akt, GSK3β, STAT5; 3 h: ERK, p38, JNK). Afterward, the plates were washed four times with MSD Tris Wash buffer. This was followed by adding 25 µL/well of the respective diluted detection antibody, and plates were incubated for 1 h at room temperature shaken at 320 rpm. Again, plates were washed four times with MSD Tris wash buffer, and 150 µL/well of MSD Read buffer T was added, avoiding introducing any bubbles. The plates were immediately read on a SECTOR Imager 6000 plate reader.
The amount of total protein phosphorylated was expressed as percentage phosphoprotein using the formula % phosphoprotein = 100 × (2× phosphoprotein signal)/(phosphoprotein signal + total protein signal) after subtraction of the background signal. Please note that the numerator is 2× the phosphoprotein signal because the phosphorylated species is captured by both the phosphoprotein-specific and the phosphorylation state-independent (total) antibodies. The 100% control is the sum of phosphoprotein signal plus total protein signal.
Akt1-PH-GFP Localization
RBL-2H3 cells (4 × 10⁴/well) were seeded into a 24-well dish on coverslips. The next day, cells were transiently transfected using a standard protocol with 1 µg Akt1-PH-GFP and 3 µL lipofectamine 2000/well. After 20 h posttransfection, cells were treated with JADO compounds, reference compound, or vehicle (DMSO) for 1 h. Cells were washed quickly once with phosphate-buffered saline (PBS), and 4% paraformaldehyde was added to each well. Cells were fixed for 15 min and washed three times with PBS. Coverslips were stained with DAPI for 30 min for nucleus identification. After another three PBS washes, coverslips were mounted onto glass slides using Mowiol. Coverslips were imaged using the Zeiss Laser Scanning Confocal Duoscan Microscope (63× oil objective, 1.4, 1 Airy unit). For each experiment, at least 15 images were taken per treatment group. Data from three independent experiments were analyzed.
By analyzing the line intensity plot across each cell in individual confocal sections, the relative change in fluorescence intensity at the plasma membrane was determined. The relative fluorescence intensity ratio was calculated using the formula Imb – Icy/Imb + Icy, where Imb is the amplitude of the fluorescence intensity signal at the plasma membrane and Ic is the averaged fluorescence intensity of the cytosol. 17 The closer the ratio approaches a value of zero, the less difference there is between the cytosolic and the membrane fluorescence intensity, indicating a decrease in plasma membrane localization of Akt1-PH-GFP.
Statistical analysis was done using KaleidaGraph software. Multiple comparisons were performed against DMSO control using analysis of variance (Holm’s method). Statistical significance (p ≤ 0.05) is indicated in the figures by an asterisk (*).
Results
We applied our protocol integrating chemical compounds and computational analysis7,14 to identify bioactive compounds, predict the biological pathways they modulate, and experimentally validate the predictions. This involved concomitantly screening two assays. One is the query screen for the desired activity (i.e., inhibition of mast cell degranulation), and the second (endocytic assay) is the reference screen, which serves to characterize the compounds with respect to endocytosis, cell health, and pathway identification (overview in Fig. 1A ).
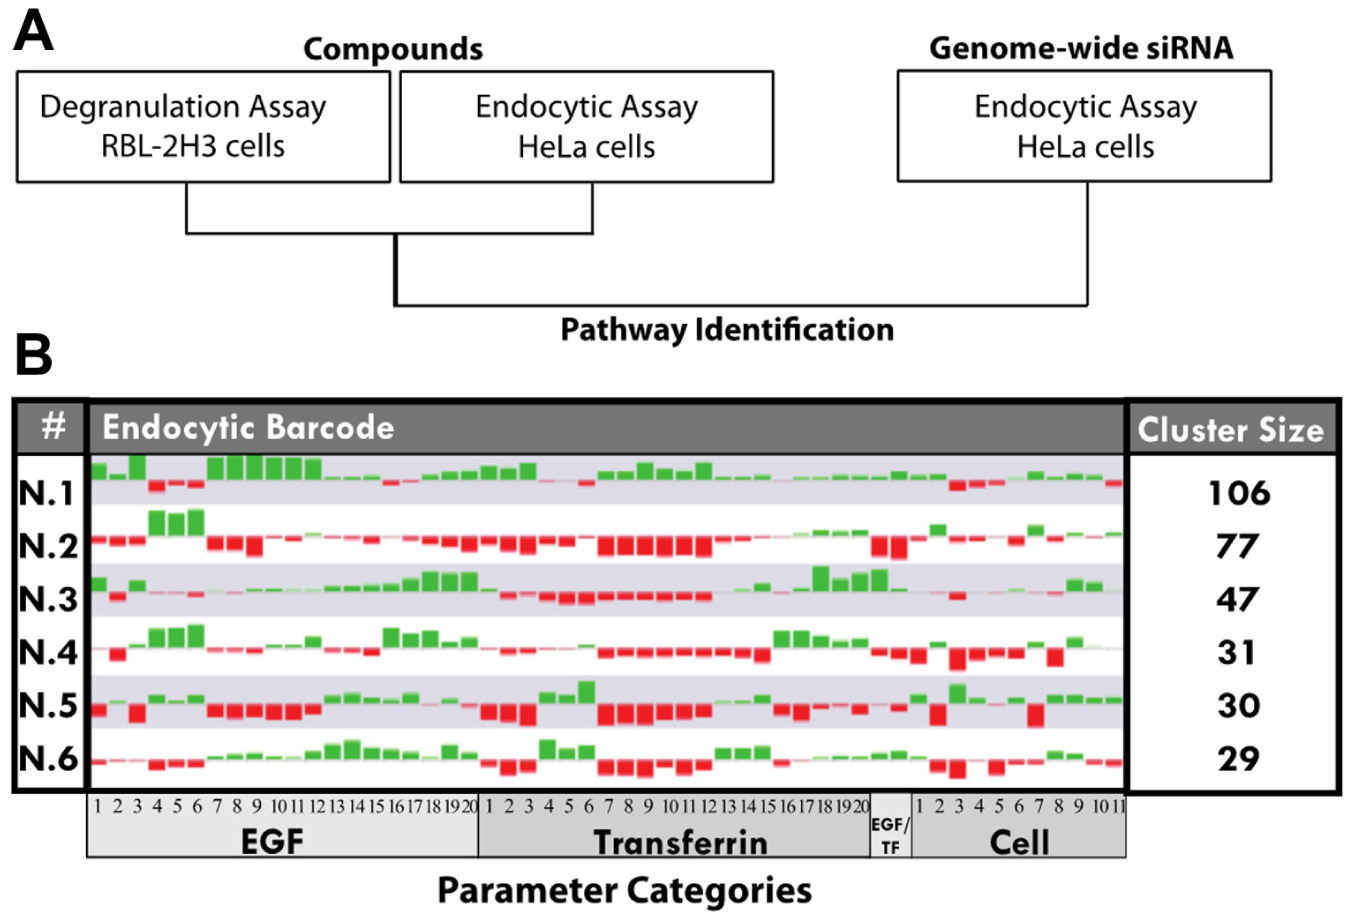
Combinatorial screen analysis to identify hit compounds and pathways. (
To identify compounds inhibiting mast cell degranulation, we established a screening library consisting of about 300 compounds. The screening library comprised a representative and chemically diverse subset of a larger compound library containing mainly amphiphilic compounds designed to modulate membrane-associated processes. The compounds were screened in a well-established RBL-2H3 mast cell model for their effect on degranulation. Briefly, RBL-2H3 cells were sensitized overnight with DNP-HSA and, the following day, stimulated with antigen for 15 min. The cells were then lysed, and β-hexosaminidase was measured as a measure of degranulation. Miltefosine has previously been shown to inhibit mast cell activation in vitro and ex vivo11,12 and therefore was used throughout this study as our internal reference standard compound. Many compounds were found to inhibit degranulation as effectively or better than the reference compound miltefosine (
The same library was also screened in the high-content, image-based Tf and EGF endocytosis assay previously applied to a genome-wide RNAi screen
6
to profile the compounds with respect to endocytosis. As in the RNAi screen, quantitative multiparametric image analysis was applied to measure 42 endocytic parameters including the amount of cargo endocytosed, distribution within the endosomal network, and so forth. Moreover, a set of 11 morphological parameters such as cell area, shape, and nuclear size provided information about the general state of the cell and served to exclude compounds with toxic or lethal effects. Briefly for the endocytosis assay, HeLa cells were plated in 384-well plates and the day after preincubated for 2 h in the presence of the compounds. The controls included DMSO, the EGFR inhibitor (AG1478), and miltefosine. Then, Tf-AF647 (5 µg/mL) and EGF-AF488 (100 ng/mL) were internalized for 10 min, cells were fixed and imaged with an automated spinning disk microscope as described,
6
and the images (15 images per well) were processed. Raw image data can be found in a publicly available database (http://zerial.mpi-cbg.de/page/resources). Initially, multiparametric profiles were generated for each compound and normalized to the median of the DMSO controls. The profiles were visualized as a graph connecting the values of the endocytic parameters classified into four different categories (see
Fig. 1B
;
Overview of results and representative endocytic profiles. (
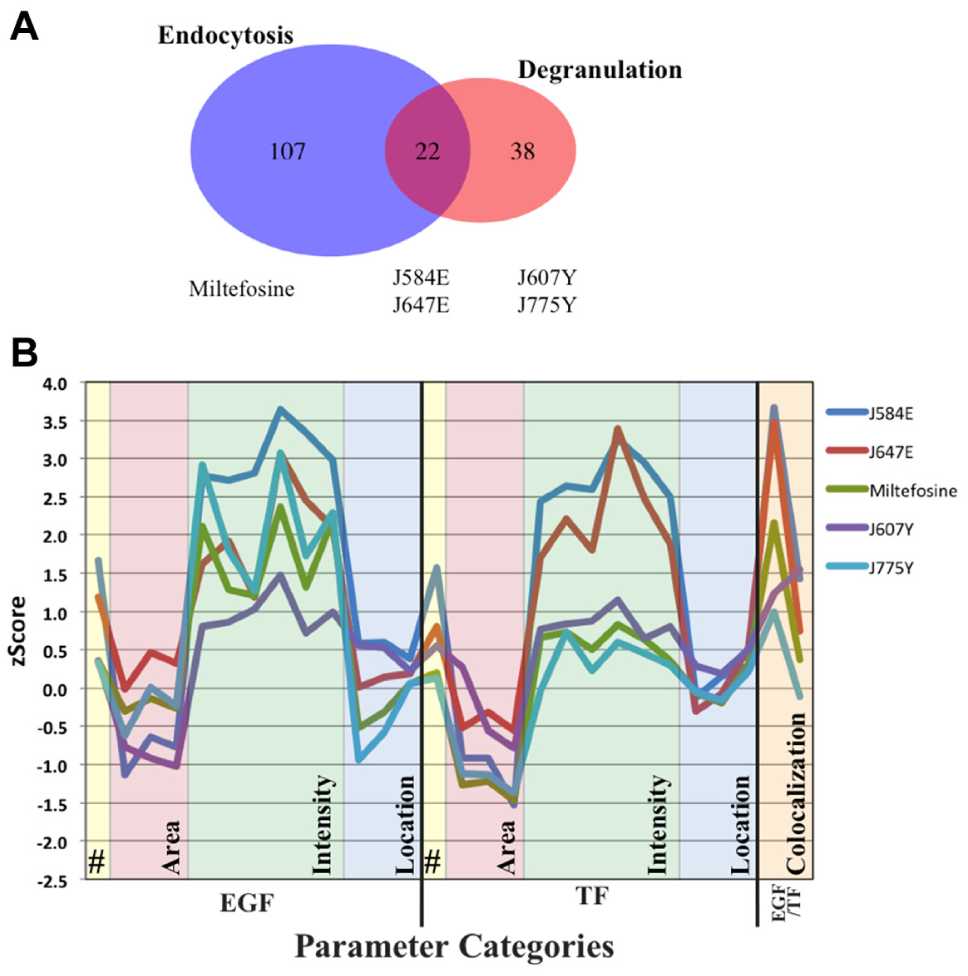
However, the Venn diagram provides only a general comparison of the compounds scoring in the two assays and cannot resolve the effects on specific parameter sets. To classify the compounds on the basis of their activity and specificity in a multiparametric fashion, we grouped the phenotypic profiles of the compounds into classes by performing an unbiased cluster analysis as described previously.
6
Such a clustering method has also been recently used to cluster compounds screened in an image-based assay measuring intracellular killing of Mycobacterium tuberculosis.
7
This placed the compounds into six phenotypic clusters (
Fig. 1B
;
The next step was to predict pathways modulated by these compounds. To this end, we performed a correlation analysis using data from the previous genome-wide RNAi screen (GWS)
6
(data set can be found at http://endosomics.mpi-cbg.de). This is based on the idea that the depletion of a protein of a particular pathway via RNAi can have a similar profile as a compound inhibiting the same particular protein or pathway. In addition, a negative correlation was also used to identify genes because pathways contain both positive and negative regulators. The endocytic profiles of individual compounds were correlated to the GWS data set using correlation thresholds of ±0.7 (
The bioinformatics analysis predicted that the compounds affected a set of common pathways. By examining the components of the pathways, Akt was identified most often (
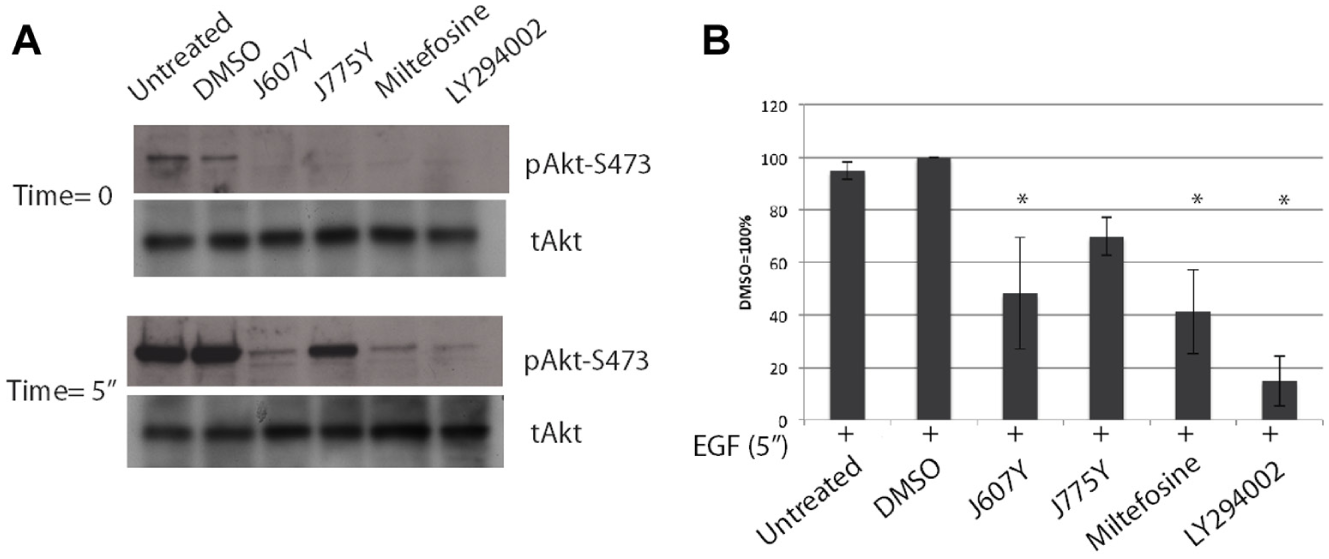
J607Y and J775Y decreased Akt phosphorylation in HeLa cells. HeLa cells were incubated with 25 µM compound for 1 h and stimulated with 100 ng/mL of epidermal growth factor (EGF) for 5 min. Positive control of LY294002 was used at 10 µM. Untreated cells were not stimulated with EGF. (
The next step was to include additional pathways and compounds to challenge our screening analysis and to perform this in the cell line of original interest, RBL-2H3 cells. To do so, we used a sensitive and robust electrochemiluminescence-based immunological assay (see the Methods and Materials section). This enzyme-linked immunosorbent assay–based assay is set up in 96-well plates and is multiplexed so that the phosphorylated and total protein can be measured simultaneously in the same well (see the Methods and Materials section). In the initial phase, when the experimental conditions were established, the 96-well plates were tested using various amounts of lysate, and the amount of lysate found to provide the most reproducible results was then used for further experiments (for additional information, see the Methods and Materials section). Lysates were prepared from RBL-2H3 that had been sensitized overnight with IgE and then stimulated for 15 min with DNP-HSA, like in the degranulation assay. Syk inhibitor, a known inhibitor of degranulation, was used as positive control.
19
We chose to test both phosphorylated proteins that are known degranulation assay components and of which components of the pathway were found in the pathway analysis (ERK, p38, JNK) and others that were neither identified by the pathway analysis nor established degranulation pathway components (STAT5 and GSK3β). As shown in
Figure 4A
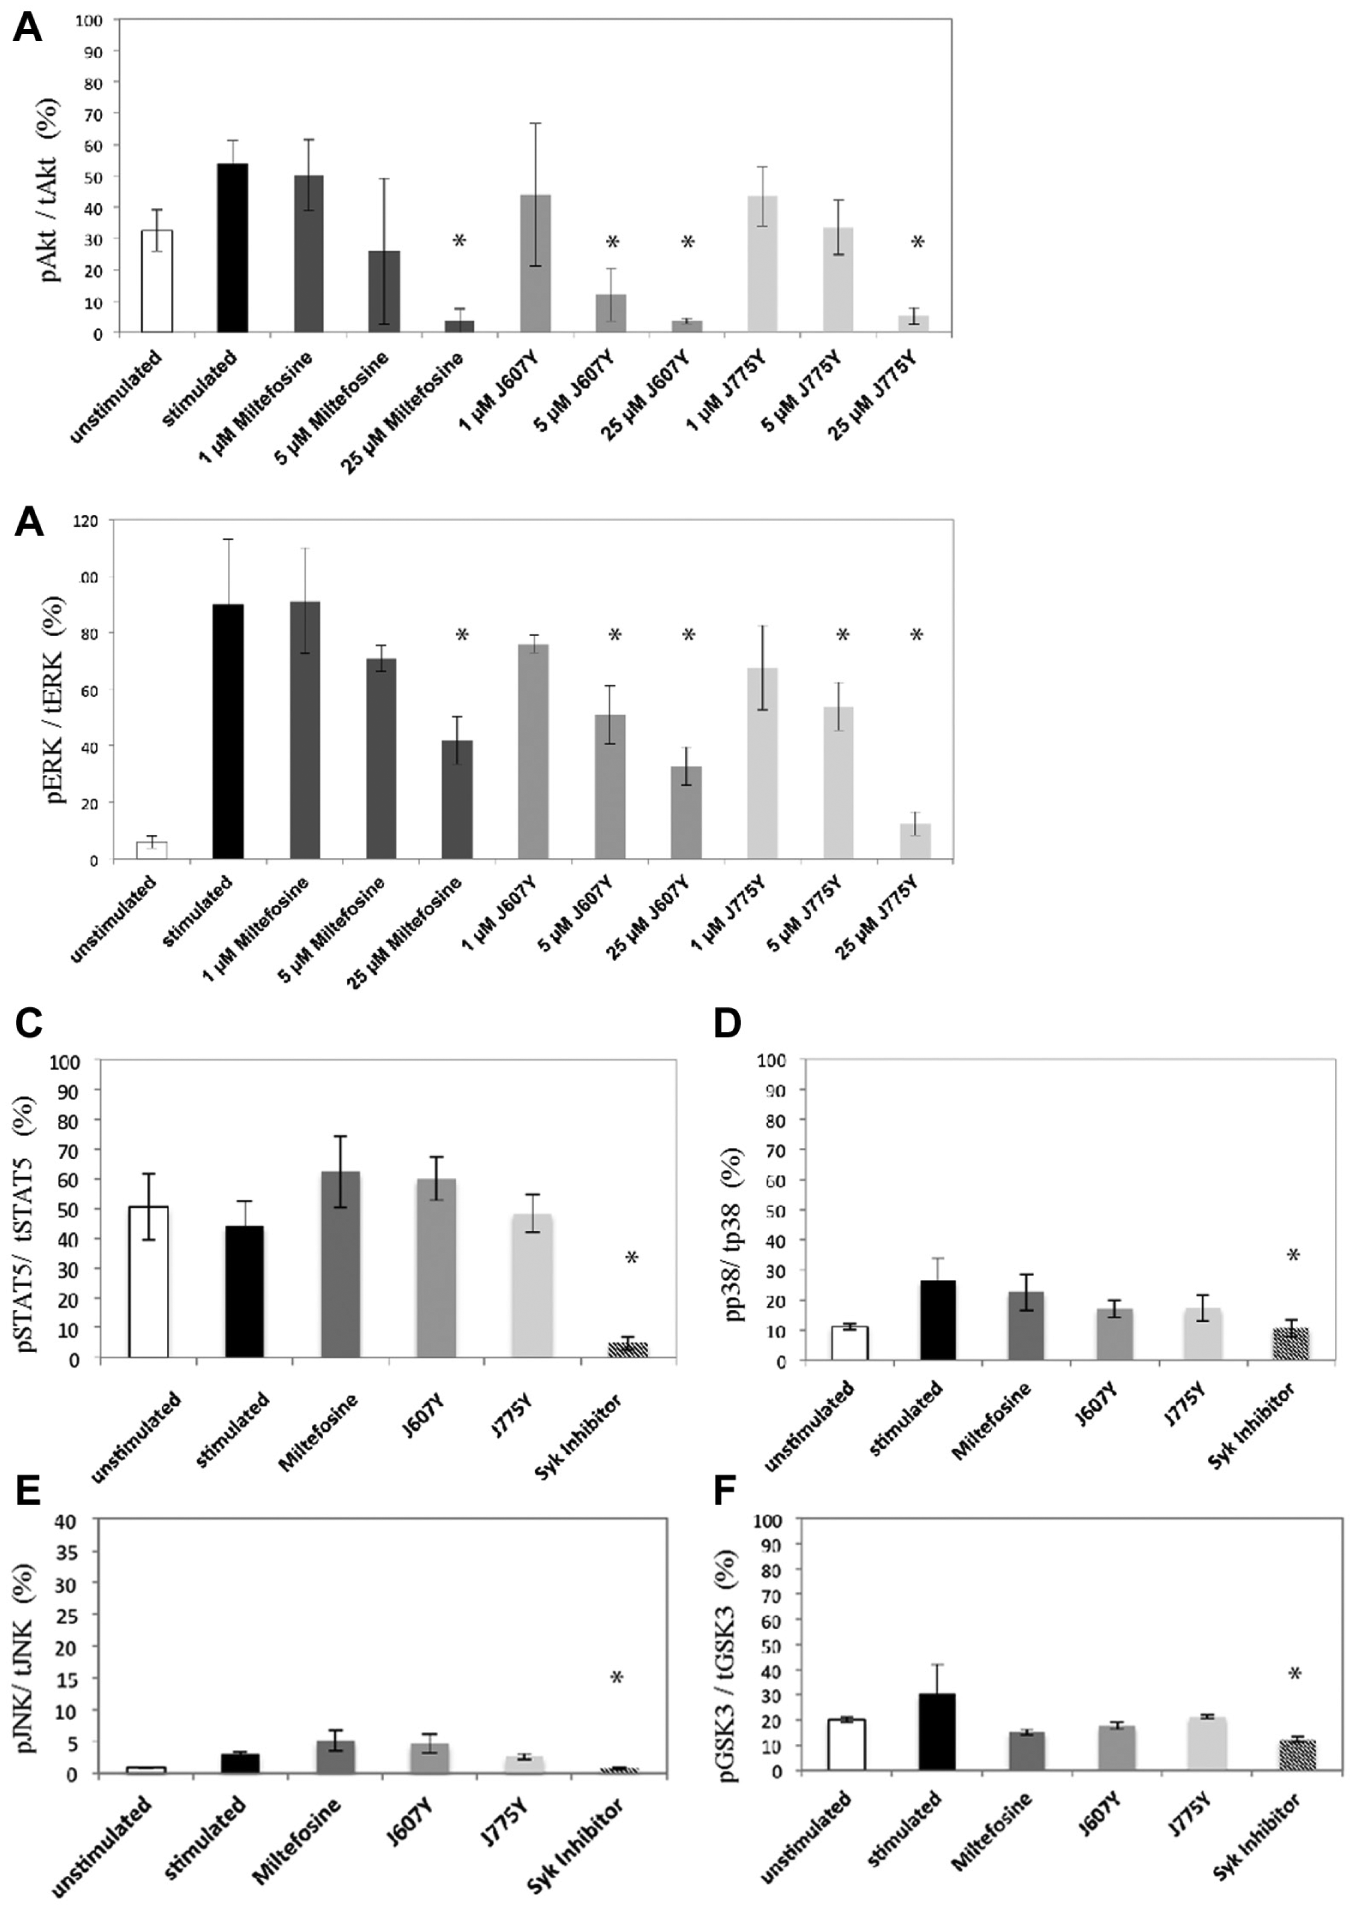
Compounds dose-dependently decreased Akt and ERK phosphorylation in RBL-2H3 cells. RBL-2H3 cells were incubated with 1 µM, 5 µM, or 25 µM compound for 2 h and then stimulated with dinitrophenyl–human serum albumin for 15 min. Cells were lysed, and a specific amount of lysate was tested in the pAkt/tAkt (
One explanation for the decrease in Akt phosphorylation is the reduced recruitment of Akt to the plasma membrane, the site for activation by PI3K. Akt possesses a pleckstrin homology (PH) domain that specifically binds to phosphatidylinositol (3,4)-bisphosphate (PI(3,4)P2) and phosphatidylinositol (3,4,5)-trisphosphate (PI(3,4,5)P3). 21 Upon receptor activation, PI(4)P and PI(4,5)P2 are converted into PI(3,4)P2 and PI(3,4,5)P3, respectively, by phosphatidylinositol 3-kinase (PI3K), and, via its PH domain, Akt is recruited to the plasma membrane where it becomes phosphorylated by PDK1 at Thr308 and an additional kinase, either mTORC2 22 or DNA-PK, 23 at Ser473. Because of its binding specificity, the PH domain of Akt therefore serves as a useful marker for PI(3,4)P2 and PI(3,4,5)P3. 17 RBL-2H3 cells, transiently expressing the Akt1 PH domain fused to GFP, were used to determine the effect of the hit compounds on plasma membrane localization of the Akt1 PH domain. Miltefosine, J607Y, and J775Y were tested at 25 µM, a concentration shown to effectively inhibit Akt phosphorylation in RBL-2H3 cells. The relative fluorescence ratio was calculated for each fluorescent cell from each confocal image as described in the Methods and Materials section. As expected, the reference compound LY294002, a broad PI3K inhibitor preventing generation of PI(3,4,5)P3 and PI(3,4)P2 in the plasma membrane, significantly decreased the fluorescence ratio of Akt1-PH-GFP compared with vehicle (DMSO; Fig. 5A , representative images, and Fig. 5B , quantification). Miltefosine, J607Y, and J775Y significantly decreased the relative fluorescence intensity ratio of Akt1-PH-GFP, with J775Y having the most significant effect. Interestingly, the compounds had a much stronger effect than miltefosine. Overall, this suggests that the level of PI(3,4,5)P3 and PI(3,4)P2 at the plasma membrane is reduced in the presence of the hit compounds, leading to a less efficient recruitment of Akt to the plasma membrane in RBL-2H3 cells.
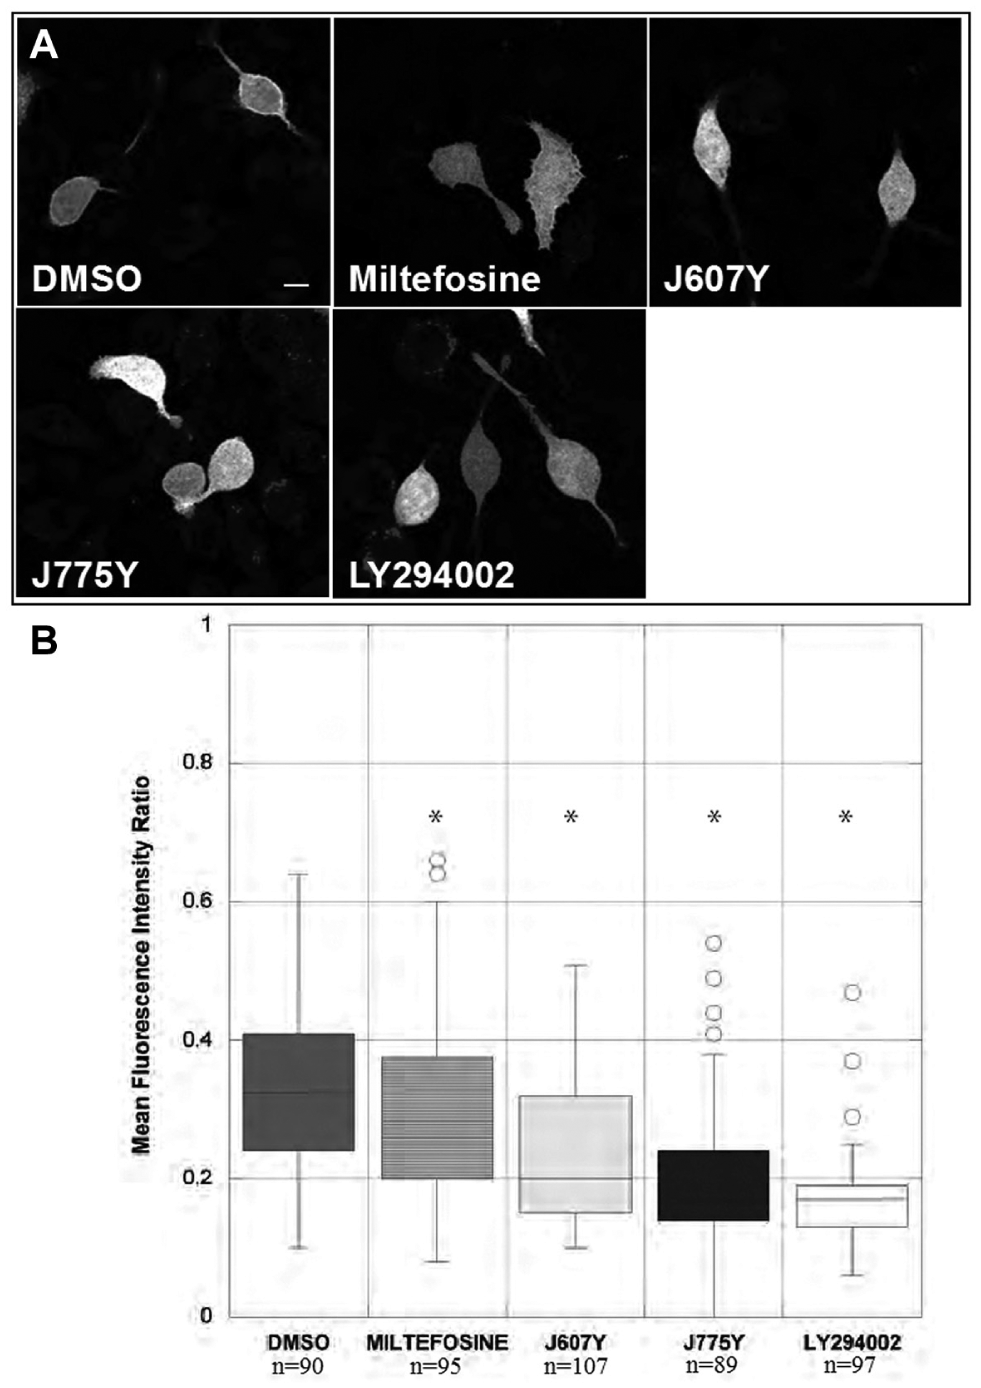
Compounds reduced localization of GFP-Akt1-PH to the membrane in RBL-2H3 cells. RBL-2H3 cells were transiently transfected with GFP-Akt1-PH. Twenty hours after transfection, the cells were treated with 25 µM J607Y, J775Y, or miltefosine and 10 µM LY294002 or DMSO control for 1 h. (
Discussion
The results shown here highlight the strength and advantages of integrating data from multiple screens and resources. Specifically, the power of this method is the ability to predict pathways modulated by small molecules at an early step during the drug discovery process. The screening library was subjected simultaneously to two assays, one for mast cell degranulation and the other (endocytic assay) as reference for computational analysis. Correlation of the endocytic profiles of the compounds with the corresponding ones of the reference genome-wide RNAi data set predicted pathways that were subsequently validated. The method further corroborates the previous approach 14 using a completely disparate library and biological assay. Overall, we identified two novel compounds that inhibited mast cell degranulation, inhibited Akt phosphorylation, and outperformed our internal reference miltefosine. Importantly, the identification could not have been done with the primary screen alone.
In our study, we focused on the Akt pathway because of the known activation of Akt in mast cell degranulation 24 and Akt regulation via lipid rafts. 25 It is important to note that the compounds J607Y and J775Y exerted an inhibitory effect on the recruitment of Akt-PH to the plasma membrane, arguing that the compounds do not act upon Akt itself but on upstream regulatory components. In addition, we cannot rule out an additional target and/or function of these compounds. Nevertheless, we can rule out major endocytic defects with J607Y and J775Y as shown in the endocytic profiles in Figure 2 in comparison to J647E and J584E, which significantly altered both EGF and Tf uptake. Interestingly, J607Y and J775Y exerted only modest effects on endocytosis, excluding the possibility that the target(s) of the compounds may be general endocytic regulators.
The main strength of our approach is the use of the genome-wide RNAi data set in the high-content endocytosis assay to select hit compounds and candidate pathways to study further. Our results suggest that the wealth of information from functional genomics screens 26 should be more often used to gain additional insights into the mode of action of small molecules. Although one of the compounds (J607Y) reduced Akt phosphorylation both in HeLa and RBL-2H3 cells, caution should be taken in the interpretation of results when comparing different cell types and species. Increasing the number of assays, parameters, and cell types will strengthen the resolution and power of the computational approach, providing more accurate predictions and increasing the resolution of the pathway analysis. A second advantage of the image-based cell assays, such as the endocytosis assay, is the ability to assess cell toxicity and morphological changes without the requirement of additional assays. Clearly, the data in vitro alone cannot rule out that there still may be in vivo toxicity.
Overall, our approach highlights the amount of information one can obtain using a multiparametric assay, such as the endocytosis assay, as a reference data set. In the future, by including additional functional genomics screens, the accuracy of the approach can be improved dramatically.
Footnotes
Acknowledgements
We wish to acknowledge Antje Janosch in the MPI-CBG Technology Development Studio for help in data processing. We greatly appreciate the MPI-CBG Light Microscopy Facility. In addition, we thank Dr. Yannis Kalaidzidis for his advice on the clustering and bioinformatics analysis and Dr. Gary Jennings for scientific discussions.
Declaration of Conflicting Interests
The authors declared no potential conflicts of interest with respect to the research, authorship, and/or publication of this article.
Funding
The authors received the following financial support for the research, authorship, and/or publication of this article: JADO Technologies GmbH received a grant from the Sächsische AufbauBank (13270/0).
References
Supplementary Material
Please find the following supplemental material available below.
For Open Access articles published under a Creative Commons License, all supplemental material carries the same license as the article it is associated with.
For non-Open Access articles published, all supplemental material carries a non-exclusive license, and permission requests for re-use of supplemental material or any part of supplemental material shall be sent directly to the copyright owner as specified in the copyright notice associated with the article.