
Abstract
Mast cells are unique hematopoietic cells that are richly distributed in the skin and mucosal surfaces of the respiratory and gastrointestinal tract. They play a key role in allergic inflammation by releasing a cocktail of granular constituents, including histamine, serine proteases, and various eicosanoids and cytokines. As such, a number of drugs target either inhibition of mast cell degranulation or the products of degranulation. To identify potential novel drugs and mechanisms in mast cell biology, assays were developed to identify inhibitors of mast cell degranulation and activation in a phenotypic screen. Due to the challenges associated with obtaining primary mast cells, cord blood–derived mononuclear cells were reproducibly differentiated to mast cells and assays developed to monitor tryptase release and prostaglandin D2 generation. The tryptase assay was particularly sensitive, requiring only 500 cells per data point, which permitted a set of approximately 12,000 compounds to be screened robustly and cost-effectively. Active compounds were tested for concomitant inhibition of prostaglandin D2 generation. This study demonstrates the robustness and effectiveness of this approach in the identification of potential novel compounds and mechanisms targeting mast cell–driven inflammation, to enable innovative drug discovery efforts to be prosecuted.
Introduction
Mast cells are multifunctional hematopoietic cells that play a role in a plethora of diseases and biologies.1,2 The most notable functions of mast cells are in the areas of allergy and anaphylaxis, with a particular focus on IgE-driven effects in atopic diseases such as allergic rhinitis. 3 Atopic patients raise IgE antibodies to certain allergens, which bind to FcϵR1 receptors on mast cells. When exposure to the allergen recurs, the allergen binds to the specific IgE-loaded FcϵR1 receptors on the mast cells, cross-linking the receptors and triggering rapid mast cell degranulation and activation. The process of degranulation and activation occurs in several phases, the first and most rapid being the release of preformed components stored in the mast cell granules, including serine proteases (tryptases, chymases), histamine, and proteoglycans (heparin and chondroitin sulfate). Subsequent to degranulation are the generation of arachidonic acid–derived mediators, such as prostaglandins, thromboxanes, prostacyclins, leukotrienes, and other related molecules. Prostaglandin D2 (PGD2) is produced at very high levels in this phase. Finally, a third phase of chemokine and cytokine synthesis and secretion ensues, generating multiple inflammatory components. 4
The symptomatic results of mast cell degranulation and activation are immediate and striking. Histamine receptor binding causes effects such as bronchoconstriction and vasodilatation, while PGD2 is also a potent bronchoconstrictor and vasodilator but also inhibits platelet aggregation and stimulates neutrophil influx.3,5 Overall, mast cell activation causes a chain of events that can manifest in vasodilation, edema, muscle contraction, coughing and sneezing, itching, vomiting, diarrhea, and bronchoconstriction. In their normal role of protecting the body from parasites and noxious substances, the activity of mast cells is protective, but in an allergic individual, normal day-to-day activities are affected greatly by this persistent allergic response.
Given the highly visible effects of allergic inflammation, a number of drugs have been developed and used extensively to inhibit mast cells, predominantly in allergic rhinitis. Of these, the antihistamines and leukotriene antagonists represent effective drugs that target single mediators, while topical corticosteroids are also used, which inhibit a broader selection of inflammatory pathways. The development of agents that inhibit mast cell degranulation and activation biologies more broadly, in a nonsteroidal manner, represents an opportunity to improve on existing drugs for allergic rhinitis. Spleen tyrosine kinase (Syk) is immediately downstream of FcϵR1 signaling, and in recent years, Syk inhibitors have demonstrated promising utility in this area,6,7 exemplified by R112 8 and related compounds from Rigel Pharmaceuticals (South San Francisco, CA). Separately, antagonists of the Ca2+ release-activated Ca2+ (CRAC) channel are also reported to inhibit both mast cell degranulation and activation.9,10
The purpose of this study was to screen diverse compounds for activity as novel inhibitors of mast cell degranulation and activation, with the intent of identifying new chemical matter and/or biological pathways regulating these processes. Mast cells are considered divergent in various tissue settings,1,11 are difficult to obtain at scale for assay purposes from such tissues, and are rare in blood. A few mast cell–like cell lines have been reported in the literature, including HMC-1 cells12,13 and LAD2 cells,14,15 although culture of these cell lines remains challenging. We chose to use an approach precedented in the literature, using human primary cord blood–derived mononuclear cells,7,8,16–18 culturing and differentiating the cells to a mast cell phenotype over many weeks, before screening compounds for antagonism of both tryptase release as a marker of degranulation and PGD2 synthesis as the major arachidonic acid–derived mediator.
Materials and Methods
Materials
For cell culture medium, RPMI (R0883) was from Sigma (St. Louis, MO), and heat-inactivated fetal bovine serum (FBS) was from Invitrogen (10099141; Carlsbad, CA). L-glutamine, penicillin/streptomycin, MEM nonessential amino acids, gentamicin, and 2-mercaptoethanol were all from GIBCO (Carlsbad, CA). Human stem cell factor (255-sc), interleukin-6 (206-IL), interleukin-10 (217-IL-025), and interleukin-4 (204-IL-050) were all from R&D Systems (Minneapolis, MN). RPMI without phenol red (32404014) was from Invitrogen, Hank’s balanced salt solution (HBSS) was from Sigma (H1387), heparin sodium (1000 IU/mL) was from Leo labs (Princes Risborough, UK), human IgE (401152-100) was from Calbiochem (Darmstadt, Germany), and anti-IgE was from Sigma. The tryptase assay substrate N-acetyl-lys-pro-arg-7-amido-4-trifluoromethyl-coumarin (C6608) was from Sigma. For measurement of PGD2, a fluorescence polarization immunoassay (FPIA) from Caymen Chemical (Ann Arbor, MI) was used (500581). Cord blood–derived mononuclear cells (CBDMC) were from STEMCELL Technologies (CB003F; Vancouver, British Columbia, Canada), where appropriate consent for the use of the samples for research purposes was documented.
Compound Collections and Assay Plate Preparation
Two compound sets were screened, both of which are proprietary to GlaxoSmithKline (Brentford, UK). These were the Cell & Pathway (CPS) sets and the Biofingerprint (BFPS) sets, comprising 12,544 compounds in total in this study. These sets represent a combination of known cellularly active compounds, together with wider drug target chemical space. Compounds were provided as 10-mM stocks in 100% DMSO, diluted as necessary in 100% DMSO, and 100 nL dispensed into polypropylene V-bottom 384-well microtiter assay plates (Greiner Bio-One, Monroe, NC) for assay.
Culture and Characterization of CBDMC
Resurrection
Vials containing approximately 150 million CBDMC were thawed and the contents transferred to 50-mL polypropylene tubes (Costar, Fisher Scientific, Loughborough, UK). Cells were diluted in base CBDMC media (base media of RPMI, 10% FBS, 1:100 dilutions of L-glutamine, penicillin/streptomycin, MEM nonessential amino acid, 10 µg/mL gentamicin, and 10 µM 2-mercaptoethanol) and pelletted at 350 g for 5 min, followed by a second cycle of washing and pelletting. Cells were resuspended in 2 mL of complete CBDMC media (base CBDMC media plus 100 ng/mL human stem cell factor [SCF], 50 ng/mL human interleukin [IL]–6, and 10 ng/mL human IL-10) and transferred to a T175 flask (Costar) containing 100 mL of complete CBDMC media. Flasks were incubated in 37 °C, 5% CO2 tissue culture incubators for 1 week standing up and subsequently lying flat.
Maintenance, characterization, and priming
Once a week, cells were refreshed with media by pelletting at 350 g for 5 min, performing a cell count, and resuspending in fresh complete CBDMC media at 1 × 10⁶ cells per milliliter. At week 8, the maturity of cells was assessed by toluidine staining by removing 0.5 mL (500,000 cells) of the culture into a 1-mL centrifuge tube, pelletting cells, resuspending in 200 µL PBS, and delivering to a polylysine-coated glass slide through a cytofunnel (Thermo Scientific, Waltham, MA) at 350 g for 7 min. Then, 100 µL of toluidine blue solution was placed on the cells for 15 min at room temperature, the slide washed in distilled water to remove excess stain and then cover-slipped, and the cells visualized on a light microscope at 600× magnification. The numbers of cells containing stained granules were counted, with priming of cells initiated when greater than 50% of cells showed such staining. For priming, cells were incubated in complete CBDMC media supplemented with 0.1 µg/mL IgE and 10 ng/mL IL-4 at a density of 0.5 × 10⁶ cells per milliliter for 6 days.
Tryptase Assay
Differentiated and primed CBDMC were pelletted at 350 g for 5 min and resuspended in assay buffer (RPMI without phenol red, 4% FBS, and 2 mM L-glutamine) at a density of 12,500 cells per milliliter. For large screening batches, cells were stirred gently on a magnetic stirrer to maintain homogeneity of the cell suspension. For screening, V-bottom polypropylene 384-well microtiter plates (Greiner Bio-One) were used, with 100 nL of compound dispensed per well at the appropriate concentration in 100% DMSO. Then, 40 µL of cell suspension was added per well (500 cells per well) using a multidrop liquid dispenser (Thermo Scientific) and the plates incubated for 1 h at 37 °C, 5% CO2 in a tissue culture incubator for compound equilibration. Next, 10 µL/well of 5 µg/mL anti-IgE (final concentration 1 µg/mL) was added to cross-link the IgE bound to the IgE receptors on the cells and the plates returned to the 37 °C incubator for 1 h. Plates were then centrifuged at 350 g for 10 min at 4 °C and supernatant removed. Supernatants could be assayed immediately or stored at −70 °C until required. Then, 10 µL/well of supernatant was dispensed into black 384-well microtiter plates (Nunclon, Fisher Scientific) and 10 µL/well of the tryptase substrate N-acetl-lys-pro-arg-7-amido-4trifluoromethyl-coumarin added. Plates were briefly shaken and incubated in the dark at room temperature for 90 min, before measuring well fluorescence using a Victor Wallac plate reader (PerkinElmer, Seer Green, UK), with excitation at 400 nm and emission measured at 505 nm. For screening of compounds at single concentration, raw data were imported into ActivityBase software (ID Business Solutions Ltd, Surrey, UK) to normalize data according to high/low controls (16 replicates of data with and without 1 µg/mL anti-IgE) and determine percent inhibition values. A minimum Z′ of >0 was used to pass or fail individual plates. For screening of compounds in dose-response mode, raw data were imported into ActivityBase software, data were normalized according to plate high/low values (16 replicates of data with and without 1 µg/mL anti-IgE) as percent inhibition, and individual curves were fitted to a four-parameter logistic equation. Appropriate constraints were applied around the minima (0% ± 30% inhibition), maxima (100% ± 30% inhibition), and Hill slope (0.5–5). A minimum Z′ of >0 was applied to pass or fail individual plates.
Prostaglandin D2 Assay
Differentiated and primed CBDMC were pelletted at 350 g for 5 min and resuspended in assay buffer (HBSS, 0.5% FBS) at a density of 250,000 cells per milliliter. For screening, V-bottom polypropylene 384-well microtiter plates (Greiner Bio-One) were used, with 100 nL of compound dispensed per well at the appropriate concentration in 100% DMSO. Then, 40 µL of cell suspension was added per well (10,000 cells per well) using a multidrop liquid dispenser (Thermo Scientific) and the plates incubated for 1 h at 37 °C, 5% CO2 in a tissue culture incubator for compound equilibration. Next, 10 µL/well of 5 µg/mL anti-IgE (final concentration 1 µg/mL) was added to cross-link the IgE bound to the IgE receptors on the cells and the plates returned to the 37 °C incubator for 1 h. Plates were then centrifuged at 350 g for 10 min at 4 °C and supernatant removed. Supernatants could be assayed immediately or stored at −70 °C until required. Then, 10 µL/well of supernatant was dispensed into black 384-well microtiter plates (Nunclon), and 10 µL/well of the PGD2 FPIA (Caymen Chemical) was added. Plates were briefly shaken and incubated in the dark at room temperature for 90 min before measuring well fluorescence on fluorescence polarization settings using an EnVision plate reader (PerkinElmer, Waltham, MA), with excitation at 485 nm and emissions measured at 535 nm. Unknown values were referenced to a PGD2 standard curve in the assay, according to the manufacturer’s instructions, and the derived data then normalized according to plate high/low values (16 replicates of data with and without 1 µg/mL anti-IgE) to generate percent inhibition values. Data were plotted in either GraphPad Prism Software (GraphPad Software, San Diego, CA) or GraFit (Erithacus Software Ltd, Surrey, UK).
Results
Culture and Characterization of CBDMC
Mast cells are derived from CD34+ hematopoietic progenitor cells. 19 The progenitor cells exit the bone marrow and differentiate to mast cells in various tissue compartments, resulting in very few mature mast cells in blood. Furthermore, tissue mast cells are not very numerous and also difficult to isolate. Due to these difficulties in obtaining primary mast cells from human tissue, mast cell–like cells, differentiated from human CBDMC, were used in this study. This approach has been precedented as a means to generate sufficient quantities of such cells to enable meaningful screening approaches. 8
There are a number of challenges associated with performing functional screens in primary cell types, including, but not limited to, supply of sufficient material for screening, sensitivity of detection method, reproducibility of data in such an endogenous system, and donor variability. To generate mast cells from CBDMC requires around 10 weeks of cell culture ( Fig. 1A ). Therefore, CBDMC culture was performed in a highly controlled manner, carefully resurrecting donor vials, refreshing the culture media, maintaining cell density at approximately 1 × 10⁶ cells per milliliter each week, and tracking growth over an 8- to 10-week culture period. Generally a small amount of cell proliferation occurred during the first 4 to 6 weeks of culture, followed by a decrease in cell number in the latter phases, as the cells differentiated into a mast cell phenotype ( Fig. 1B ). From week 8 of culture onwards, CBDMC cultures were investigated for the mast cell phenotype by staining cells with toluidine blue to highlight the appearance of granules, with cultures progressed to priming when >50% of cells exhibited granular staining ( Fig. 1C ). The priming process encompassed the addition of immunoglobulin E (IgE) to the culture, where IgE binds to the Fc epsilon receptor (FcϵR1) on mature mast cells. Such primed mast cells were then competent for degranulation processes to be triggered by cross-linking the FcϵR1 receptors using anti-IgE antibodies, mimicking mast cell responses in vivo. For each cell batch, a pretest assay was performed to ensure that only responsive cell batches proceeded to compound screening, and a typical cell batch generated around 10 million cells (data not shown).
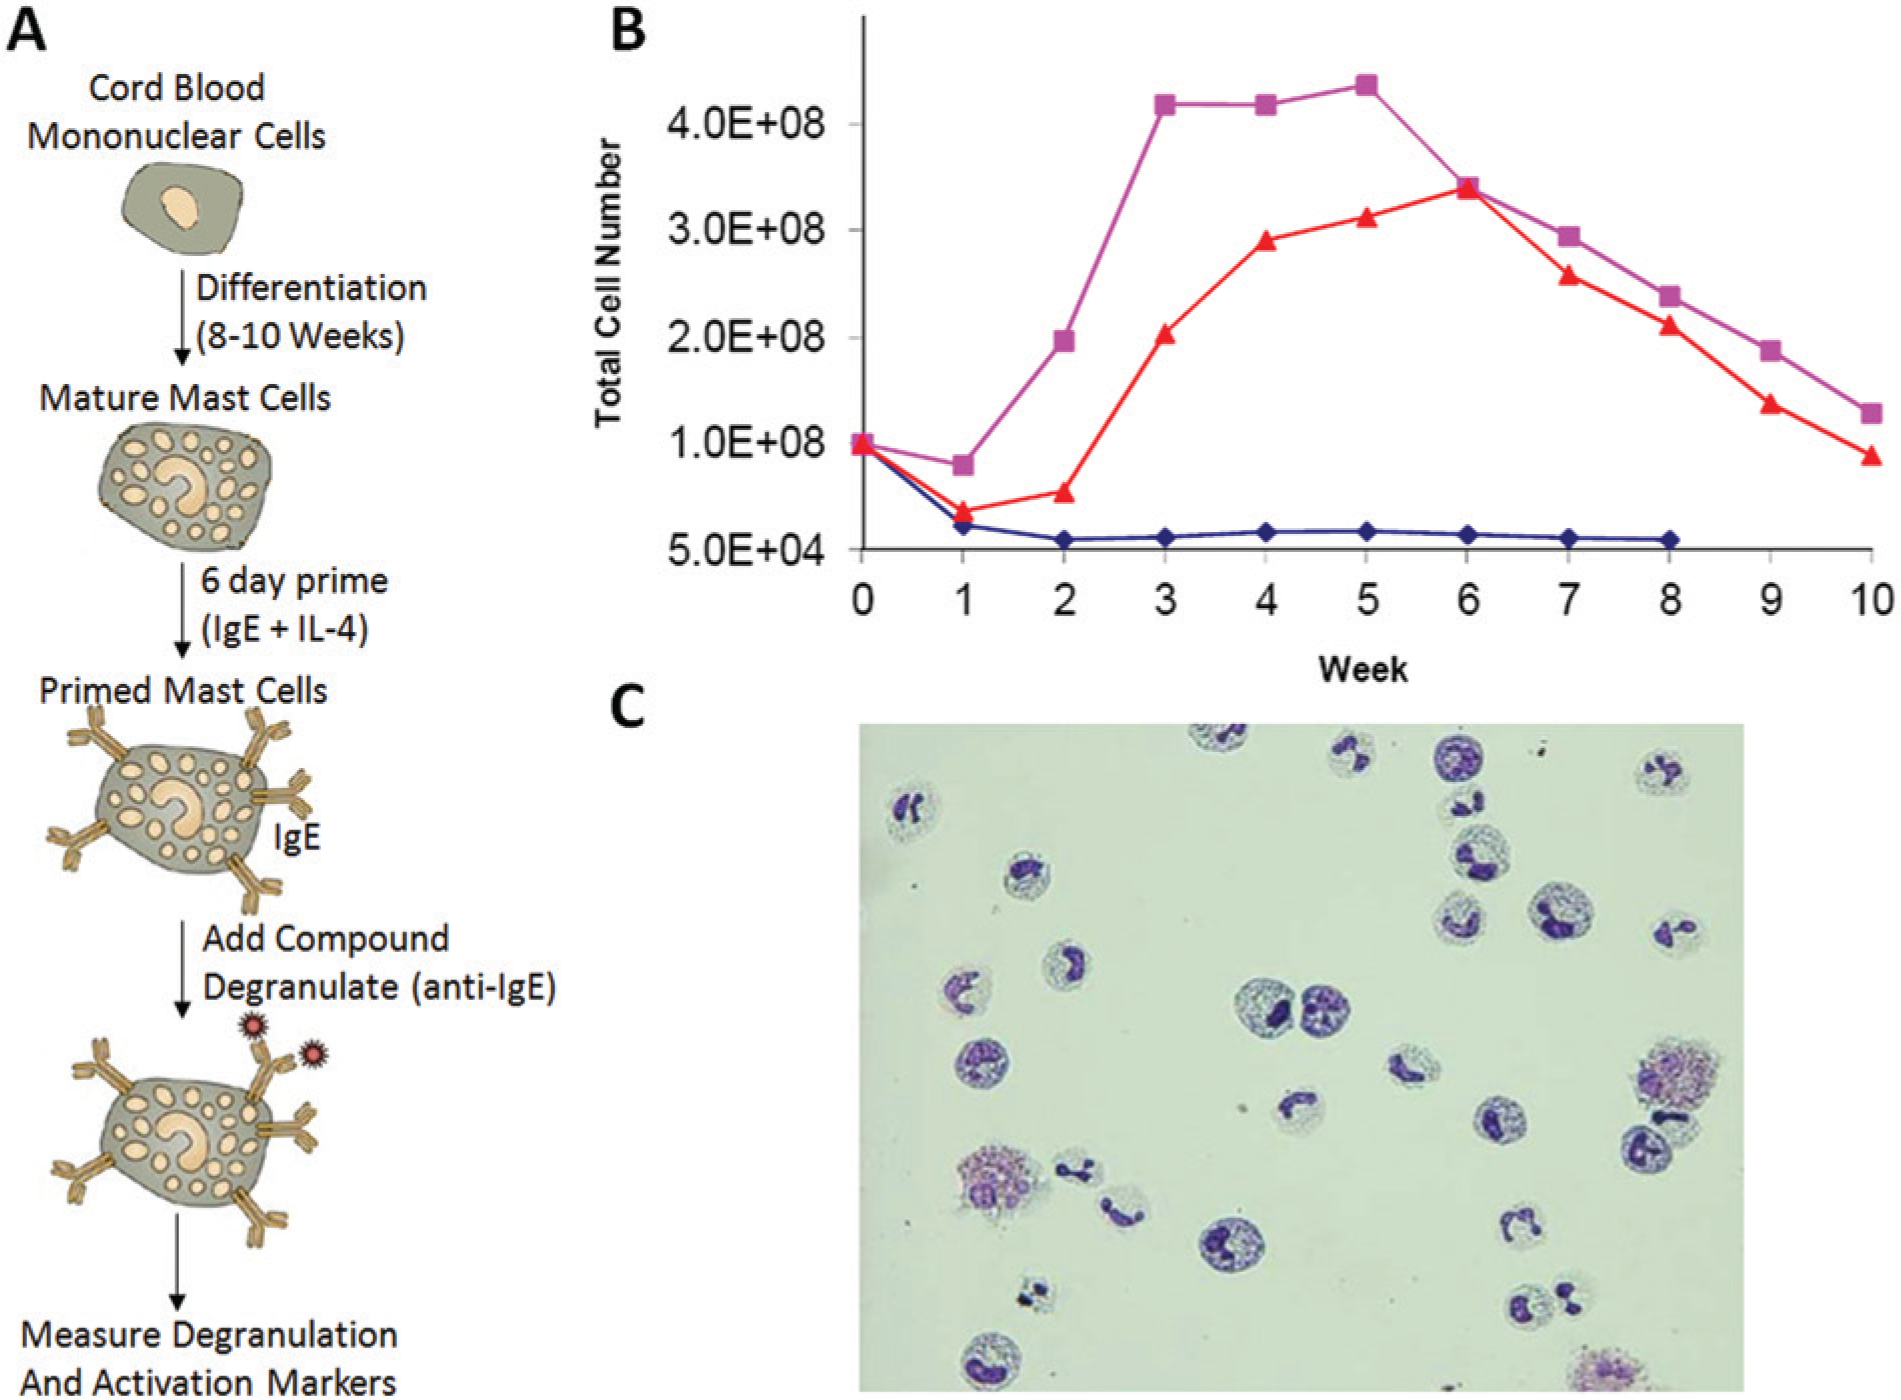
Cord blood–derived mononuclear cell (CBDMC) culture and characterization. (
Development of a Mast Cell Degranulation Tryptase Assay
Upon activation, in this case by anti-IgE cross-linking, mast cells rapidly degranulate, releasing a number of granular components. The most well-known granular component is histamine, but a number of other agents are released, including serotonin, serine proteases such as tryptase, and proteoglycans such as heparin. Histamine is not simple to measure in a screening environment, as it requires derivatization to improve antibody binding for enzyme-linked immunosorbent assay (ELISA)–type assay sensitivity. The tryptase serine protease, the major secreted protein from mast cells 20 and amenable to simple assay formats, was therefore selected as a marker of mast cell degranulation. A commercial substrate Ac-KPR-AFC (N-acetyl-lys-pro-arg 7-amino-4-trifluoromethylcoumarin) was used, where upon hydrolysis by tryptase, liberated 7-amino-4-trifluoromethylcoumarin (AFC) was monitored in a fluorescent plate reader.
The tryptase assay was developed in a 384-well plate format. Varying the CBDMC-derived mast cell density demonstrated that high fluorescent signals were generated upon anti-IgE cross-linking in the 250 to 2000 cells per well range (
Fig. 2A
). Higher cell densities, particularly 2000 cells/well, resulted in higher background fluorescence at low [anti-IgE], and a lack of fluorescence proportionality with cell number at high [anti-IgE], presumably due to assay optical interference and reader saturation, respectively, as dilution of the media led to a progressive reduction in both background and maximal fluorescence (data not shown). Five hundred cells per well were selected for further assay development, as this cell density yielded an acceptable signal window in response to anti-IgE cross-linking, was not saturating the plate reader, and would maximize data generated per cell batch while maintaining acceptable assay quality. Given the average cell batch yield from a single vial of 10 million cells and accounting for wastage within the ultimate screening campaign, approximately 15,000 tryptase data points could be generated from a single CBDMC vial. The time course of the tryptase assay component was also investigated. No significant differences in fluorescence signal were observed between the 1- and 2-h incubation (
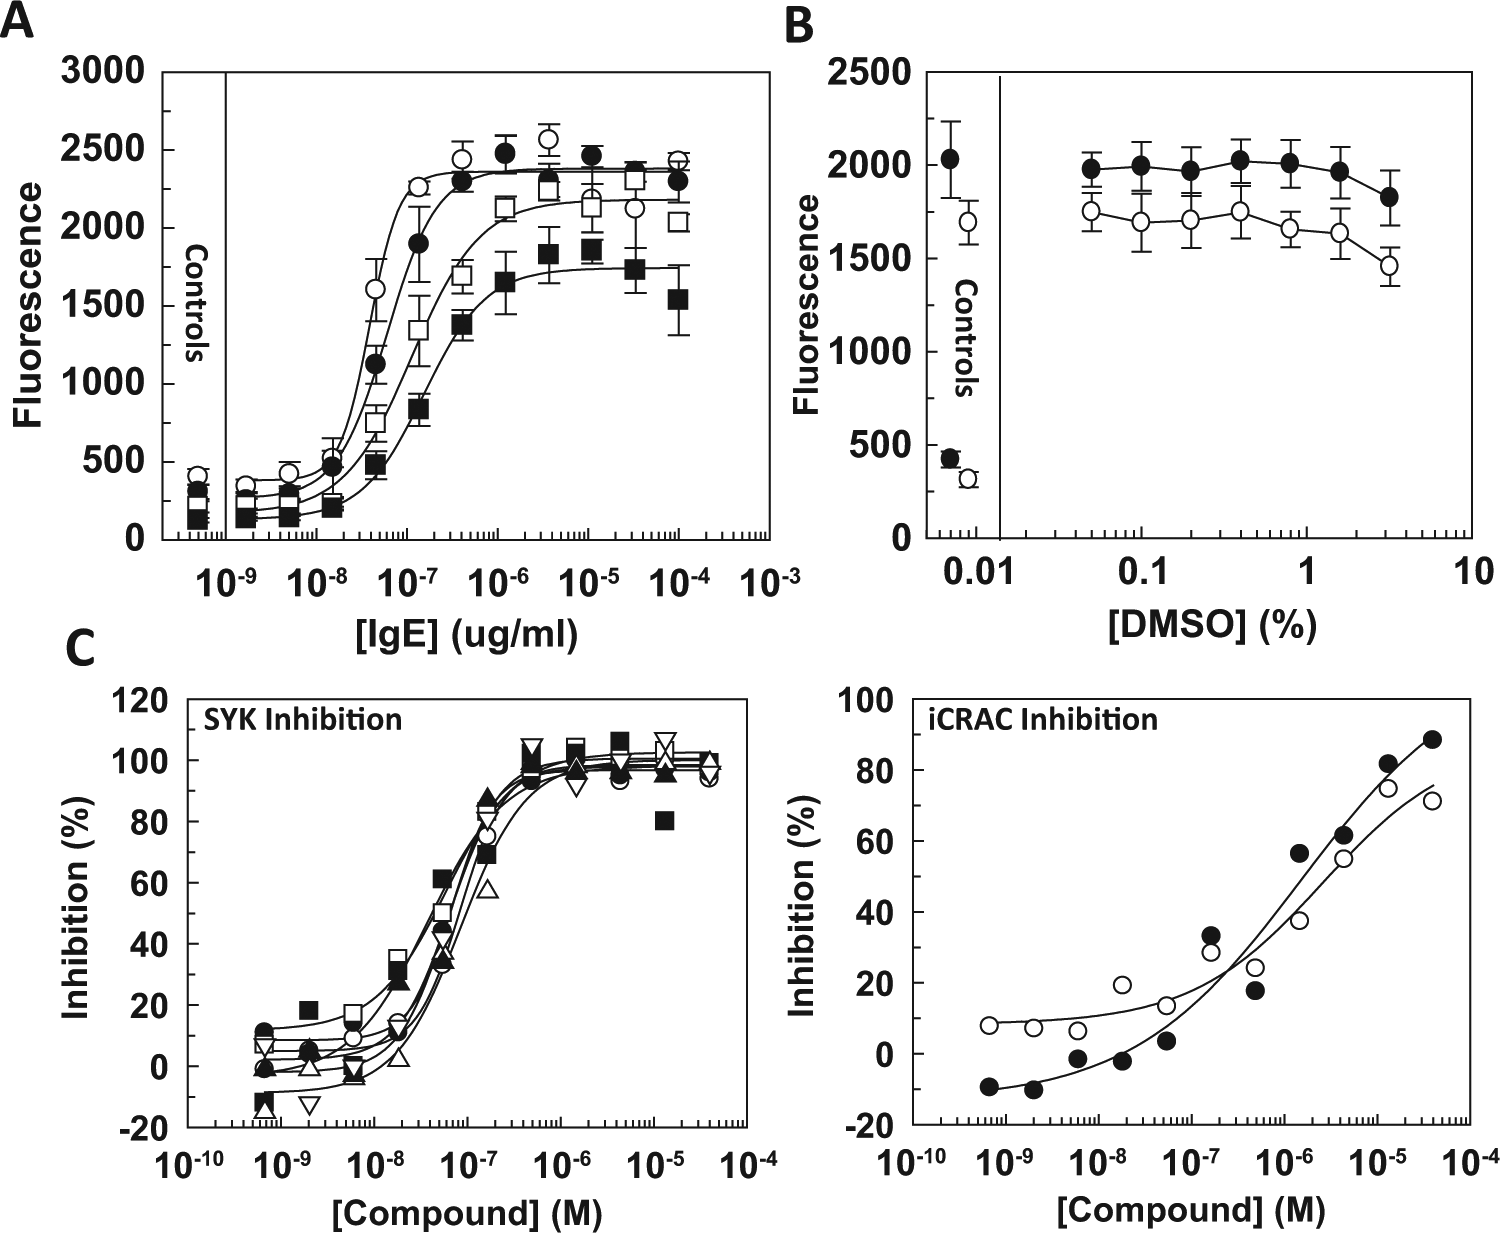
Cord blood–derived mononuclear cell (CBDMC) tryptase assay development. (
The assay was investigated further, first for tolerance to DMSO as the solvent in which test compounds were dissolved and second for sensitivity to tool compound antagonists. A titration of DMSO demonstrated high tolerance to this solvent ( Fig. 2B ), with a modest decrease in signal only evident at the highest DMSO concentrations tested of 1.6% and 3.2%. Screening of test compounds in a single-concentration format would be performed at 0.2% DMSO and dose-response follow-up studies at 0.4% DMSO, concentrations significantly lower than the DMSO-sensitive concentration. Both spleen tyrosine kinase (Syk)6–8 and calcium release–activated calcium channel (CRAC)9,10 antagonists have been demonstrated to inhibit mast cell degranulation in a variety of systems and were therefore tested in the assay. The Syk inhibitor NVP-QAB-2056 inhibited tryptase release ( Fig. 2C ) with a pIC50 of 7.2 ± 0.12 (n = 7), while the iCRAC antagonist Synta-66 22 was also active ( Fig. 2D ), with pIC50 values of 5.8 and 5.6 (n = 2). In addition, acceptable Z′ values were obtained on each of the nine plates, with a Z′ of 0.56 ± 0.19 (mean ± SD; range, 0.18–0.76), and all plates having Z′ > 0. The Syk inhibitor NVP-QAB-205 was subsequently incorporated in each screening experiment as a pharmacological quality control (QC). Over the course of these studies, it was tested in dose-response format on 103 occasions, with a pIC50 of 7.1 ± 0.34 (mean ± SD) recorded (data not shown).
Identifying Hit Compounds in the Mast Cell Degranulation Tryptase Assay by Focused Screening
Two focused compound sets were screened at 10 µM for the ability to inhibit tryptase activity from the differentiated mast cell preparations. The sets comprised known compounds, with demonstrated activity in at least one cellular assay, and targeting a broad range of drug targets. The sets were proprietary to GlaxoSmithKline, totaled 12,544 compounds, and were tested twice in different donors. The first donor performed poorly, with 31 of 40 plates generating Z′ > 0 (a normal dose-response screening Z′ threshold for plate acceptance), only 2 plates achieving Z′ > 0.4 (a normal single-concentration screening Z′ threshold for plate acceptance), and an overall Z′ of 0.11 ± 0.22 (range, –0.54 to 0.49). For this first large screening run of 40 plates, prepared cells were not stirred in the holding vessel prior to plate dispense, due to concerns that such stirring might inadvertently activate degranulation. For the second donor, cells were stirred in the holding vessel, with a significant increase in data quality observed (average Z′ of 0.69 ± 0.07 [range, 0.51–0.87]; all plates Z′ > 0.4). Cell stirring was subsequently incorporated into the assay protocol, and further Z′ plate issues were not encountered during screening (data not shown). Given the cost and effort of the culturing process, the ability to profile large numbers of compounds in dose-response follow-up experiments to eliminate inactive compounds, and one donor generating a full set of screening plates with a Z′ > 0.4, we chose to select hit compounds from plates where Z′ > 0. This enabled a standard process (Z′ > 0.4) to select hit compounds giving >50% inhibition from the second donor screen to be supplemented with further hit compounds from plates where Z′ > 0 in the first donor. Data obtained from the primary screens were normalized to generate a percentage inhibition value. Plotting the data ( Fig. 3A ) demonstrates that the inhibition data were normally distributed and centered around 0% inhibition as expected. When a hit cutoff value of 50% inhibition in at least one replicate was applied, 2122 hits were identified, representing a hit rate of 16.9%. The high hit rate was not unexpected, given the bias of the compound sets towards compound with known activity in cell assays.
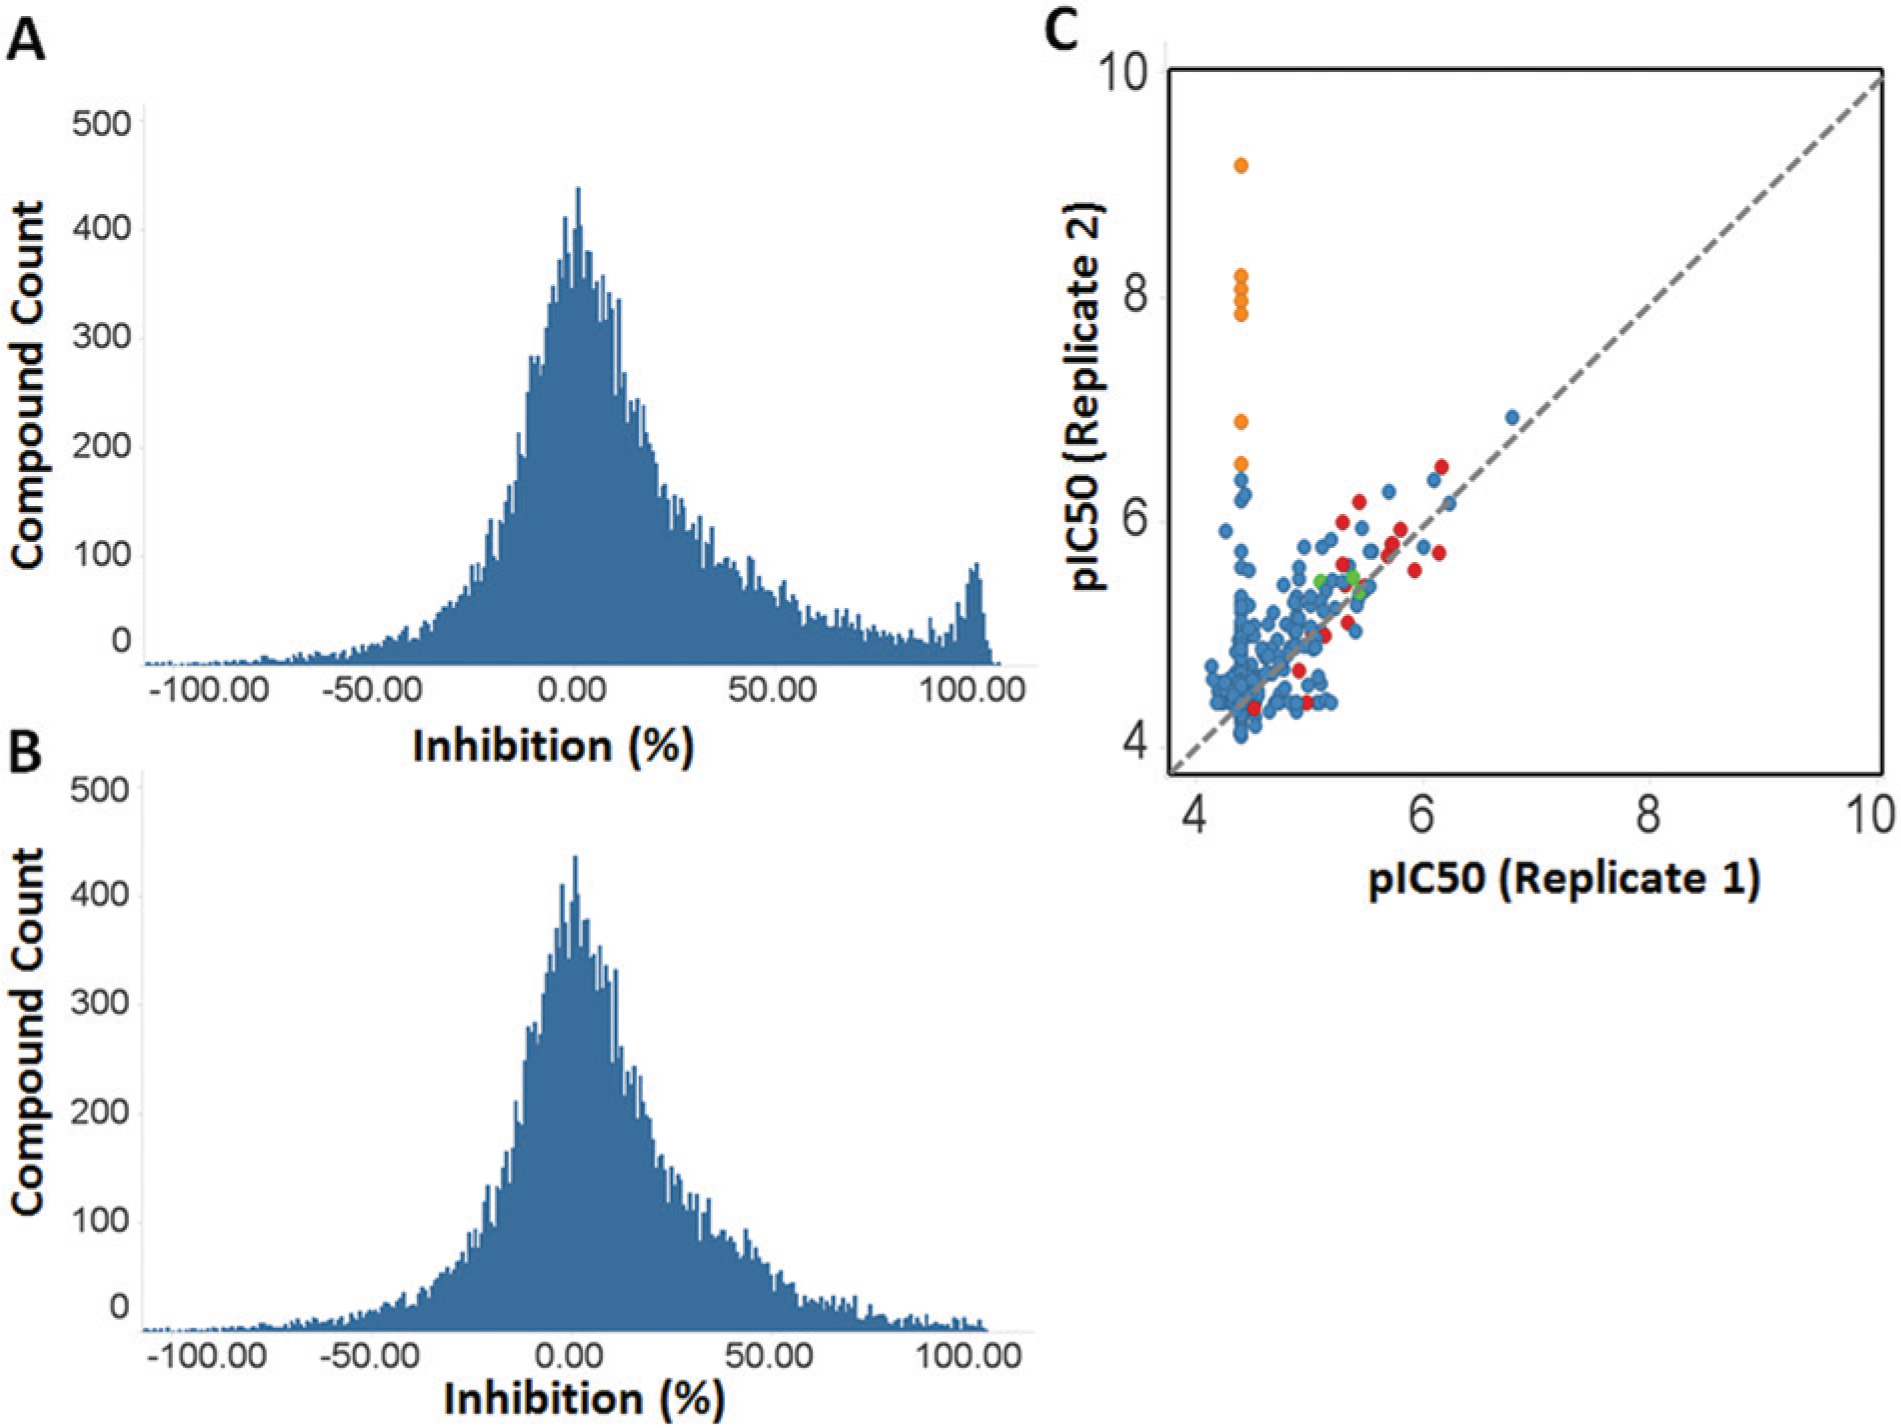
Focused set screening in tryptase assay. (
A key drawback of using cellular assays in hit identification screening is the ability of cytotoxicants to interfere with the assay. This can normally be controlled by applying a cell toxicity assay alongside the primary assay. However, for the tryptase assay, we were unsuccessful in generating a companion cytotoxicity assay, due to the low number of cells used in the tryptase measurement. Testing of some common cytotoxicants in the assay did demonstrate that such compounds were active (data not shown), therefore identifying cytotoxicity as an issue, despite the short incubation time of cells with compounds in the assay. To manage potential cytotoxicity, we therefore compared the data obtained in the tryptase assay with that obtained from screening these focused sets in other cellular assays. In particular, we compared data with an assay that measured CD3/CD28 bead-stimulated peripheral blood mononuclear cell (PBMC) production of interferon γ (IFNγ), a robust assay on which a high-throughput screen had previously been performed (data not shown). Compounds with greater than 90% inhibition activity in the PBMC IFNγ assay were eliminated from further consideration as specific inhibitors of mast cell activation. The advantage of this approach is that it removes general cytotoxicants and also broadly active compounds from further analysis. The results of this analysis are in Figure 3B , which shows that, compared with Figure 3A , the marked peak of compound activity around 100% inhibition has disappeared. In total, 1137 hit compounds remained in the analysis, which represented a 9.1% hit rate, based on total screening set size.
A selection of 499 compounds, based on structural diversity, was taken forward for potency determinations in the tryptase assay. This was performed as 11-point serial dilutions (1 in 3 dilution series) from a top screening concentration of 40 µM in two different donor preparations. The two replicate dose responses compared well ( Fig. 3C ), barring one set of compounds that were active in one donor but not in the other (orange circles in Fig. 3C ). Interestingly, these compounds were β2-adrenoceptor agonists (β2 agonist) and included fenoterol, isoproterenol, terbutaline, and other related molecules. In addition, these discrepant compounds were located on different assay plates in the experiments, suggesting the difference was donor specific. Given the focus on identifying compounds that worked across the donor spectrum, we did not examine this potential donor-specific phenomenon further, although it may be consistent with previous published observations around β2-adrenoceptor density and/or polymorphisms on mast cells.23,24 Compounds with Syk activity were also highlighted (red circles in Fig. 3C ) by querying the data set against the GlaxoSmithKline corporate database for activities more potent than 1 µM (i.e., pIC50 > 6) in cellular Syk-dependent assays, of which 20 compounds were in the set. Overall, of the 998 dose-response tests, 420 generated a pIC50 value. In replicate 1, 6 compounds gave pIC50 values >6 (of which 2 had Syk activity), with 49 compounds giving pIC50 values between 5 and 6 (of which 13 had Syk activity). In replicate 2, 19 compounds gave pIC50 values >6 (of which 7 were β2 agonists and 3 had Syk activity), with 75 compounds having pIC50 values between 5 and 6 (of which 11 had Syk activity). Twenty-nine compounds were selected for further analysis, with three compounds of distinct chemical series of most interest (green circles in Fig. 3C ), based on chemical tractability assessments and querying the GlaxoSmithKline compound screening database for reported activity values across multiple assays.
Development of a Mast Cell Degranulation Prostaglandin D2 Assay
In the second phase of mast cell degranulation and activation is the generation of arachidonic acid mediators, of which PGD2 is produced at very high levels. PGD2 has potent effects in a number of cellular and physiological processes important in allergy, in particular causing bronchoconstriction and vasodilatation.1,25 Hit compounds were desired that inhibited not only mast cell granule release but also this activation step, and therefore an assay to measure PGD2 generation from CBDMC-derived mast cells was developed.
A commercial fluorescent polarization immunoassay (PGD2 FPIA) was used, where the presence of PGD2 in the sample competes with a fluorescently labeled PGD2 for binding to an anti-PGD2 antibody. Binding of the fluorescently labeled PGD2 to the antibody significantly increases the fluorescent polarization of the label, giving the basis of a quantitative assay for sample PGD2 ( Fig. 4A ). Ideally, samples generated for the tryptase assay could have been used in the PGD2 FPIA, thereby linking data, conserving valuable cell preparations, and reducing process time. However, this was impractical for two predominant reasons: matrix incompatibility and assay sensitivity. For matrix compatibility, high background was observed in the tryptase assay buffer. A number of experiments sought to enable a compatible matrix for both the PGD2 FPIA and mast cell degranulation/activation, with ultimately HBSS supplemented with 0.5% FBS identified (data not shown). In terms of assay sensitivity, the PGD2 FPIA required a significantly greater number of cells to generate sufficient PGD2 for measurement in the assay, on the order of 10 to 20,000 cells per well ( Fig. 4B ) compared with the 500 used in the tryptase assay. This is not surprising given that the tryptase assay measures the catalytic activity of the released tryptase protease, thereby introducing a significant amplification step in the assay, while the PGD2 FPIA measures PGD2 levels directly by competitive displacement of labeled PGD2 from an anti-PGD2 antibody.
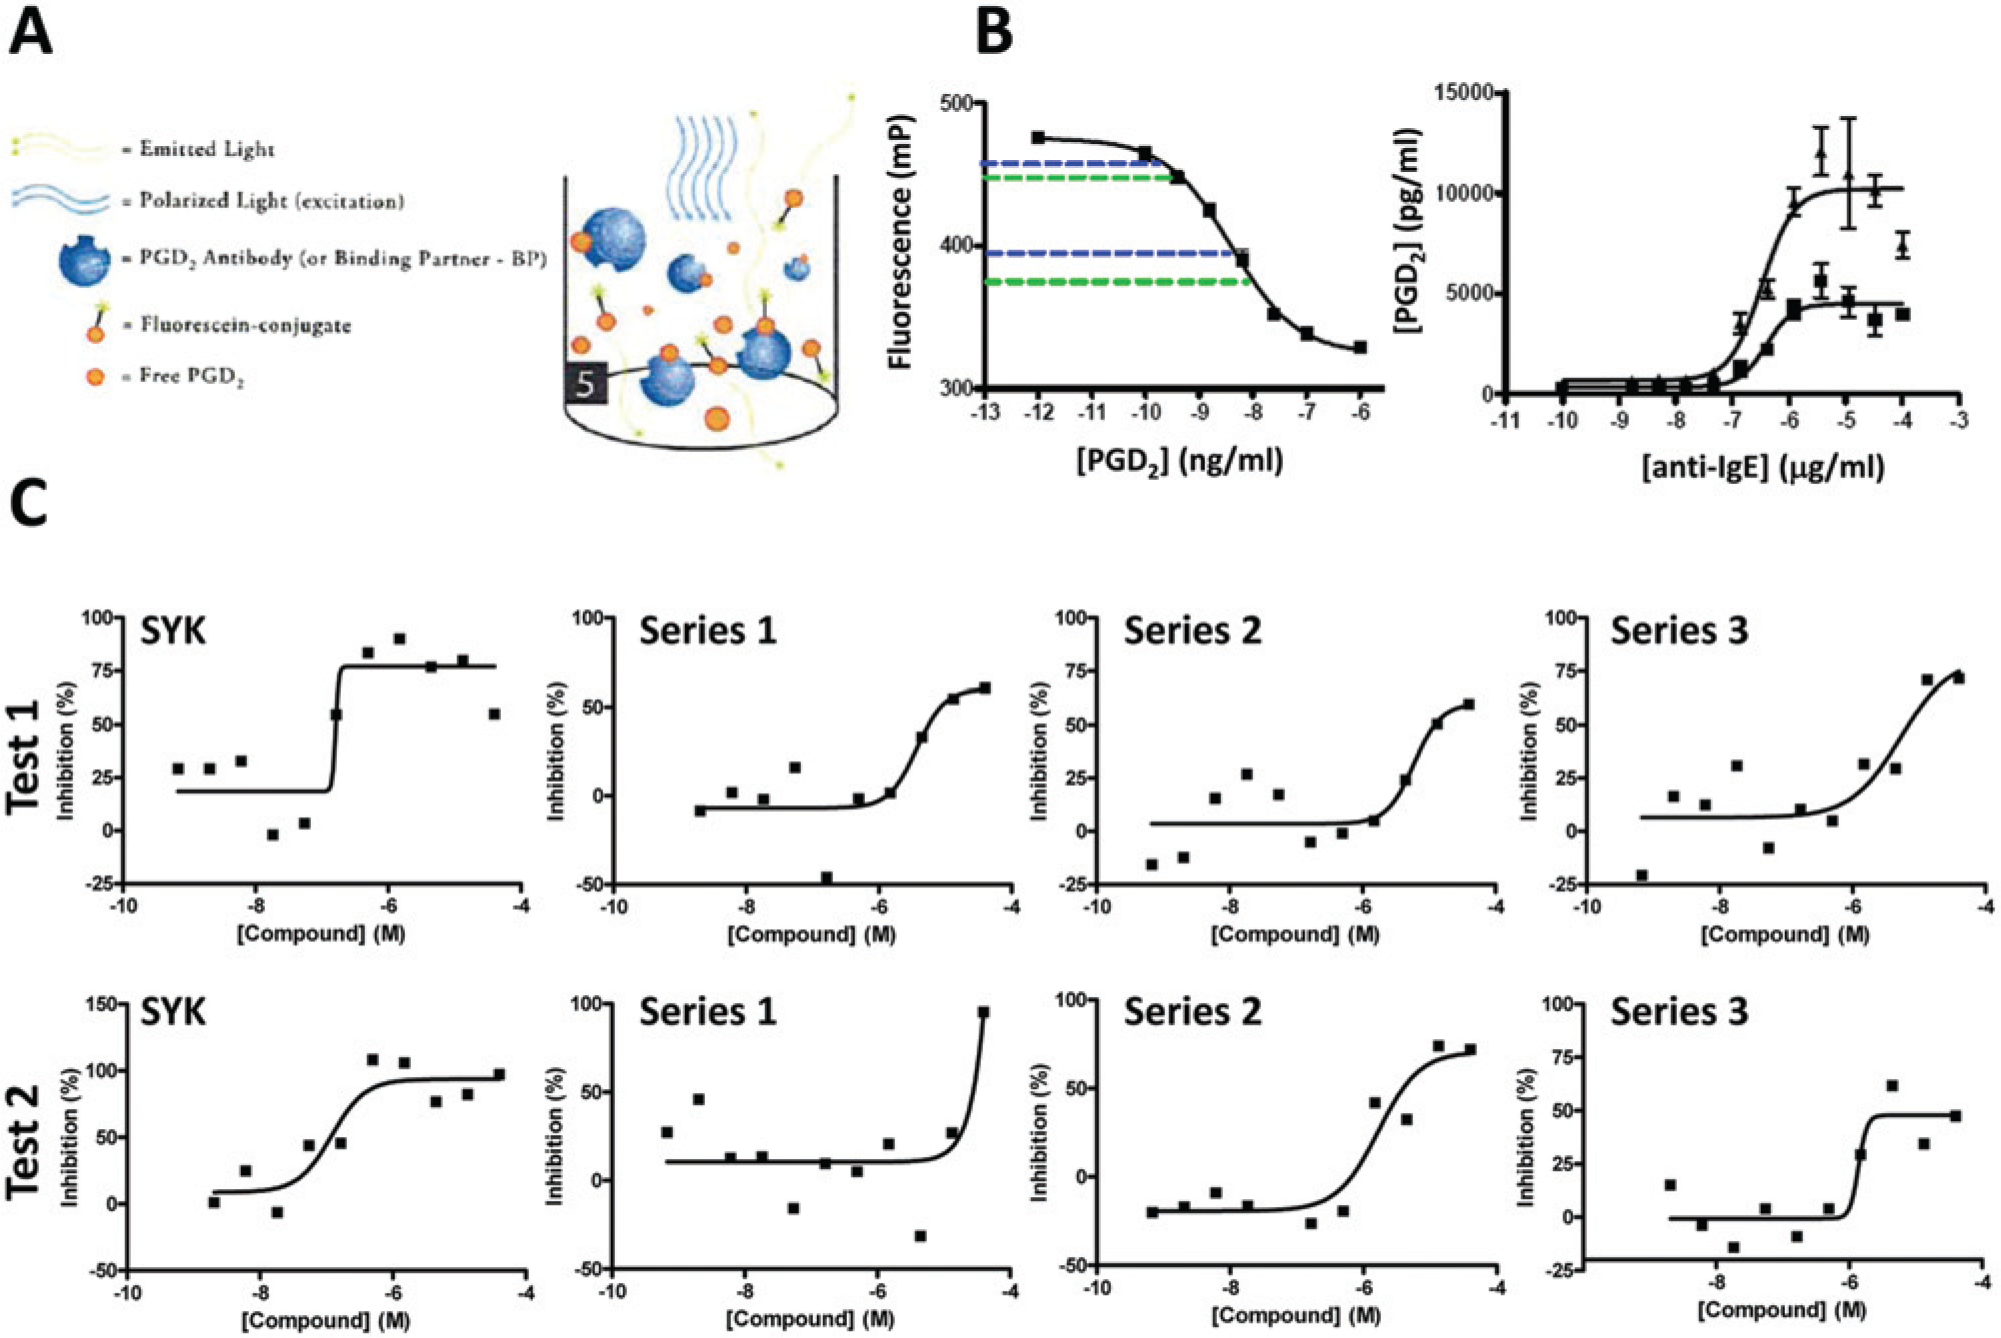
Cord blood–derived mononuclear cells (CBDMC) prostaglandin D2 (PGD2) assay development and screening. (
The increased cell requirements for the PGD2 assay were a significant limitation on potential usage. For example, whereas one vial of CBDMC could ultimately yield sufficient cells to generate approximately 15,000 data points in the tryptase assay, the PGD2 assay required 20-fold more cells, resulting in one vial of CBDMC generating only around 750 data points. In addition, despite the optimized matrix and increased cell number, the data generated in the PGD2 FPIA frequently failed to achieve an acceptable Z′ (Z′ > 0 for IC50 determinations) to permit routine use in compound profiling. This combination of high cell usage and challenging data quality led us to limit use of the PGD2 assay to spot-check compounds that were active in the tryptase assay, to identify those compounds that were apparent dual inhibitors of both tryptase release and PGD2 generation. Twenty-nine active compounds from the tryptase screening were tested in the PGD2 FPIA, of which 17 appeared active (data not shown). Dose-response curves for representatives of three compound clusters of most interest (green circles in Fig. 3C for inhibition of tryptase release), together with the Syk inhibitor NVP-QAB-205, are shown in Figure 4C , which illustrates that these compounds are clearly active in the assay, but data quality only enables a broad IC50 range to be estimated. This variability likely predominates any donor variability.
Collectively, these data demonstrate the identification of several molecules active in both suppressing mast cell tryptase release and PGD2 production, thus possessing the therapeutic opportunity of mast cell stabilization and forming the basis for series chemical optimization.
Preliminary Features of Identified Hit Series
Further understanding of the identified molecules was undertaken by two methods. First, molecules were tested in other phenotypic assays to ascertain a wider cellular activity profile ( Table 1 ). Testing in two highly literature precedented assays (lipopolysaccharide [LPS]–stimulated PBMC secretion of tumor necrosis factor α [TNFα], IL-1β, and IL-6 and CD3/CD28 bead-stimulated PBMC secretion of IFNγ, IL-10, IL-2, IL-5, and TNFα) highlighted activity in the same 1- to 10-µM range as reported for CBDMC tryptase and PGD2 assays against LPS-stimulated PBMC secretion of TNFα (series 1 and 3) and CD3/CD28 bead-stimulated PBMC secretion of IL-10 (series 1 and 2). Second, hit molecule properties were queried against historical data in predominantly discrete molecular target assays to identify a potential hypothesis on the target mechanism of action. Series 1 and 2 had reported activity in several matrix metalloprotease (MMP) assays at micromolar potency. Given this protease activity (albeit metalloprotease and not serine protease), these molecules were tested in a variation of the CBDMC tryptase assay, in which compound was added after CBDMC degranulation. The compounds were inactive (data not shown), and therefore CBDMC activity was not an artifact of tryptase inhibition. Series 3 had reported nanomolar activity in several 5-hydroxytryptamine (5-HT) and dopamine receptor assays. Further investigation is required to determine if these targets represent, or inform, on a target mechanism of action, but these results collectively indicate that identified series are not highly promiscuous in their target or phenotypic assay profile, lending confidence in further optimization of the series.
Noted Assay Activities of Identified Exemplar Series.
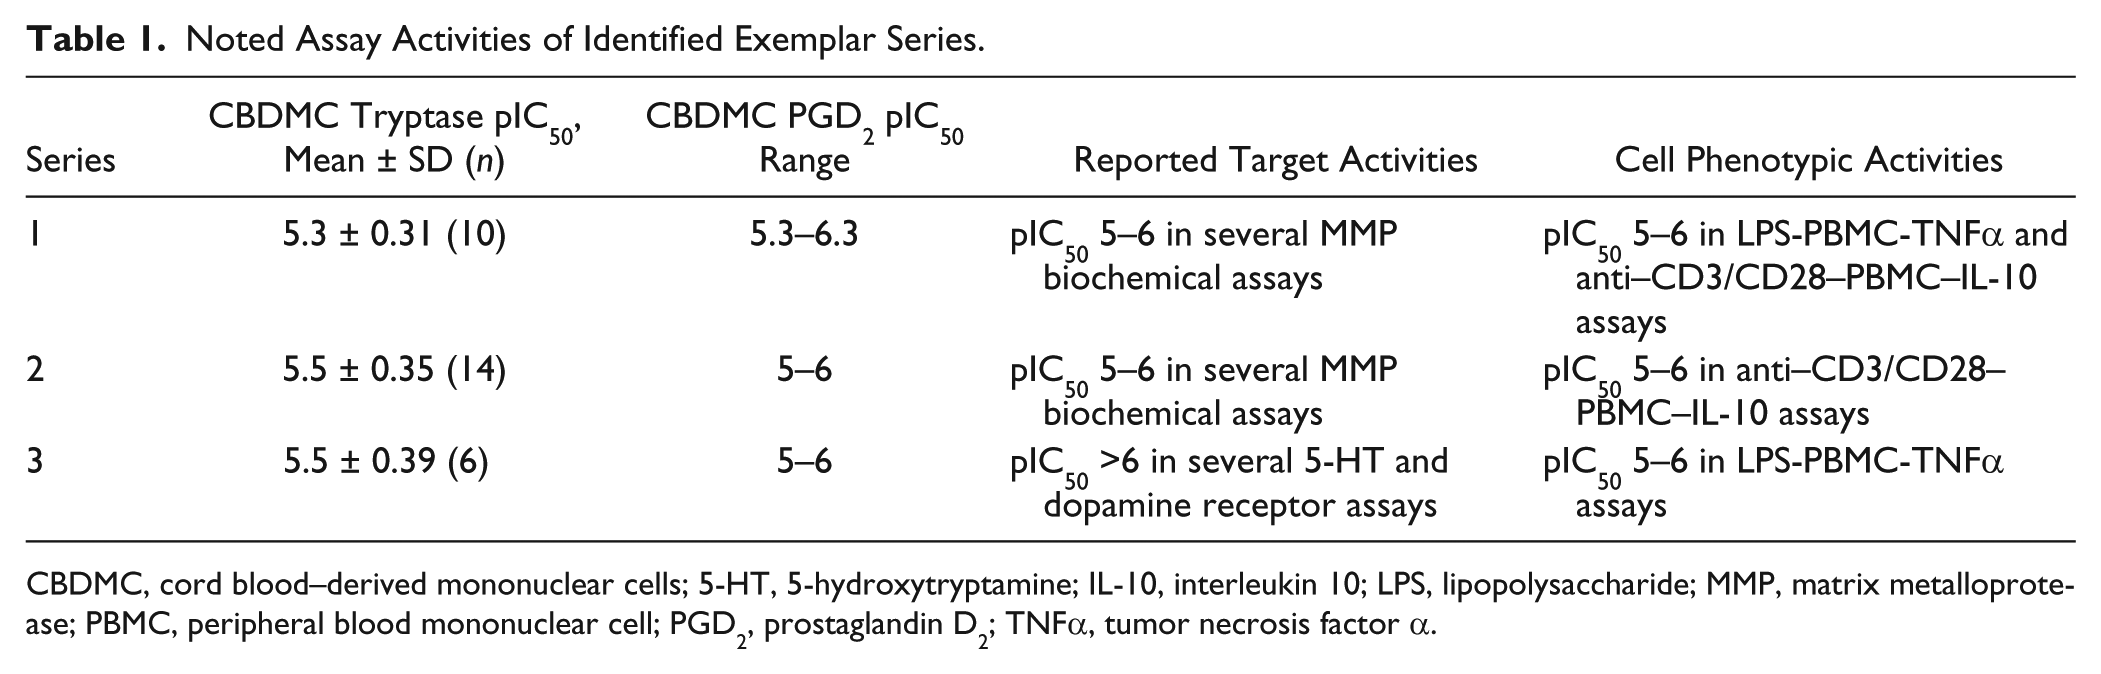
CBDMC, cord blood–derived mononuclear cells; 5-HT, 5-hydroxytryptamine; IL-10, interleukin 10; LPS, lipopolysaccharide; MMP, matrix metalloprotease; PBMC, peripheral blood mononuclear cell; PGD2, prostaglandin D2; TNFα, tumor necrosis factor α.
Discussion
We describe a phenotypic screen for identifying compounds with the ability to inhibit mast cell degranulation and activation. The power of phenotypic screening is primarily dependent on the disease relevance of the sample input, with a concomitant requirement to be able to generate robust and reliable compound screening data. In terms of sample disease relevance, tissue mast cells are considered not only pleiotropic but also difficult to obtain at a scale for hit identification screening purposes. We therefore used a surrogate sample—mast cells differentiated over 8 to 10 weeks from a CBDMC preparation—as precedented in the literature.7,8,16–18 The differentiation and maintenance of the culture were critical to ensure the robustness of the ultimate screening assay and carefully controlled, with cultures maintained at strict densities, regular cell counting and feeding, further QC checks by granule staining for mast cell identification, and batch testing for sensitivity to IgE-driven degranulation before the small-molecule screening assays.
Connected to the mast cell sample was a highly sensitive and robust assay for degranulation, assessed by tryptase release. Pivotal in the assay format was the determination of tryptase activity as a catalytic peptide cleavage assay, which enabled excellent sensitivity, resulting in the usage of only 500 cells per assay well. This enabled one vial of CBDMC to ultimately support the screening of approximately 12,000 assay wells, generating logistical and cost efficiencies. Active compounds could then be progressed to determine if they also inhibited mast cell activation, as assessed by PGD2 generation. While the PGD2 assay used was not as robust and required much higher cell numbers per assay well, it could still be used to spot-check compounds for activity. A number of compounds were identified as inhibitors of both degranulation (tryptase) and activation (PGD2) and merited further studies.
There are opportunities to improve the CBDMC tryptase assay to enable broader diversity screening, potentially up to high-throughput screening capacities of approximately 2 million wells. Specifically, the per well volume of the mast cell tryptase assay was 40 µL, offering clear potential to miniaturize this assay volume, particularly given the short (150 min) nature of the assay, which limits evaporation and hence the likelihood of edge effects. Miniaturizing the assay a further 10-fold may be achievable, which would result in one vial of CBDMC generating around 150,000 data points. Alternate mechanisms of assaying PGD2 generation may also be evaluated in the future, predominantly to improve data quality, as sensitivity improvements may be challenging to achieve. Recent advances in direct analyte detection using RapidFire mass spectrometry in compound profiling activities may be worth pursuing, as demonstrated for prostaglandin E2. 26
Further analysis of active compound series should encompass primarily testing in tissue samples for mast cell activity, 7 to ensure linkage of the biology described here to a scenario closer to the disease. Separately, the identification of putative specific drug targets is often desired to further understand the compound mechanism of action, enable hypotheses on target-based disease and safety biology, and potentially initiate target-based drug discovery programs. Several approaches could be applied in this endeavor, including chemical genomics, 27 transcriptomics, and focused tactics such as kinobeads for kinase drug target biology. 28 In addition, broadening the fingerprint of compound activity by profiling across a range of disease-relevant phenotypic assays can be highly effective, for example, by using the BioMAP platform. 29
In summary, there is a current renaissance in phenotypic screening approaches to identify novel compounds and targets for drug discovery. The mast cell tryptase screen described enables significant diversity screening approaches to be prosecuted, in a time- and cost-efficient manner. This enables the identification of novel mechanisms of inhibition of mast cell degranulation and activation in the disease area of allergic inflammation.
Footnotes
Acknowledgements
We thank members of the Respiratory therapeutic area at GlaxoSmithKline for input and support, as well as Sarah Bonser and Andrew Brown for assistance in data presentation and manuscript preparation.
Declaration of Conflicting Interests
The authors declared no potential conflicts of interest with respect to the research, authorship, and/or publication of this article.
Funding
The authors received no financial support for the research, authorship, and/or publication of this article.
References
Supplementary Material
Please find the following supplemental material available below.
For Open Access articles published under a Creative Commons License, all supplemental material carries the same license as the article it is associated with.
For non-Open Access articles published, all supplemental material carries a non-exclusive license, and permission requests for re-use of supplemental material or any part of supplemental material shall be sent directly to the copyright owner as specified in the copyright notice associated with the article.