
Abstract
A first step in fragment-based drug discovery (FBDD) often entails a fragment-based screen (FBS) to identify fragment “hits.” However, the integration of conflicting results from orthogonal screens remains a challenge. Here we present a meta-analysis of 35 fragment-based campaigns at Novartis, which employed a generic 1400-fragment library against diverse target families using various biophysical and biochemical techniques. By statistically interrogating the multidimensional FBS data, we sought to investigate three questions: (1) What makes a fragment amenable for FBS? (2) How do hits from different fragment screening technologies and target classes compare with each other? (3) What is the best way to pair FBS assay technologies? In doing so, we identified substructures that were privileged for specific target classes, as well as fragments that were privileged for authentic activity against many targets. We also revealed some of the discrepancies between technologies. Finally, we uncovered a simple rule of thumb in screening strategy: when choosing two technologies for a campaign, pairing a biochemical and biophysical screen tends to yield the greatest coverage of authentic hits.
Introduction
Fragment-based drug discovery (FBDD) is a proven method in the arsenal of modern drug discovery that aims to identify therapeutically useful chemical matter from a nearly infinite chemical space. At the heart of the method is the identification of simple chemical building blocks, or fragments, that have an affinity for a target of interest. These simple fragments or features of these fragments are then extended or merged with other fragments or larger molecules, with the aim of accessing compounds with improved affinity. A first step in FBDD often entails a fragment-based screen (FBS) against a target of interest. In many ways, high-throughput screening (HTS) is a progenitor of FBS, and although many lessons learned from HTS can be applied to FBS, there are features of FBS that set it apart and require fresh scrutiny.1–3
As is the case with HTS, particular screening technologies are more amenable to different targets and are also prone to different false positives or negatives. Since this is the case, orthogonal assays are often employed to corroborate putative hits. Although two different technologies are often paired in workflows, either in parallel or in tandem to avoid the biases in any one technology, the relationships such as complementarity, overlap, and orthogonality of assays are not well understood. As a result, when choosing technologies for an FBS campaign, the strategies employed by teams are often a patchwork of available technologies or work flows, as opposed to a best standard of practice.
Methods of utmost relevance to the current study can be divided into biophysical and biochemical assays. For the purpose of this study, we define biochemical assays as monitoring the inhibition or activation of a biochemical event, such as inhibition of an enzyme, and biophysical assays as measuring the binding of a ligand to a protein. Some technologies can be used for both purposes (such as nuclear magnetic resonance [NMR]), but for this study, technologies were used for only one of these types of assays. In the current study, the techniques used for biophysical assays include NMR,
4
surface plasmon resonance (SPR),
5
and protein thermal shift.
6
Technologies employed for biochemical screens, also termed high-concentration screens (HCS),7–9 include fluorescence,9,10 capillary electrophoresis (CE),10,11 and time-resolved fluorescence energy transfer (TR-FRET), to name a few. The technologies used in the current study are summarized in
Here we describe an assessment of Novartis’ latest fragment library, which contains ~1400 fragments. It was intended as a generic library, suitable for multiple biophysical and biochemical technologies. Over the past 3 years, it has been screened against dozens of targets, using diverse technologies (
Methods
Library Design, Data Collection, and Hit Selection
Data collection and hit selection are described in the supplemental material.
Naive Bayesian Modeling
Naive Bayesian (NB) models were built using Pipeline Pilot 8.0.
17
For model building, we only used substructures composed of one or two subunits (as illustrated in
Relating Targets Using Naive Bayes Models
We used the NB models trained on the superset hit selection to correlate targets by the similarity of their active fragments. For this purpose, all informative substructure weights (NPi) were extracted from 16 superset NB models. Perhaps not surprisingly, most substructures were uninformative across all models. The median of the highest weight for each substructure was then calculated (0.154). Because we did not want activity-irrelevant substructures to influence similarity calculations between models, we used this median value to filter substructures in subsequent calculations. That is, to assess the similarity of a pair of targets, we calculated Pearson correlation coefficients for weight vectors of the two corresponding models but limited the vectors to those substructures that achieved a weight >0.154 for at least one of the two targets. Pearson correlation coefficients were then converted into distances between 0 and 2, and the resulting target distance matrix was used as input for multidimensional scaling (MDS, using Sammon’s Non-Linear Mapping provided through the MASS library in R) to get coordinates for the targets in a 2D space. To assess the goodness of fit, the stress was computed and a final stress value of 0.078 was achieved.
Difference Vector for Technologies and Complementary Score between Technologies
To compare specific technologies with each other, we compared NB models derived for a single technology with NB models trained on the superset hit selection. Models were trained with substructures to increase sampling. We derived a complementary score, which reflects how well two technologies compensate for the technology-specific biases inherent in each technology. For the examples in the main text, we focused on a workflow where all hits from primary screens are progressed to subsequent screens. In this scenario, it is desirable to pair a technology that might miss a particular substructure (and thus a fragment or fragment class) with a technology that would find it. Our complementarity score reflects the ability of two technologies, when combined, to identify as many substructures as possible and ranges from 0 (lacking complementarity) to 1 (high complementarity). A detailed derivation of this score is described in the supplemental material.
X-Ray Crystallography, Differential Scanning Fluorimetry, and SPR
Experimental details for X-ray crystallography of Pim-1 and SPR and differential scanning fluorimetry (DSF) control experiments can be found in the supplemental material.
Results and Discussion
Privileged Substructures and Fragments
We first assessed how many fragments were deemed hits as more and more targets are screened (
Fig. 1A
). For comparison, we simulated the number of compounds that would be hits, if the probability of hitting a target was equal for all fragments, while employing the same hit rates found experimentally (see
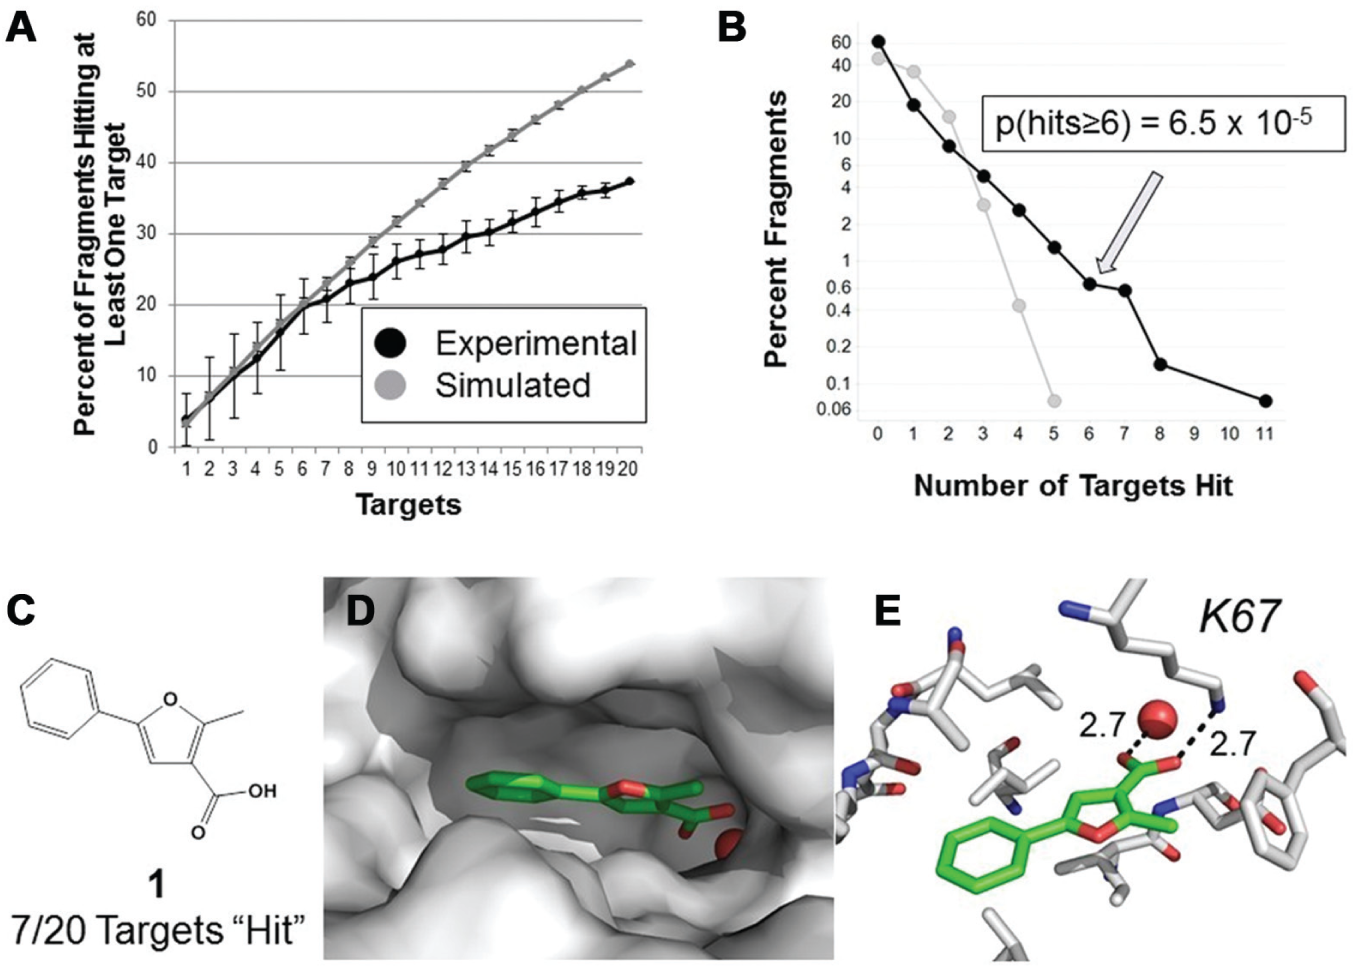
The percentage of fragments that hit at least one target as the total number of screened targets increases (
We next questioned whether there were any salient relationships between physicochemical properties and hit rates of fragments. For this purpose, we divided active fragments into the following categories according to the number of protein targets that they bound to: (1) one target, (2) two targets, (3) three targets, (4) four or five targets, and (5) more than five targets. Cumulative distribution curves (
Although it is tempting to deem the high hit rate fragments “frequent hitters,” which often carries along with it a negative connotation, it should be pointed out that unlike larger compounds, fragments often demonstrate affinity for multiple targets and gain specificity as they are evolved into more complex compounds. An example of this is 7-azaindole, which was evolved into vemurafenib, which targets mutant BRAF as well as AZD5363, which targets PKB.21–23 Furthermore, all of the fragments that were screened were previously subjected to quality control assessments (see
To assess the value of the compounds with hit rates that were higher than expected by chance (≥6 of 20 targets hit), we ascertained how many had been crystallized with targets considered in the meta-analysis. Interestingly, 5 of 20 (25%) of the high hit rate fragments have been crystallized with target proteins included in the meta-analysis, a rate much higher than the other active fragments (1-5 targets hit, 4.6%;
An illustrative example of this is a privileged fragment
We questioned whether there were substructures enriched for specific target classes. Interestingly, when targets were related to each other using NB models built on the superset hit selection, targets belonging to the same protein family tended to cluster together in 2D space ( Fig. 2 ). For example, the serine/threonine kinases cluster is close to the tyrosine kinases. For serine proteases and serine/threonine kinases, activity-relevant substructures that were exclusive to these families (i.e., did not obtain high weights for targets of other families) are displayed.
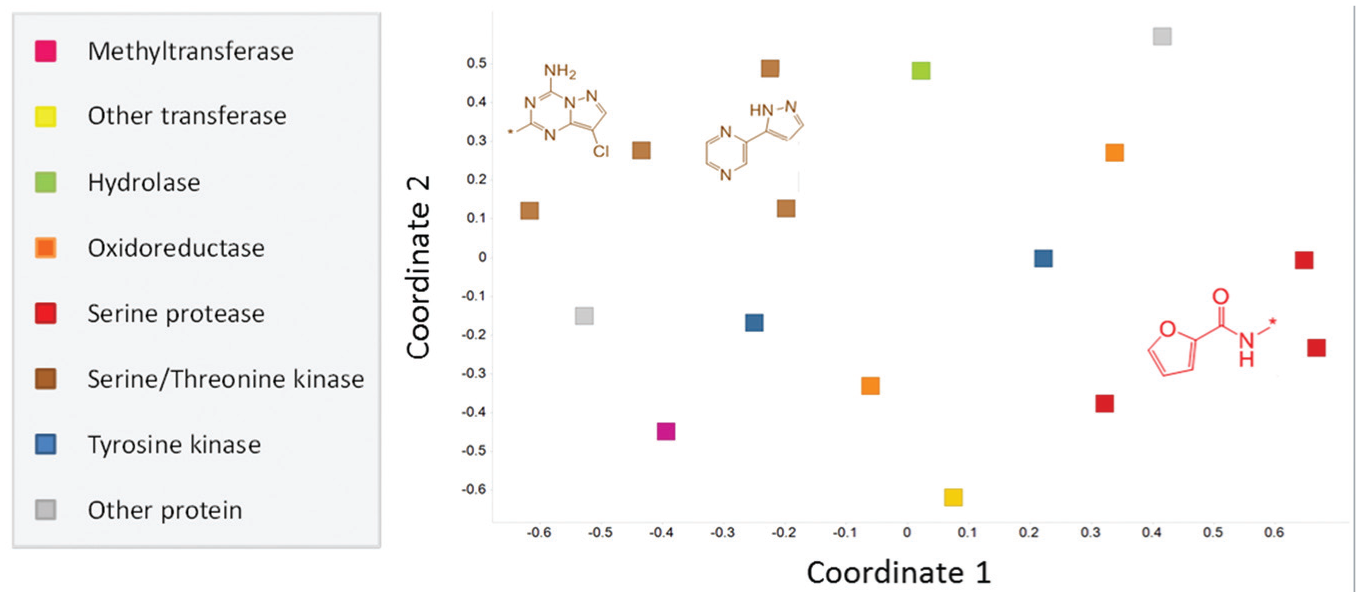
Comparison of target classes based on the chemical matter selected as hits. Naive Bayesian (NB) models were built for each target, based on the active and inactive fragments. The significant feature weights were then extracted and used to derive Pearson correlations between each target model. These correlations were then subjected to multidimensional scaling (MDS) to compare the targets in 2D space. Targets of the same class tend to cluster near each other, revealing that they interact with similar chemical matter. Substructures that were enriched in the actives of two specific target classes but were not enriched in the actives of other target classes are depicted.
In summary, there are fragments that bind more targets than expected by chance—privileged fragments—that may offer valuable starting points for project teams in lead discovery. Furthermore, particular substructures that are enriched in fragments are active against specific target classes.
Physical Properties of Hits versus Nonhits
Often in FBS, a library is screened using one technology, and hits from this screen are confirmed using an orthogonal technology. For example, a primary biochemical screen might be employed, followed by confirmation in NMR, and finally crystallization trials. 7 Alternatively, some groups will use multiple technologies in parallel and integrate results from each technology into a final hit list. 28 This begs one to question how different technologies compare with each other.
As a simple first step, we assessed trends in the physicochemical properties of hits identified by different technologies against various targets, a subset of which are presented in
Figure 3
. This level of resolution allows exploration of discrepancies in properties of hits that may be due to specific technologies or particular targets. It is apparent that while for most technologies, the hit rate increases for higher molecular weight (
Fig. 3A
) and higher AlogP (
Fig. 3B
) fragments, this is not true for every target/technology pair. Also, we see that different techniques have different trends for a given target. For example, NMR tends to identify larger and more hydrophobic compounds for oxidoreductase 2, while hits obtained from TR-FRET are more evenly distributed for both of these properties (a trend that seems to be reversed for hydrolase 1 for these technologies). Different trends for particular technology/target pairs can be seen for other physicochemical properties as well, such as fraction molecular polar surface area (
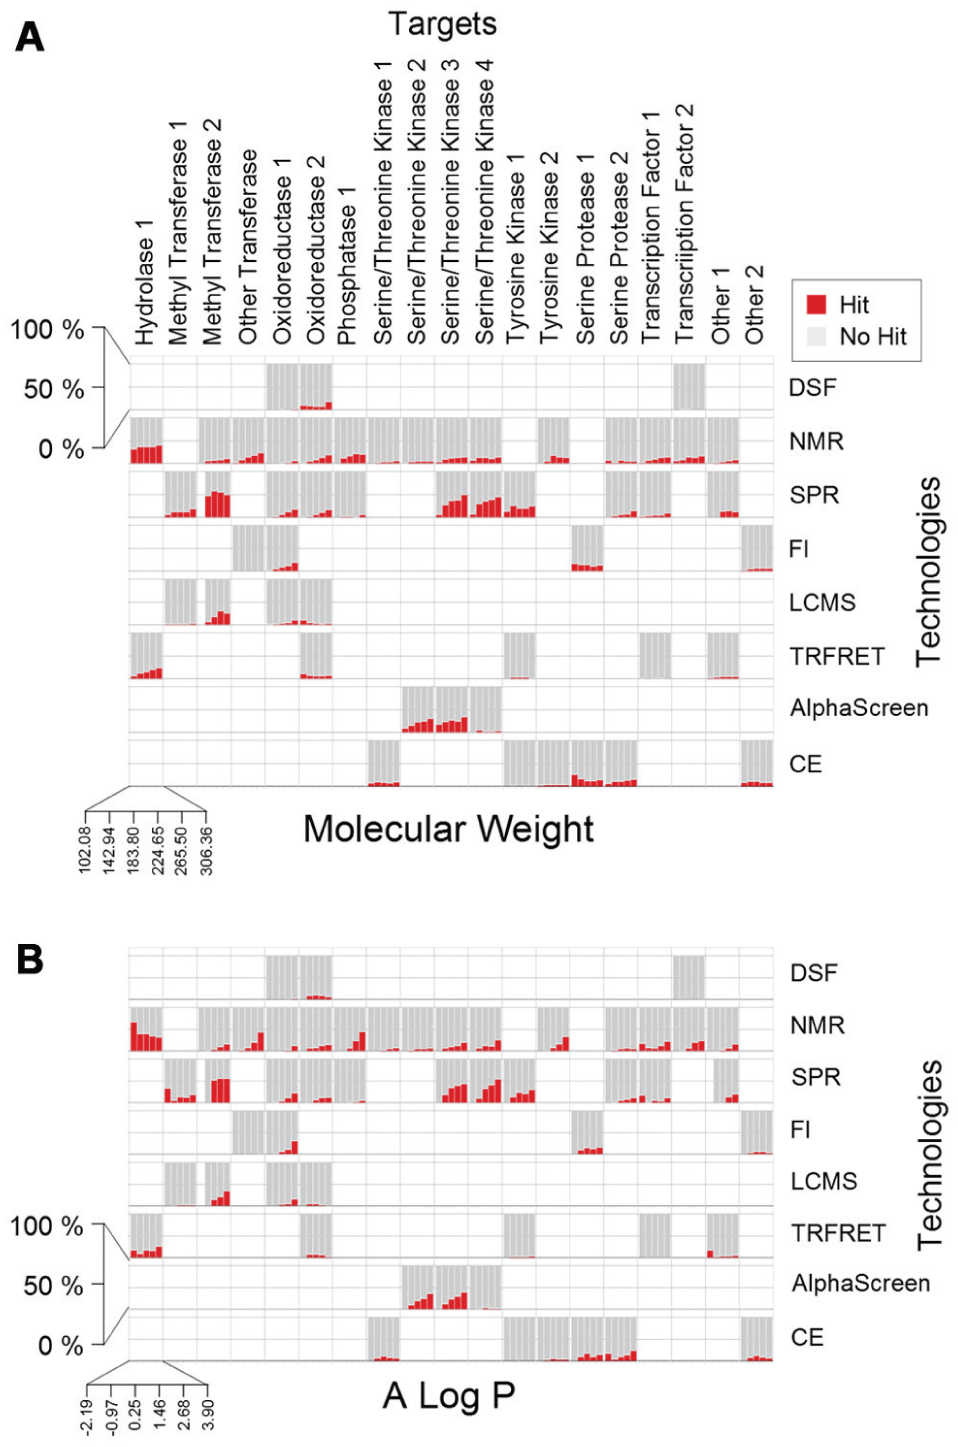
Physicochemical properties of fragment “hits.” The percentage of fragments in each bin that were identified as hits are represented by red bars, while the gray background indicates the percentage of nonhits.
Hit Rates of Different Technologies
Another way of comparing technologies is by assessing the fraction of screens that a compound was classified as a hit. In Figure 4 , the number of fragments versus the binned fraction of screens that a compound classified as a hit for each technique is plotted (0-1, increments of 0.2, 0 means that the fragment was never a hit for that technology, while 1 would mean the fragment was a hit in every assay for that technology). It should be noted that this is a subset of techniques used in the meta-analysis in which at least eight campaigns were available for analysis. For this analysis, we used primary hit selection to include as many screens for each technology as possible. From the validated or consensus hit selection (superset) that we previously performed, we see that fragments tend to hit in <50% of the screens that they were tested in (only one fragment hit >50% of targets; Fig. 1B ). In contrast to this, we see that for most technologies, dozens of fragments hit in more than 60% of the screens ( Fig. 4 ). It should be noted that this is not a direct comparison since the targets used for the validated and consensus hit calling do not always perfectly overlap with those used for technology-specific primary hit calling.
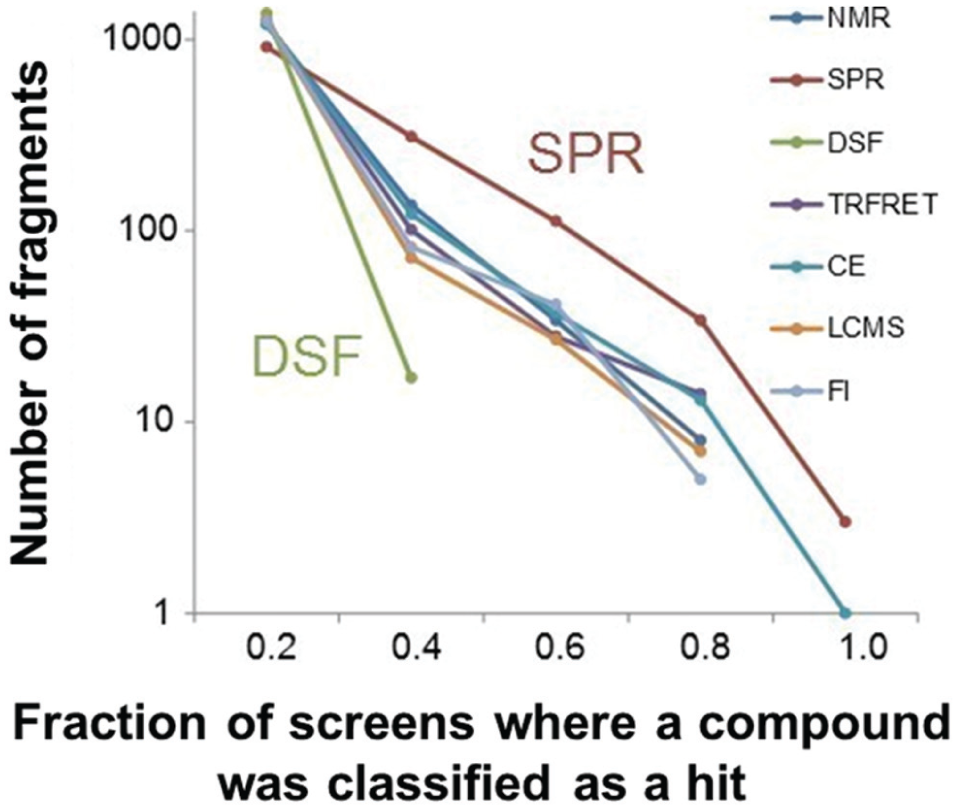
Number of fragments versus the fraction of screens that a compound was classified as a hit in different technologies. The number of fragments is plotted for each binned average. The total number of fragments for each technology is 1400. While the fraction of screens that a compound is classified as a hit tends to be similar for most technologies, it is higher for surface plasmon resonance (SPR) and lower for differential scanning fluorimetry (DSF).
Since the fraction of screens that a compound classified as a hit was well above the rates observed in the superset (when validated and consensus hit selection was employed), we see that different technologies are prone to frequent hitters. With this in mind, one might question whether fragments that consistently hit in a specific technology should be excluded from a generic library of fragments. By tracking some of these fragments, we learned that indeed for some specific cases, the fragments have been confirmed with orthogonal screens—that is, “privileged fragments” may also hit more often in specific technologies. Perhaps more potentially problematic are fragments that are frequent hitters in specific technologies but less often in other technologies. To assess such fragments, we tracked how many crystal structures have been obtained from fragments that are frequent hitters for specific technologies but were not often found in the superset (<3 targets hit). Surprisingly, the rates are very similar for these fragments (2.1%) compared with fragments that are not frequent hitters (1.3%) (
Furthermore, from
Figure 4
, we see that for most technologies, the number of fragments with various average hit rates is similar, with SPR and DSF being the exceptions. SPR tends to have more fragments with high hit rates (>60%) than the other technologies assessed, while DSF has no fragments with hit rates above 40%. We investigate SPR and DSF in more depth in the supplemental material. Through control experiments, we were able to identify fragments that tended to nonspecifically accumulate in the matrix of biacore surfaces, explaining in part the high hit rates observed for SPR (
Substructural Differences in Technology Hits and Nonhits
We next examined the difference between hits identified by specific technologies and hits identified in the superset (validated or consensus for any technology) in a more rigorous manner. We did this by examining biases for each technology on a substructural level for enrichments in hits. To do this, we computed the probability that a substructure is enriched in active compounds for all targets, with respect to hit selection performed using one technology (primary or validated when available;
We performed principal components analysis on the difference vector for each technology ( Fig. 5 ) to visualize relationships between the technologies. Interestingly, using this approach, we see that two nonoverlapping clusters are formed composed of the biophysical techniques (red markers) and the biochemical techniques (blue markers). Intuitively, one might roughly separate fragment screening technologies into these two groups, so it is reassuring that our method to identify the distinguishing characteristics of specific technologies captures this intuition, although it did not use this information to generate the difference vectors. Although this method of grouping technologies is visually appealing and makes sense intuitively, we sought a quantitative way to ascertain how complementary technologies are to each other based on the complementarity score, which we describe in the following section.
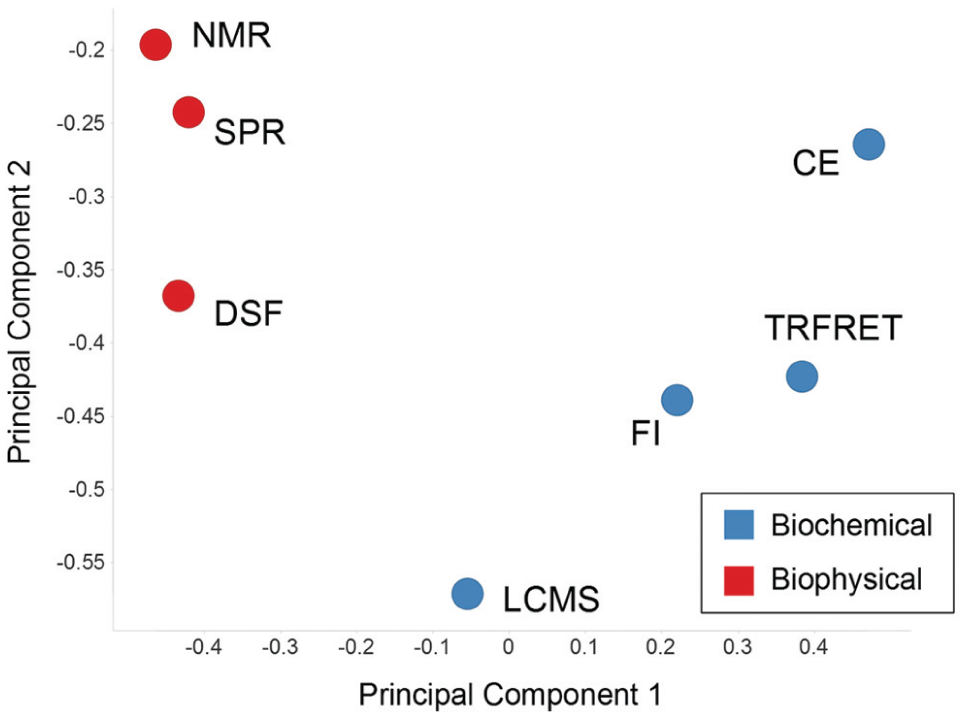
Comparison of each technology based on the chemical matter that it identifies as hits versus the chemical matter present in the superset. The first two principal components for the difference vector D of each fragment screening technology are plotted. Biochemical technologies are depicted in blue and biophysical technologies are depicted in red.
Selecting Complementary Assays
We next sought to understand how technologies should be paired. We chose to assess one common strategy of hit selection, where all hits from two (or more) technologies are carried forward, for example, to consider for chemistry, SAR by archive, or crystallization studies. We termed this hit selection strategy inclusive (as opposed to consensus hit selection, which is discussed in the supplemental material). To validate our method, we chose two campaigns that had each used five screening technologies, which was the greatest number of technologies used for a single campaign in our study. In our approach, we assess what fraction of the superset would be obtained if only two of the possible five screening technologies were employed. We then try to predict how to select the optimum screening technologies a priori.
In our analysis, we employed the difference vectors D for each technology (as described in the supplemental material) to describe that technology. This vector stores the differences between a specific technology and the superset for substructures enriched in actives. We sought to use the information in this vector to predict how complementary two technologies are, that is, which ones should be paired. To do this, we use these vectors to calculate (1) the Pearson correlation between two technologies and (2) the complementarity score for inclusive hit selection (see supplemental material).
To validate this method, we left out the target of interest and calculated the Pearson correlation and total inclusive hit selection bias for technology pairs for oxidoreductase 1 and oxidoreductase 2 (
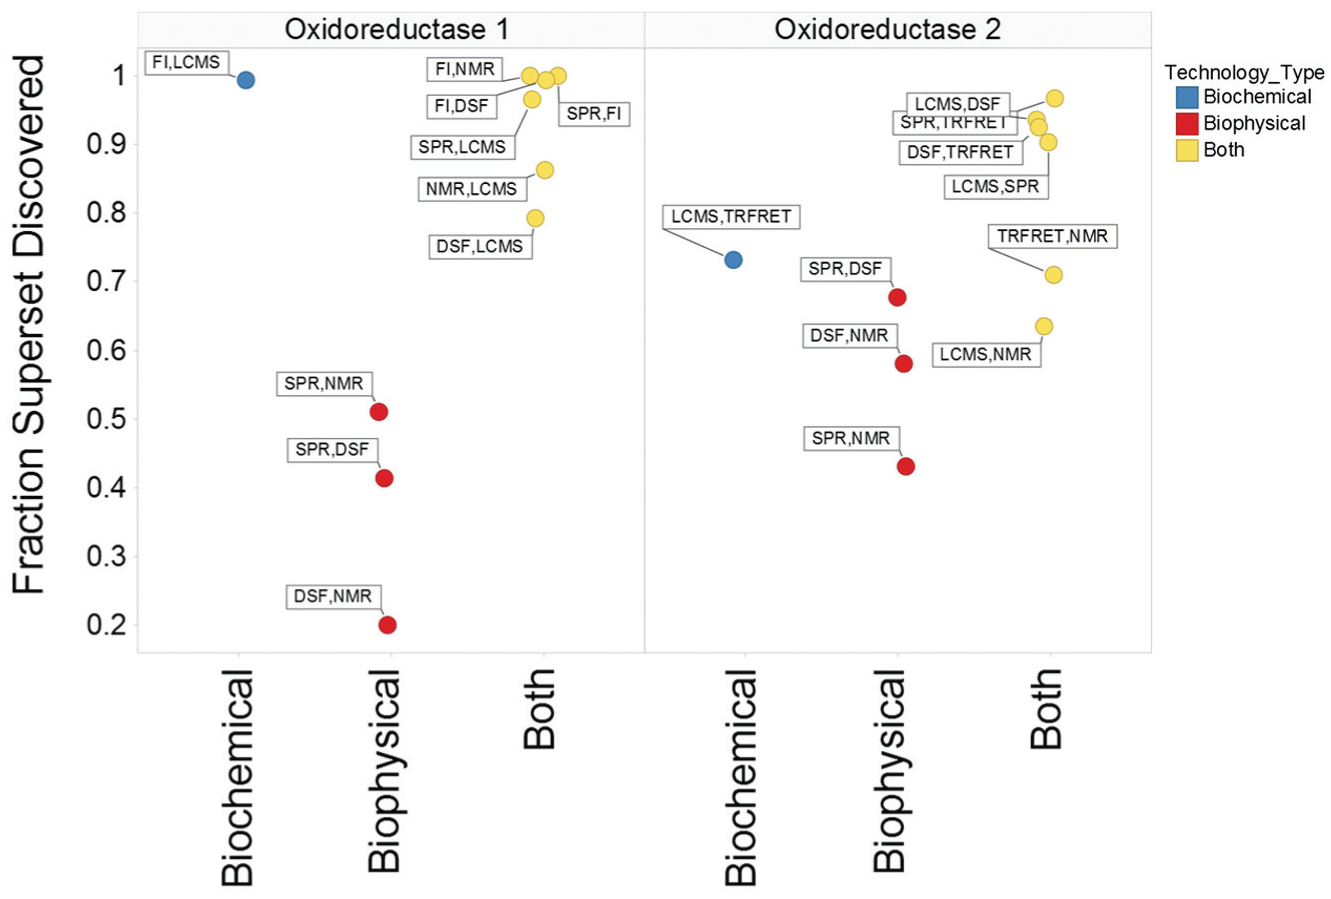
The fraction of all hits identified when only two of five technologies are considered for oxidoreductase 1 and 2. Pairs consisting of biochemical (blue), biophysical (red), and both (yellow) technologies are depicted.
To assess the robustness of this argument, we also plotted the Pearson correlation and total inclusive bias for technology pairs when all campaigns were assessed. Once again, we observe that when a biochemical and biophysical technology are paired (green diamonds,
In conclusion, we have presented a meta-analysis of fragment-based screening campaigns that, to our knowledge, is more comprehensive than any other FBS analysis to date. This breadth of data allowed us to draw several conclusions, which would not have been possible to reach otherwise.
From our studies of what makes a fragment amenable for FBS, we learned that there are privileged fragments that hit more targets than expected by chance. These fragments are of high value to a screening library as a higher fraction has been crystallized against targets compared with other hits, and in cases that we examined, they were potential seeds for lead discovery. This implies that specificity screens against off-targets should only be used with caution, as these screens may lead to privileged fragments being removed from a hit list.
From our assessment of technology differences, we learned that every technology is prone to idiosyncrasies, although they may differ in nature. While frequent hitters were identified for all technologies (except DSF), they tended to have similar downstream success in crystallography campaigns for specific targets, compared with fragments that were not frequent hitters, and thus their removal from generic libraries may not be desirable. Perhaps flagging them as frequent hitters for a given technology, so that resources will be invested in them only if they also hit orthogonal technologies, would be a judicious choice.
We investigated two technologies in depth: SPR due to especially high hit rates and DSF due to especially low hit rates. For SPR, we identified fragments that accumulate on the surface of chips over the course of an experiment, which may lead to false positives. For DSF, we identified fragments that consistently destabilize proteins, which may lead to false negatives. These in-depth analyses help explain in part the observation that when multiple technologies are used in parallel, there may be inconsistencies between the fragments selected as hits from each technology.
We also proposed a quantitative framework for comparing screening technologies (bias vectors). This framework supports a simple rule of thumb that was also observed: when using inclusive hit selection with two technologies, a biophysical and biochemical technology should be paired to cast the broadest net on fragment hits.
Footnotes
Acknowledgements
The authors thank John Davies, Dan Erlanson, Stephan Reiling, and Eugen Lounkine for helpful comments, as well as Céline Be, Regis Cebe, Rene Hemmig, and Andrea Saenger for excellent technical assistance. The authors also thank the many talented scientists who generated the data used for this meta-analysis.
Author Contributions
The manuscript was written through contributions of all authors. All authors have given approval to the final version of the manuscript.
Declaration of Conflicting Interests
The authors declared no potential conflicts of interest with respect to the research, authorship, and/or publication of this article.
Funding
The authors disclosed receipt of the following financial support for the research, authorship, and/or publication of this article: This work was supported by the Novartis Institutes for Biomedical Research. P.S.K. and A.M.W. were funded as Presidential Postdoctoral Fellows by the NIBR Education Office.
References
Supplementary Material
Please find the following supplemental material available below.
For Open Access articles published under a Creative Commons License, all supplemental material carries the same license as the article it is associated with.
For non-Open Access articles published, all supplemental material carries a non-exclusive license, and permission requests for re-use of supplemental material or any part of supplemental material shall be sent directly to the copyright owner as specified in the copyright notice associated with the article.