
Abstract
Automated phase-contrast video microscopy now makes it feasible to monitor a high-throughput (HT) screening experiment in a 384-well microtiter plate format by collecting one time-lapse video per well. Being a very cost-effective and label-free monitoring method, its potential as an alternative to cell viability assays was evaluated. Three simple morphology feature extraction and comparison algorithms were developed and implemented for analysis of differentially time-evolving morphologies (DTEMs) monitored in phase-contrast microscopy videos. The most promising layout, pixel histogram hierarchy comparison (PHHC), was able to detect several compounds that did not induce any significant change in cell viability, but made the cell population appear as spheroidal cell aggregates. According to recent reports, all these compounds seem to be involved in inhibition of platelet-derived growth factor receptor (PDGFR) signaling. Thus, automated quantification of DTEM (AQDTEM) holds strong promise as an alternative or complement to viability assays in HT in vitro screening of chemical compounds.
Keywords
Introduction
In pharmacological or toxicological high-throughput screening (HTS) of chemical libraries, video or time-lapse microscopy for quantification of cellular events of interest has several potential advantages over cell viability endpoint assays, like MTT (NADPH-dependent colorimetric assays), FMCA (fluorometric microculture cytotoxicity assay),1,2 and assays measuring adenosine triphosphate levels. Although proven helpful in many instances, these settings are designed to quantify viability at a single predefined time point only and can detect morphological changes only implicitly (when the morphological changes are associated with changes in viability). Thus, there is an apparent risk that a standard cell viability assay setting will miss many chemical compounds with potentially interesting cellular actions because the preselected time point is not very informative and/or because there are substantial morphological changes that do not accompany changes in viability. Like other assays that enable temporal profiling, a potential advantage of video microscopy lies in its inherent ability to monitor morphological changes throughout time that can provide unique information useful for detection and characterization of biologically active compounds. Such compounds typically exert their effects by interacting with several cellular signal transduction pathways and feedback loops (circuits). These interactions sometimes lead to morphological changes that can be recorded and characterized irrespective of their actual molecular targets.3,4 Recent advances in HTS and computational image analysis have opened new avenues to screening of chemical compounds in the fields of pharmacology and toxicology. To quantify several characteristics of a compound’s composite effect, multiparameter assays are now available for phenotypic profiling with the potential to determine cellular activity and to predict the mechanism of action of unknown chemical perturbations.5–7 However, these assays 3–7 are based on molecular labeling techniques that can perturb biological cues of tested compounds, thereby compromising screening data, which may entail false conclusions. Moreover, these assays are often prohibitively costly and time consuming for HT experiments. Thus, there is an apparent need for label-free alternatives that can offer cost-efficient and fast monitoring and quantification of subcellular events throughout time. Recently, a wide range of label-free techniques have been developed for HTS.8–11 Many of them are based on changes in physical properties measured for example using interferometric microscopy or via changes in electrical impedance or refractive index. While these approaches often require sophisticated and thus costly instrumentation, cheaper and/or faster screening assays based on standard phase contrast video microscopy hold strong potential for rendering HTS available to larger sets of chemicals.
In this study, we present and evaluate such a label-free method—automated quantification of differentially time-evolving morphologies (AQDTEM)—applicable to video microscopy. More specifically, AQDTEM is designed to monitor chemically induced changes in time-evolving morphologies, relative to untreated controls, based on sequences of phase contrast microscopy images that are processed rapidly using a computationally efficient feature extraction and comparison algorithm. As demonstrated in this article, HTS results obtained by means of AQDTEM can help suggesting mechanisms of action (and thereby also predict therapeutic responses) of an unknown drug based on its phenotypic profile. Three different feature extraction and comparison algorithms were evaluated when applying AQDTEM to a large video microscopy data set obtained by exposing human colorectal carcinoma cell line HCT116 to 1697 bioactive compounds. For comparison, the standard cell viability assay FMCA was used as a final additional readout. For the most promising AQDTEM algorithm tested, almost all hits made by FMCA were also identified by AQDTEM, but the latter setting also enabled detection of several compounds (ignored by the FMCA) that induce substantial morphological changes. An outstanding example was detection of a subset of drugs that make the cell population form large spheroidal cell aggregates.
Materials and Methods
Cell Cultures and Seeding
Cells of the human colon carcinoma cell line HCT116 were used in the study. Cell culture reagents were purchased from Sigma-Aldrich (St. Louis, MO), unless otherwise stated. The cells were grown in McCoy’s 5A medium (cat. no. M8403; Sigma-Aldrich) supplemented with 10% heat-inactivated fetal calf serum (cat. no. F6131; Sigma-Aldrich), 2 mM glutamine (cat. no. G7513; Sigma-Aldrich), 100 µg/ml streptomycin, and 100 U/ml penicillin (cat. no. P0781; Sigma-Aldrich) at 37 °C in humidified air containing 5% CO2.
Compound Library
Compounds from two chemical libraries were screened. The Pharmakon 1600 library (MicroSource Discovery Systems, Gaylordsville, CT) encompasses 1600 compounds that all have a record of human exposure; a second library of 97 clinically approved drugs was provided as a kind gift from the U.S. National Cancer Institute (Bethesda, MD). The stock concentration of compounds was 10 mM, and they were dissolved in 100% DMSO. They were transferred to 384-well source plates (Labcyte cat. no. P-05525; Labcyte, Sunnyvale, CA) specially designed for acoustic dispensation. Compounds were screened at a final concentration of 10 µM with DMSO final concentration equal to 0.1%.
Assay for Determination of Cell Viability (Survival Index)
After 72 h incubation and imaging, cell survival was measured using the FMCA,1,2 which is an old standard assay for cell viability. The FMCA measures the cell survival by recording fluorescence generated from the hydrolysis of fluorescein diacetate to fluorescein by cells with intact plasma membranes. The number of living cells is proportional to emitted fluorescence. Cell survival of each experimental well is calculated as the survival index S, defined as

where fsample denotes the fluorescence signal from the well of the sample, fblank denotes the fluorescence signal from the well of the blanks (average), and fcontrol denotes the fluorescence signal from the control wells (average).
Label-Free Video Microscopy Screening
For the video microscopy screening, the HCT116 cells were seeded at a density of 2500 cells per well with a total volume of 50 µL. Cell seeding was done through a pipetting robot Precision 2000 (BioTek Instruments, Winooski, VT) in 384-well microtiter plates (Nunc). After 24 h of incubation, 50 nL of 10 mM compounds were added from the source plate to the destination plate via acoustic drop ejection using a Labcyte Echo 550 liquid handler with a final concentration of compounds equal to 10 µM. Three columns of wells without drugs (column 12, 13, and 24) served as controls, and 1 column with culture medium only served as blank (column 1). The plates were incubated and monitored at 37 °C for 72 h in an IncuCyte Zoom (Essen BioScience, Ann Arbor, MI), which is an incubator equipped with a fully automated phase contrast microscope; images were taken every 2 h. The microscope had a 4×, 10×, and 20× objective with the ability of imaging high-definition (HD) and high-quality phase contrast images (1024×1280 pixels) that provided morphological information not found with fluorescent-only imaging. HD imaging is insensitive to focus and illumination aberrations caused by fluid meniscus. IncuCyte Zoom can accommodate multiple fluorescent dyes, which allows users to track cell behavior kinetically in three different imaging modes: HD phase contrast, red channel fluorescence, and green channel fluorescence. This makes possible follow-up studies on primary findings using an unlabeled approach as well as special targeted studies, but this is a topic beyond the work presented here. A 20× objective was used for imaging, and each 384-well plate was scanned in 13 min. In total, 2208 wells were scanned (1697 drug-treated and 511 control wells) distributed across six 384-well plates, with each well generating a time-lapse video consisting of images taken at 36 consecutive time points. The microscope can heat up during excessive scanning; auto-cooling steps of 5 min were thus added in between scanning of multiple plates. All six plates were imaged simultaneously (the IncuCyte can accommodate up to six plates concurrently). For a 384-well plate, only one field per well can be imaged, and this field of view is fixed for the remaining time points to keep track of the cells. Ignoring control and blanks, one can run 320 compounds per plate and thus 1920 compounds in parallel. Imaging one such batch every second hour results in approximately 23,000 compounds every 24 h and thus approximately 1 million compounds every sixth week. A time-lapse movie of 36 consecutive time points per batch, instead of only one single image per drug, reduces the throughput 36-fold to approximately 27,000 compounds every sixth week. However, the number of compounds being screened can be increased by using an automation-ready incubator in which plates can be added or removed from the IncuCyte using a robotic arm. Feature extraction was relatively fast because it took 0.2 s to process each image (2 min per 384 wells) using a Quad-core Intel Xeon 5520 (Nehalem 2.26 GHz, 8 MB cache) processor and 3 GB RAM. The analysis of our batch was swiftly performed on a computing cluster using multiple cores operating in parallel, but the same calculations would have taken only approximately 20 min on the Quad-core machine described above. Computation and data storage were conducted on resources provided through the Uppsala Multidisciplinary Centre for Advanced Computational Science (www.uppmax.uu.se).
Confluence Extraction
A feature reflecting cell confluence was extracted as the fraction of the pixel area covered by cells in each image. Because the background is dominating at the earliest time points, median of pixel intensities was determined that corresponds to the background. A background pixel is defined to be inside the interval [0.95m, 1.05m], where m is the median of the pixel intensities extracted at the first time point. Then, for each time point, cell confluence was calculated by determining the fraction of pixels outside this interval.
Fourier Transform Features
A panel of Fourier transform–based morphological features were obtained for each image. This set of features was included to demonstrate a simple example from a large family of possible rotation and translation invariant Fourier transform–based features than one may propose and explore in this context. The basic idea in the version used in this study is to create a feature vector in which each element corresponds to the energy within a narrow spatial frequency interval (including all orientations). The features were generated by first splitting each image of size 1024×1280 pixels into 8×10 non-overlapping subimages of size 128×128 pixels, and then translating each of them into 80 different two-dimensional (2D) amplitude spectra obtained via the conventional 2D fast Fourier transform (as available in any modern version of Matlab). The complex number X(u,v) produced by the fast Fourier transform at spatial frequency bin pair (u,v) for a R×C dimensional image with pixel values x(r,c) is defined as
Pixel Histogram Hierarchy Extraction
Morphological features in terms of pixel histograms at different resolutions were extracted from the images; see Figure 3 . Features were extracted for six different image resolution levels by decreasing the resolution into half in each step and extracting the histogram for that level. Matlab function imresize was used for decreasing the resolution of the original image into a reduced image with 50% of the original area (number of pixels). The histogram values extracted for each resolution were then stacked together sequentially, and the process is repeated for all time points. Based on empirical findings about achieving good performance, the histograms were based on 10 bins.
Visualization and Quantification of Reproducibility
Regardless of the morphology feature extraction method used, for each time point (image) t, a feature vector
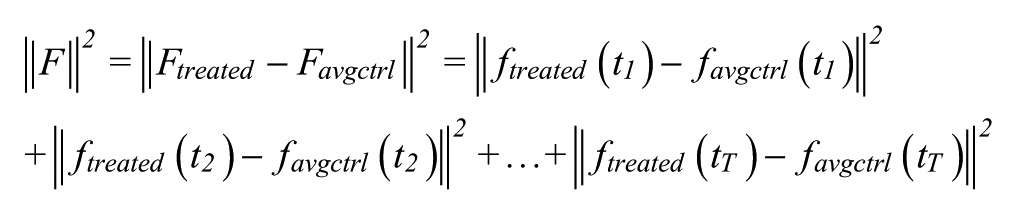
Notably, when
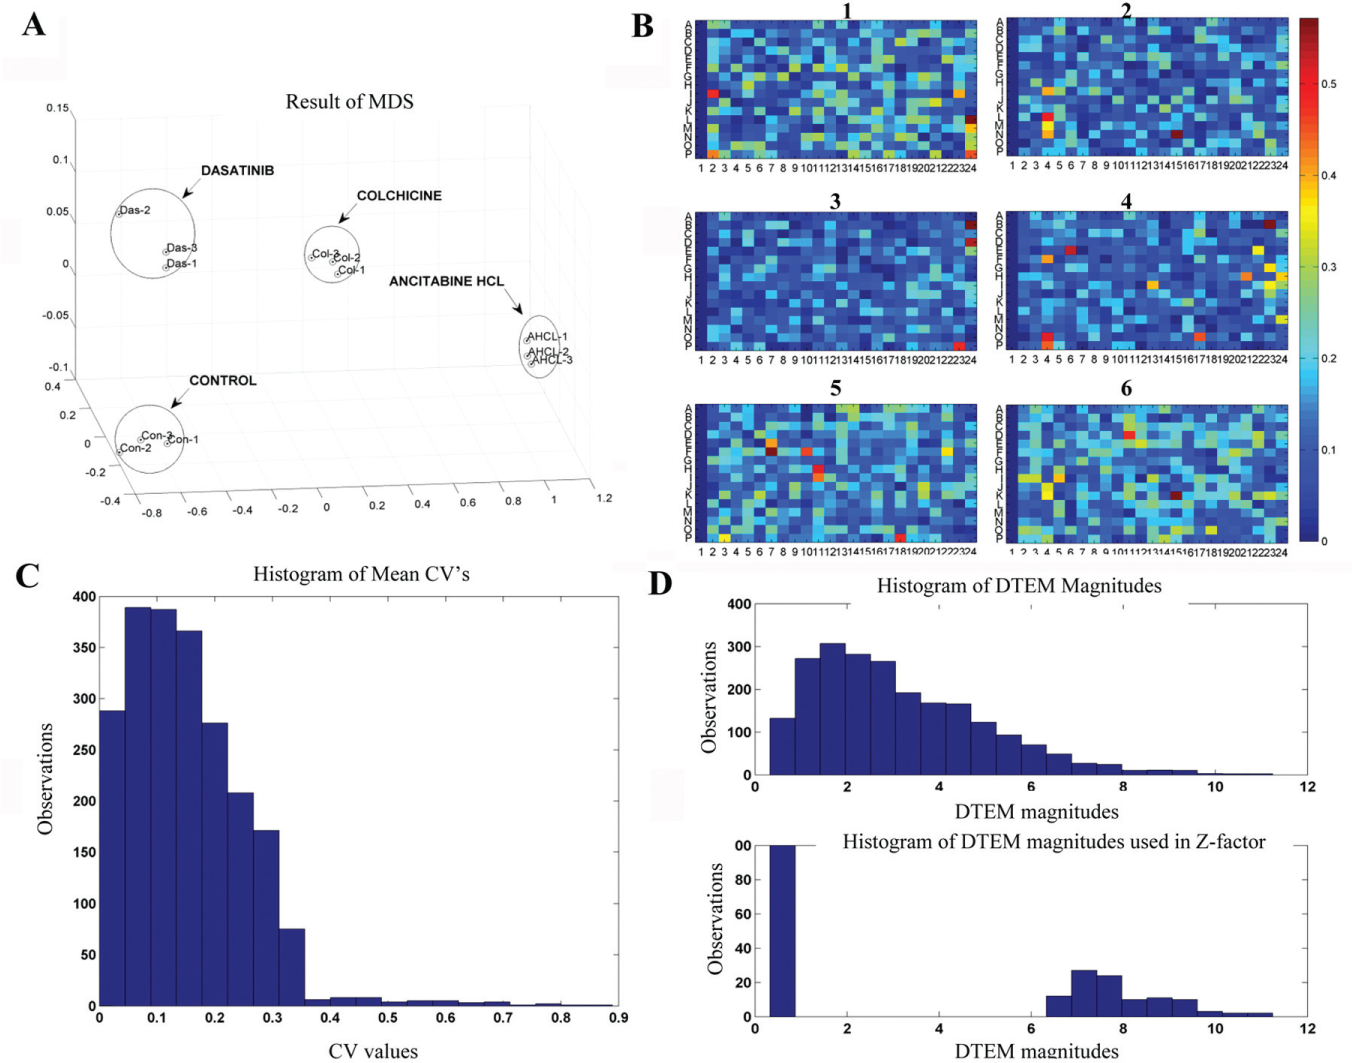
The Z-factor (or Z’-factor) was calculated by means of the 100 largest and 100 smallest magnitudes observed among the 1697 compounds tested. Thus, the 100 largest were used as positive controls, and the 100 smallest as negative controls. We used 200 examples as a reasonable compromise between avoiding an unreliable estimate (because of too few values used), while at the same time only using values obtained at the two extremes of the dynamic range considered.
Detection Threshold
An agent was assigned to be a hit if its DTEM matrix
Multidimensional Scaling
The multidimensional scaling (MDS) was performed using default settings in the Matlab function mdscale resulting in nonmetric multidimensional scaling; for details, see the Matlab documentation (www.mathworks.com).
Results
Overview of Screening and Data Processing
A chemical library containing 1697 compounds was screened, using the human colorectal carcinoma cell line HCT116, at a concentration of 10 µM in complete cell culture medium and imaged each second hour (see the Materials and Methods section). The resulting images were transferred to a database for further processing using AQDTEM. In this step, DTEM profiles for treated cells were generated using three different morphology feature extraction and comparison algorithms (see the next section). To determine whether the quantified changes associated with one compound are sufficiently large to be statistically significant, they were compared to a 95% false alarm threshold obtained from the corresponding quantified changes for untreated cells (relative to their own common average). For more details, see Materials and Methods. A flowchart of the automated microscopy screen used in the present study is displayed in
Evaluation and validation of screening assay. (
Evaluation of Three Algorithms for Image Feature Extraction and Comparison
Three different algorithms for morphology feature extraction and comparison were used to evaluate the potential of AQDTEM ( Fig. 2 ). The first algorithm, here referred to as confluence comparison (CC), extracts a single scalar confluence measure from each well at each time point ( Fig. 2B ). The second method, here named Fourier comparison (FC), extracts and compares a panel of different Fourier transform–based features ( Fig. 2C ). The third algorithm, named pixel histogram hierarchy comparison (PHHC), extracts and compares a hierarchy of pixel histograms obtained at six different levels of resolution. The extraction procedure, as illustrated in Figure 3 , shows how the pixel histograms are obtained at each level of resolution. To make more details visible, Figure 2D does not show the actual histograms (as in Fig. 3 ), but instead displays time-evolving pixel histograms, as inferred by first subtracting a reference histogram that is the global-average histogram across all the time points. For more details, see Materials and Methods.
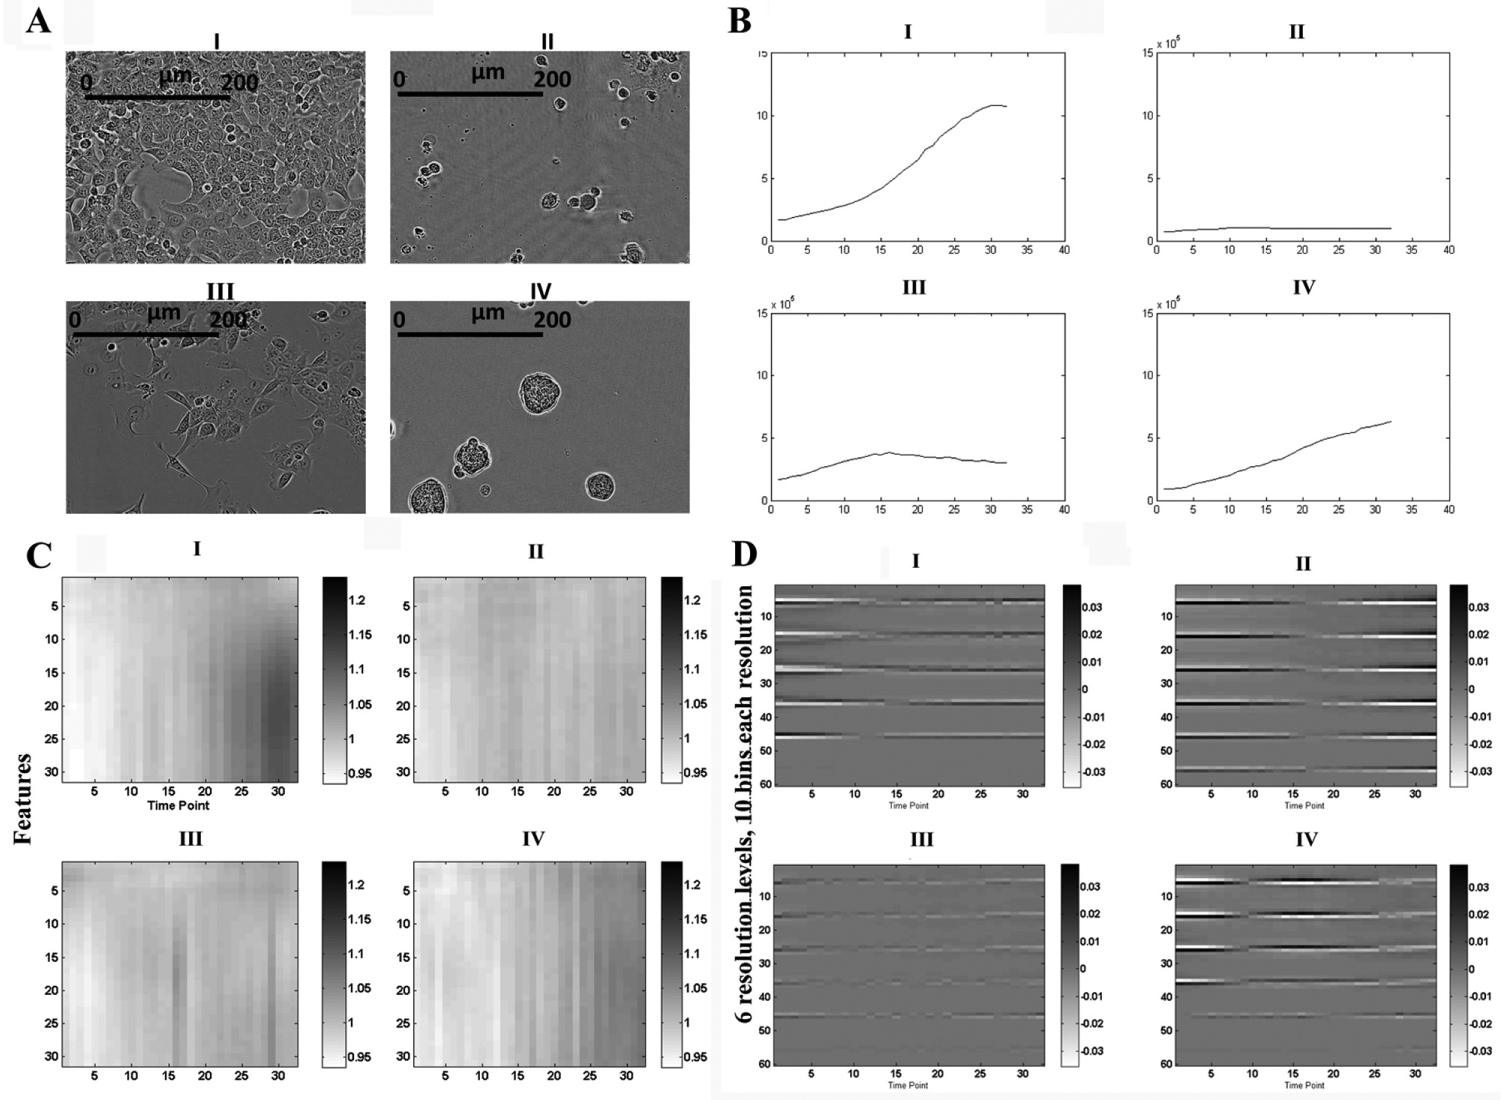
Morphological feature extraction using three different algorithms. (
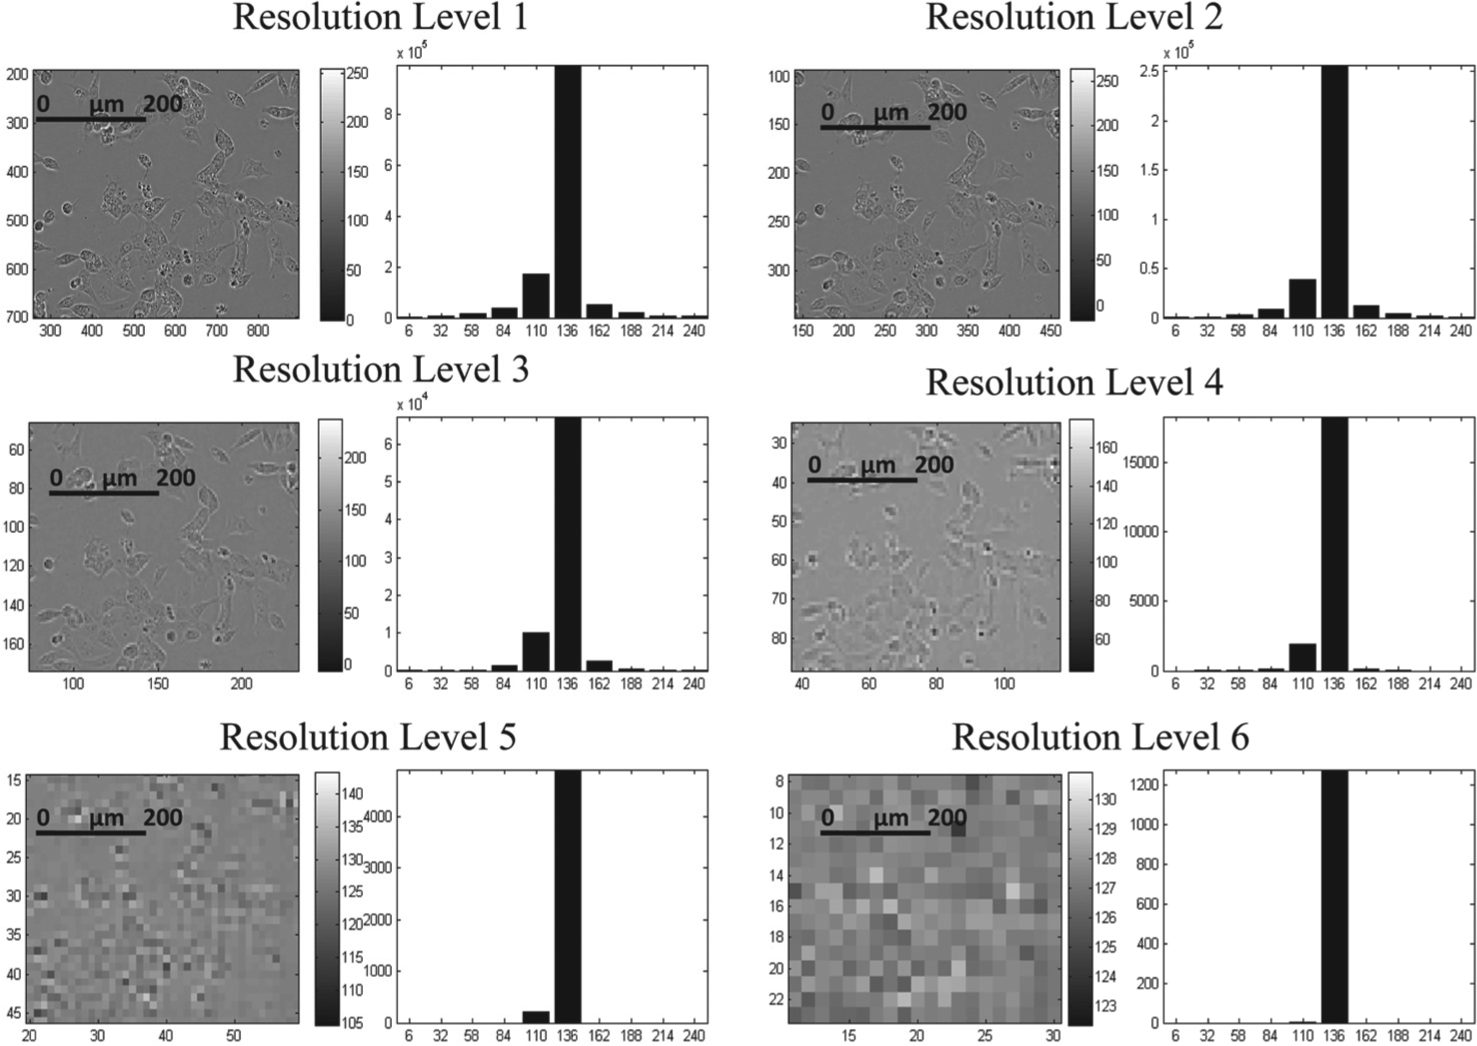
Illustration of the pixel histogram hierarchy extraction. First, one pixel histogram is obtained for the original image (Level 1). Then, the resolution of this image is decreased using a standard image-processing algorithm (see Materials and Methods), and then a second pixel histogram is extracted (Level 2). This procedure is repeated, and the resulting six histograms are then merged into a single feature vector. Notably, each pixel at the top level reflects spatial dependencies across almost the whole image. This causes the resulting multilevel pixel histogram to provide additional information compared to a plain single-level pixel histogram. All images have the same scale as displayed in resolution Level 1.
Comparing the three morphology feature extraction and comparison algorithms revealed that PHHC was the most promising algorithm for AQDTEM. It resulted in 137 compounds higher than the 5% false alarm threshold. These hits were compared with those of the standard FMCA cell viability analysis providing survival indices (see Materials and Methods) in the interval [0,100]. The 5% false alarm threshold level for FMCA was determined to be 81 and resulted in 143 hits. Comparing the FMCA and AQDTEM hit lists revealed that AQDTEM picked 124 out of 143 FMCA hits, translating into a sensitivity and positive predictive value of 87% and 91%, respectively ( Table 1 ).
Performance Comparison of the Three Feature Extraction Methods.
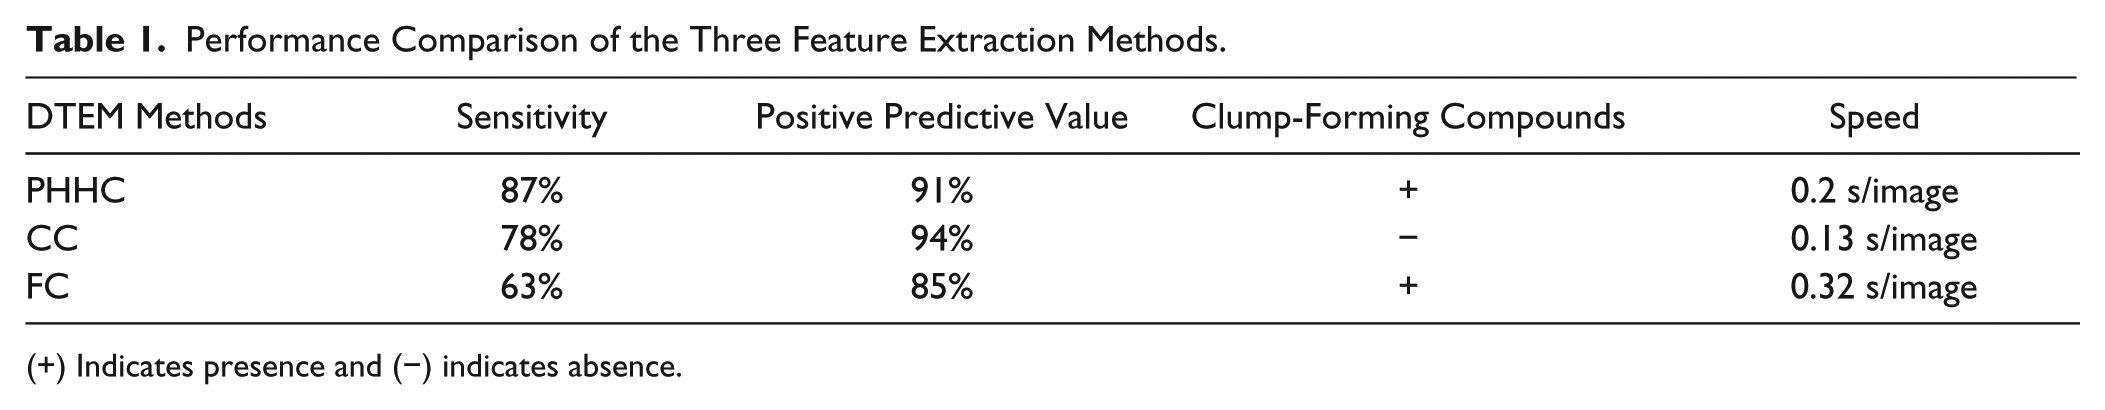
(+) Indicates presence and (−) indicates absence.
In addition to the FMCA hits, AQDTEM also identified agents that induced morphological changes not related to decreased cell viability. These hits included compounds leading to the formation of cell aggregates (
Fig. 4A

HCT116 cells treated with (A) vandetanib, causing formation of cell aggregates; (B) dasatinib, causing formation of large spheroidal cell aggregates; and (C) ancitabine hydrochloride, causing intracellular vesicles pointed by the black arrowhead. (D) Untreated control cells. All images correspond to time point 72 h.
Compounds Inducing Formation of Spheroidal Cell Aggregates
Using AQDTEM based on PHHC, vandetanib, imatinib, and dasatinib were identified to induce the formation of large cell aggregates. These agents are all licensed drugs against various cancers and belong to the protein tyrosine kinase–targeting class of pharmaceuticals. In addition to these three hits, the compound aurintricarboxylic acid (ATA) was also found to result in cell aggregation, using a slightly different experimental setup in which the cells were seeded directly into wells with ATA present. This finding suggests that ATA may operate through a (partly) different biological mechanism, relative to the three other above-mentioned hits, probably involving interference with cellular attachment to surface. Nonetheless, an intriguing circumstance in this context is that all four hits have been reported as inhibitors of protein tyrosine signaling, including that of PDGFR.14–17 For the chemical structures of these four hits, see Figure 5 . Taken together, this case as well as the already-reported 12 results regarding compounds inducing intracellular vesicles (see Fig. 4C ) show apparent associations between the morphological changes (cell aggregates, vesicles) and the corresponding bioactivity (PDGF inhibition, autophagy). Thus, these observations support the general conclusion that any two compounds with an outstanding but mutually similar DTEM profile are likely to share a common or similar bioactivity.
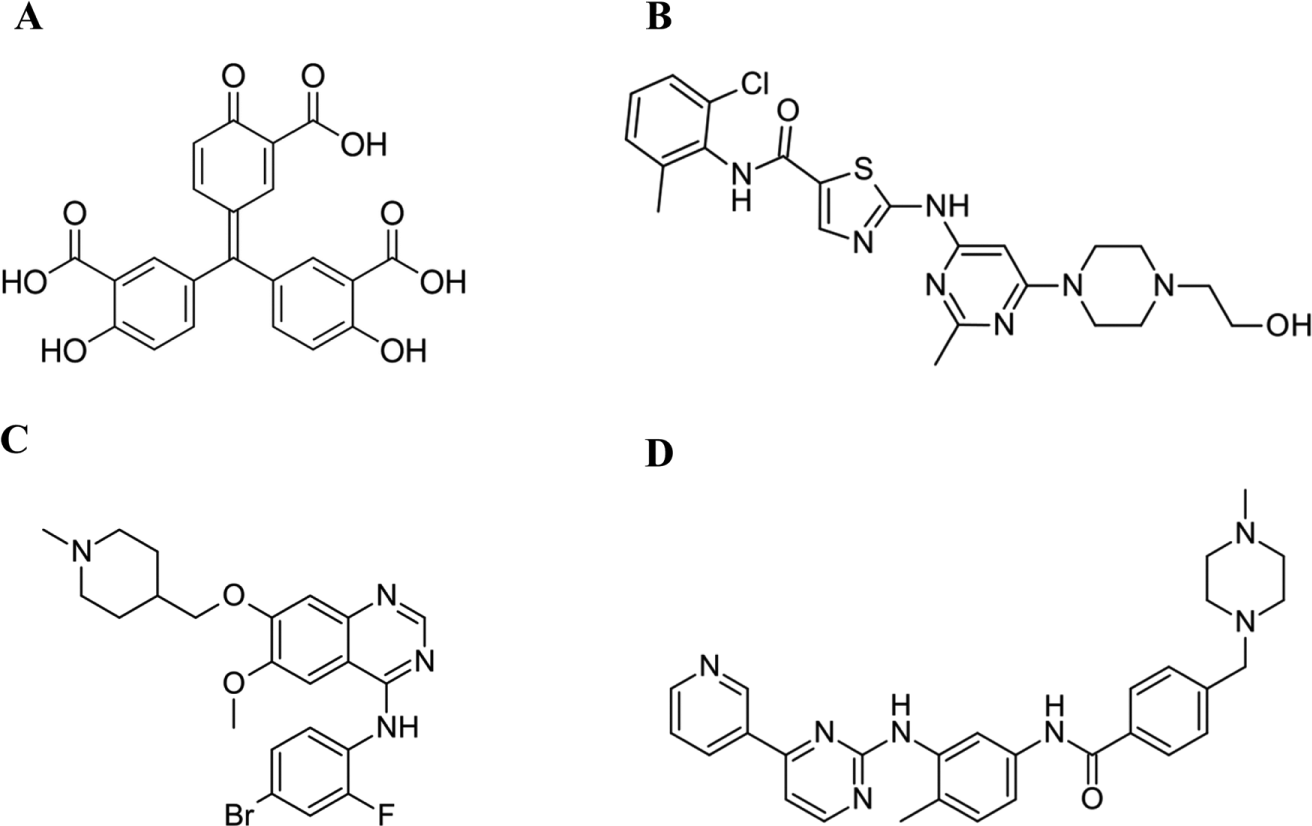
Chemical structure of four compounds inducing formation of large spheroidal cell aggregates. (
Discussion
In this study, we have developed and evaluated a label-free, video microscopy–based HTS method to identify chemically induced changes in cellular microcultures, which should be suitable for pharmacological and toxicological studies. Quantitative DTEM profiles are achieved by extracting and comparing morphological features from cells, in response to diverse chemical cues. Three distinct morphology feature extraction and comparison algorithms were developed and implemented for quantification of differences in DTEMs between pairs of phase-contrast microscopy videos. Each of the three algorithms was assessed in a large HTS procedure (1697 compounds) and thus evaluated, in part by relating accordingly obtained results to those derived from an established cell viability assay (FMCA).
The most promising algorithm, PHHC, was able to detect several compounds that did not induce any significant change in cell viability (relative to untreated controls) but caused substantial morphological changes. An outstanding example is the detection of three compounds that all induced large spheroidal HCT116 cell aggregates without significant changes in viability. An additional compound (ATA) also inducing cellular aggregation, but in a different experimental setup, was likewise identified within the same image-processing framework. According to recent reports in the literature, all these four compounds seem to be involved in inhibition of PDGFR signaling.
Seemingly, this method can be used to predict the mode of action of novel compounds, thus complementing other techniques designed to gain insight into low-molecular-weight substance bioactivity (e.g., those based on ligand similarity). 18 This conclusion can be made based on the experimental finding that the three compounds forming large spheroidal cell aggregates have a characteristic common DTEM profile as well as bioactivity (inhibition of protein tyrosine kinase signaling). This conclusion is also supported by our already-reported 13 finding that compounds inducing intracellular vesicles have similar DTEM profiles and bioactivity (inducing autophagy).
In conclusion, this work demonstrates that AQDTEM is a promising alternative to viability assays in HT in vitro screening of chemical compounds, which deserves further studies. Although straightforward in its experimental design, the PHHC image analysis algorithm for feature extraction and comparison of DTEMs presented in this article is able to find not only the same hits as those identified by a conventional viability assay but also many other substances that induce cellular responses beyond cell death. Finally, it is important to stress that the current study should only be considered as a first illustration of the potential offered by this approach using relatively simple algorithms and experimental equipment. More work and research are needed to characterize the potential performance in more detail and to further improve the methodology enabling, for example, an even faster throughput capacity.
Footnotes
Acknowledgements
Many thanks to the editor and to two anonymous reviewers who provided important comments and suggestions that very much helped us with improving the quality and outline of the original version of the article manuscript.
Author Contributions
All authors contributed with suggestions regarding the experiments as designed and performed. OA performed most of the research, with MF and RL supervising the wet lab part and MG and UH supervising the algorithmic part. The article was drafted by OA and MG. MG was supervising the project. All authors contributed to the analysis of the experimental results and improvements of the draft. All authors read and approved the final manuscript.
Declaration of Conflicting Interests
The authors declared no potential conflicts of interest with respect to the research, authorship, and/or publication of this article.
Funding
The authors disclosed receipt of the following financial support for the research, authorship, and/or publication of this article: This work was supported by the Higher Education Commission of Pakistan (OA) and by the SSF framework project “Tools for Diagnosis and Drug Discovery in Cancer” (MF).
References
Supplementary Material
Please find the following supplemental material available below.
For Open Access articles published under a Creative Commons License, all supplemental material carries the same license as the article it is associated with.
For non-Open Access articles published, all supplemental material carries a non-exclusive license, and permission requests for re-use of supplemental material or any part of supplemental material shall be sent directly to the copyright owner as specified in the copyright notice associated with the article.