
Abstract
The authors investigated the time course of leukocyte infiltration compared with microglial activation in adult rat brain slices after permanent middle cerebral artery occlusion (MCAO). To distinguish peripheral leukocytes from microglia, the blood cells were prelabeled in vivo with Rhodamine 6G (Rhod6G) IV before induction of ischemia. At specific times after infarct, invading leukocytes, microglia, and endothelial cells were labeled in situ with isolectin (IL)B4-FITC (ILB4). Six hours after MCAO only a few of the ILB4+ cells were colabeled by Rhod6G. These cells expressed the voltage-gated inwardly and outwardly rectifying K+ currents characteristic of macrophages. The majority of the ILB4+ cells were Rhod6G− and expressed a lack of voltage-gated channels, recently described for ramified microglial cells in brain slices, or exhibited only an inward rectifier current, a unique marker for cultured (but unstimulated) microglia. Forty-eight hours after MCAO, all blood-borne and the majority of Rhod6G− cells expressed outward and inward currents indicating that the intrinsic microglial population exhibited physiologic features of stimulated, cultured microglia. The ILB4+/Rhod6G− intrinsic microglial population was more abundant in the border zone of the infarct and their morphology changed from radial to ameboid. Within this zone, the authors observed rapidly migrating cells and recorded this movement by time-lapse microscopy. The current findings indicate that microglial cells acquire physiologic features of leukocytes at a later time point after MCAO.
It has been known for over 75 years that focal cerebral ischemia induces an inflammatory response in the brain (Spielmeyer, 1922). Only recently, however, has it been recognized that brain inflammation may have a major impact on the extent of tissue damage and the subsequent recovery. Inflammation occurs with immediate and delayed cellular responses after ischemia. Because early recruitment of patients has been a major obstacle in stroke therapy, inflammation is a promising target for intervention that extends the time window for treatment considerably (Dirnagl et al., 1999). Understanding ischemia-induced inflammation at the cellular and molecular level is a prerequisite for the development of new antiinflammatory strategies in stroke. Inflammation involves intrinsic and peripheral immune-competent cells that interact in the brain parenchyma because the blood–brain barrier is impaired during and after the ischemic event. Candidates within the brain are glial cells, in particular, astrocytes and microglia. Elements infiltrating the brain include blood-borne leukocytes—primarily neutrophils and macrophages, including polymorphonuclear cells (Garcia et al., 1994; Kato et al., 1996). Unfortunately, the discrimination between the intrinsic and extrinsic inflammatory events has been severely hampered by the fact that microglia and macrophages share many features and properties (Kreutzberg, 1996). Currently there are no markers, such as cell-type specific antibodies, which unequivocally distinguish between microglial cells and nonbrain macrophages.
Microglia and leukocytes, specifically macrophages, share common features such as the ability to up-regulate, or de novo express, or both, the same receptors involved in immune responses. They also share some morphologic characteristics, migrate, proliferate, release cytokines, chemokines, nitric oxide, oxygen radicals, and phagocytose in more or less similarly described patterns. One feature that can distinguish leukocytes and microglial cells is their pattern of K+ channels. Ramified microglial cells in situ either lack voltage-gated channels or express an inwardly rectifying component only (Boucsein et al., 2000). In culture, the unstimulated microglial cells exhibit only inward K+ currents, whereas isolated bone marrow-derived macrophages express additional outward K+ currents (Banati et al., 1991; Brockhaus et al., 1993). However, during activation of the cultured microglia in response to injurious signals (that is, when treated with lipopolysaccharide or other inflammatory or pathologic stimuli) cells express the outward component of the K+ currents (Draheim et al., 1999; Noerenberg et al., 1992, 1994; Visentin et al., 1995).
Depending on the severity and type of ischemic brain injury (for example, permanent versus transient ischemia), hematogenous cells appear in the brain parenchyma in a complex temporal and spatial pattern. The general notion is that granulocytes (polymorphonucleocytes) start invading the tissue, in particular the periinfarct (penumbral) zone, within the first few hours, whereas monocytes follow with some delay (1 to 8 days) (Kato et al., 1996; Zhang et al., 1994) peaking at approximately 3 to 4 days. Microglia are probably activated within minutes after injury and the first signs of activation markers become apparent only after a few hours. They will accumulate at the site of injury, either by migration or proliferation within a time frame of 3 days in vitro, in situ, and in acutely fixed brain slices (Ivacko et al., 1996; Kreutzberg, 1996).
In the current study, the authors have investigated the time course of leukocyte invasion and activation of microglial cells in brain slices acutely isolated from adult rats at 6 and 48 hours after the ischemic insult. Because blood-borne leukocytes were prelabeled in vivo before surgery, the authors were able to distinguish them from intrinsically activated microglia and thus, could study the time course of the microglial activation.
MATERIALS AND METHODS
Permanent focal cerebral ischemia
Adult male Wistar rats weighing 250 to 300 g were fasted overnight with free access to tap water. Anesthesia was induced with 5% halothane in 100% O2 and maintained with 1.0% to 1.5% halothane in a mixture of 65% nitrous oxide and 35% oxygen. The tail artery was cannulated for continuous monitoring of arterial blood pressure and repeated blood gas analysis throughout surgery. The right ipsilateral common carotid artery (CCA) and the middle cerebral artery (MCA) were permanently occluded as described by Brint et al. (1988). As a modification, in addition to the right CCA, the left CCA was temporarily occluded for 1 hour. In this model, an infarct evolves that is reliably restricted to the neocortex (Menzies et al., 1992).
Briefly, after ligation of the right CCA through a paramedian incision, the main trunk of the right MCA was exposed under microscopical control (40×) through temporal surgery, and lifted above the cortical surface using a steel hook (80 μm) attached to a micromanipulator. The MCA was then closed by short application of a thermocautery to the hook. Immediately afterwards, the left CCA was occluded temporarily for 1 hour using a silastic thread. Anesthesia was discontinued immediately after reperfusion of the left CCA and the animals were returned to their cages. Anesthesia did not exceed 90 minutes (30 minutes surgery and 60 minutes left CCA occlusion). For leukocyte (and platelets) labeling, 2 mg Rhodamine 6G (Rhod6G; Aldrich, Milwaukee, WI, U.S.A.) dissolved in 1 mL 0.9% NaCl was retrogradely injected through the tail artery at the start of the surgery (Villringer et al., 1991). The labeling was repeated by intravenous application of 250 μg dissolved in 0.5 mL 0.9% NaCl after the first 12 hours.
Physiologic monitoring
In all animals, mean arterial blood pressure was monitored continuously throughout anesthesia (RFT Biomonitor, Zwönitz, Germany), whereas body temperature was measured and maintained at 38 ± 0.5°C with a heating pad. After surgery, rectal temperature was measured daily. During surgery, blood gas analysis (arterial oxygen and carbon dioxide tensions, pH) was performed every 30 minutes (Compact 2 Blood Gas Analyser; AVL List GmbH, Graz, Austria). In some of the animals, temperature of the left temporal muscle was monitored (needle thermometer, Temperature Adapter DH-802-C; Lutron Electronics, Coopersburg, PA, U.S.A.) as a measure of brain temperature. Blood glucose was measured directly after the middle cerebral artery occlusion (MCAO) (arterial) in all animals and remained consistent (Haemo-Glukotest 20-800R; Boehringer Mannheim, Mannheim, Germany).
Preparation of cortical slices and electrophysiologic set-up
The animals were quickly decapitated for preparation of brain slices. The brains were removed, washed in buffer solution at 5 °C, and cut into 150-to 200-μm-thick slices using a vibratome (FTB, Plano, Marburg, Germany). The brains, including infarcted and periinfarct tissue, as well as the normal tissue of the contralateral hemisphere, were sliced coronally by standard technique after 6, 12, 24, 48, 72 hours, and 8 days after MCAO. Slices were transferred to a nylon net in cold (5 °C) buffer solution and were then slowly warmed to room temperature. The first full slice was stained with 2,3,5-triphenyltetrazolium chloride (TTC, 2.5 mg/5 mL) to visually locate the area and size of the infarct within minutes after slicing (Fig. 1) (Isayama et al., 1991). Next, sections of brain were sliced and movement was recorded under a time-lapse video microscope using an infrared filter. Subsequent slices were incubated with the FITC-conjugated isolectin B4 (ILB4-FITC; Boehringer Mannheim) at a dilution of 1:100 for 30 minutes at 37°C to label all cells of the mononuclear phagocytic lineage. The microglia and leukocyte population was visualized before patch-clamp recordings. Endothelial cells of the blood vessels were also labeled, thus making it possible to measure the distance of the ILB4-labeled cells from the vessels. Colabeling of ILB4 with astrocytic and neuronal markers indicated that only microglia and the blood-borne leukocytes were stained with ILB4. For electrophysiologic recordings, slices were placed in a chamber mounted on the stage of an upright microscope (Axioskop; Zeiss, Oberkochen, Germany) equipped with 40× water immersion objective (numerical aperture 0.75) and fixed in a chamber using a U-shaped platinum wire with a grid of nylon threads (Edwards et al., 1989). The chamber was continuously perfused with oxygenated bicarbonate solution. The bathing solution was composed of the following: NaCl 134 mmol/L, KCl 2.5 mmol/L, CaCl2 2.0 mmol/L, MgCl2 1.3 mmol/L, K2HPO4 1.3 mmol/L, NaHCO3 26 mmol/L, D-Glucose 10.0 mmol/L, pH 7.4 at room temperature. The solution was continuously gassed with 95% O2: 5% CO2. The electrodes were filled with a pipette solution composed of the following: KCl 130.0 mmol/L, CaCl2 0.5 mmol/L, MgCl2 2.0 mmol/L, EGTA 5.0 mmol/L, Lucifer yellow 0.1% mmol/L (Fluka, Buchs, Switzerland), pH 7.2, and osmolarity 285 mOsm. Cell somata in the brain slice were visible in normal water immersion optics and could be approached by the patch electrode.
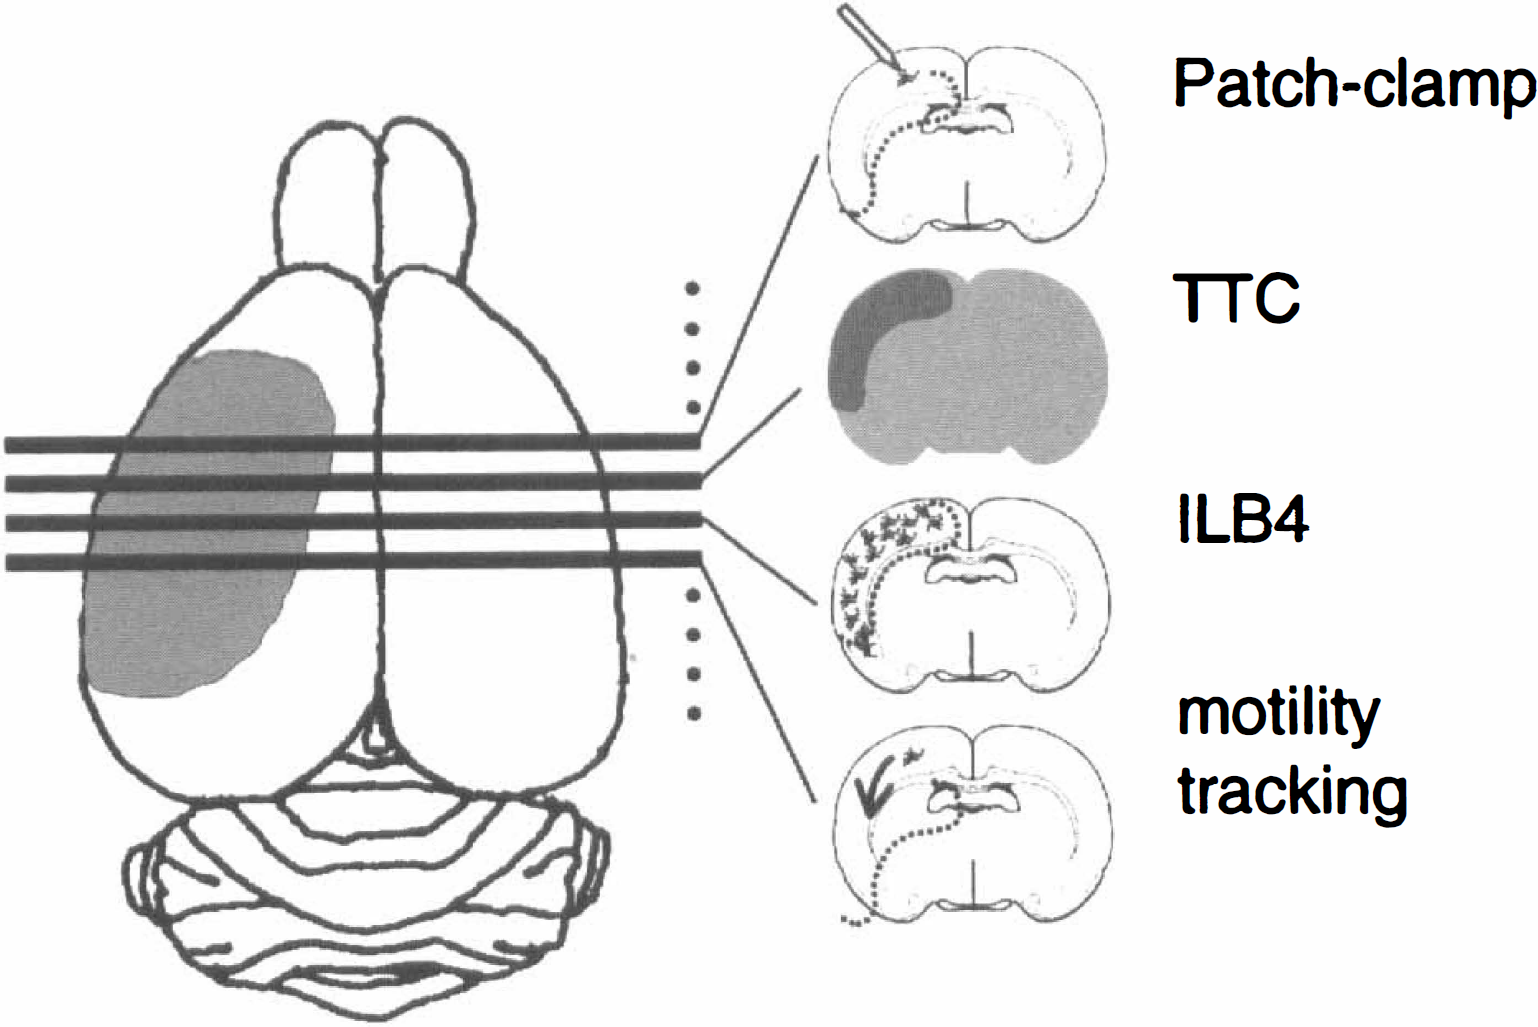
Experimental protocol. As infarcts are highly reproducible, the ischemic area of the brain could be quickly identified visually. Consecutive slices were chosen from sagittal sections through the infarct and identified by a 5-minute live TTC-staining of the first complete slice. The next two slices were set aside for the motility video time-lapse microscopy. The remaining slices were incubated in ILB4-FITC for microglia identification or other markers to identify other cell populations and distributions. Slices selected for patch-clamping were equilibrated for 1 hour in cooled oxygenated artificial spinal cord buffer.
The cells were selected by their ILB4+ fluorescence. Cells were generally located 10 to 30 μm below the surface of the slice. Positive pressure was applied to the recording pipette while it was lowered to the slice under microscopic control. The cellular debris was blown aside and the tip could be placed onto the surface of a cell soma. Membrane currents were measured with the patch-clamp technique in the whole-cell recording configuration (Hamill et al., 1981). Current signals were amplified with conventional electronics (EPC-7 amplifier; HEKA, Lamprecht, Germany), filtered at 3 kHz and sampled at 5 kHz and stored on a computer system using appropriate software (TIDA, HEKA).
In most cases, the Lucifer yellow (LY) filled cells and ILB4+ cells were “volumetrically” scanned immediately on fresh and fixed slices using a confocal laser scanning microscope (Sarastro 2000; Molecular Dynamics, Sunnyvale, CA, U.S.A.) to visualize the three-dimensional morphology. The scanner was mounted on the upright microscope (Axioscope; Zeiss) equipped with a 40× water or oil immersion objective. Optical excitation for LY and ILB4-FITC was at 488 nm of an argon laser and emission at 510 nm. Several horizontal sections of the cells were taken with a vertical scanning step-size of 0.5 μm and a resolution of 512 × 512 pixels. Acquisition of the fluorescence data and image composition was performed using Imagespace (Molecular Dynamics) software. As the LY dye overpowered the ILB4 fluorescein-labeling, an image of the ILB4+ cells was captured before patch-clamp recording.
Rhodamine detection in blood smears
Blood smears were taken from the rat at time of death to confirm rhodamine labeling of leukocytes. In an additional experiment, blood was collected to enrich leukocyte populations by density separation to be plated immediately onto cell culture coverslips for patch-clamp analysis and immunohistochemical characterization. Briefly, 3 mL of blood was collected and added to 1 mL of 2.7% EDTA and 0.9% saline solution. For every 2 mL of this solution, 2 mL of 5 mmol/L EDTA in 0.1 mol/L phosphate-buffered saline was added. This volume was split into centrifuge tubes and 1/2 volume of Lymphoprep (a density gradient solution) added and centrifuged for 15 minutes. The interface layer was removed and washed in DMEM plus 10% fetal bovine serum and centrifuged at 800 g for 10 minutes and plated onto coverslips. Fluorescence of Rhod6G was excited at 530 nm with an argon laser and measured at 580 nm selected with a narrow band filter.
Time-lapse recordings of cell movement in brain slices
Video time-lapse recordings were taken of microglia and leukocyte movements in acute slices on an Axioscope microscope (40× water immersion objective) with infrared filter (>650 μm) with an attached CCD camera connected to a video time-lapse recorder. Brain slices were anchored in the perfusion chamber and continuously perfused by oxygenated bicarbonate buffer at 36°C. Specific areas were targeted for continuous observation under infrared filter for 30 minutes in each area. Movements of cells in a brain slice were recorded in the infarct, the periinfarct region, and adjacent nonischemic cortex regions. The definition of the periinfarct (penumbra) was defined as the region adjacent to the core of the infarct where there was a breakdown of energy metabolism as indicated by the failure to convert TTC to a red formazan (that is, white area). Three investigators evaluated the recordings independently by replaying at different speeds and counting cell movements. Cells were categorized by movement, differentiating those that were motile or mobile. Morphologic characteristics such as size and appearance of “arms” were evaluated. Frame grabber software connected to the recorder allowed us to create montages of cell movement using standard computer programs.
RESULTS
Blood-borne cells invade the cortex within 6 hours after MCAO
Leukocytes were distinguished from the resident microglial cells by the detection of Rhod6G that labels all white blood cell populations in the blood before the MCAO. The percentage of Rhod6G+ cells was approximately 0.5% of the blood cells, which matches the population of leukocytes in normal rat blood. For some experiments, leukocytes were isolated, transferred onto coverslips, and stained by Giemsa staining, Ox 42 (rat CR3 complement receptor), and Rt1B (rat MHC class II) to confirm the specific labeling of the leukocyte population. All cells were positive for these leukocyte markers (not shown) and positively stained with ILB4. In addition, these purified cultures were tested for whole cell current patterns and exhibited inwardly rectifying (IR) and outwardly rectifying (OR) K+ currents (5/5, not shown). Blood smears made from rats at 6 hours after MCAO indicated that the label was maintained with similar fluorescence intensity (Fig. 2.) However, the signal needed to be reinforced with a second injection of Rhod6G at 12 hours after surgery to maintain the dye in the bloodsmears at 48 hours after MCAO (Figs. 5C and 5D). The population of Rhod6G+ cells in the blood smear did not significantly change during the time course of the experiment.
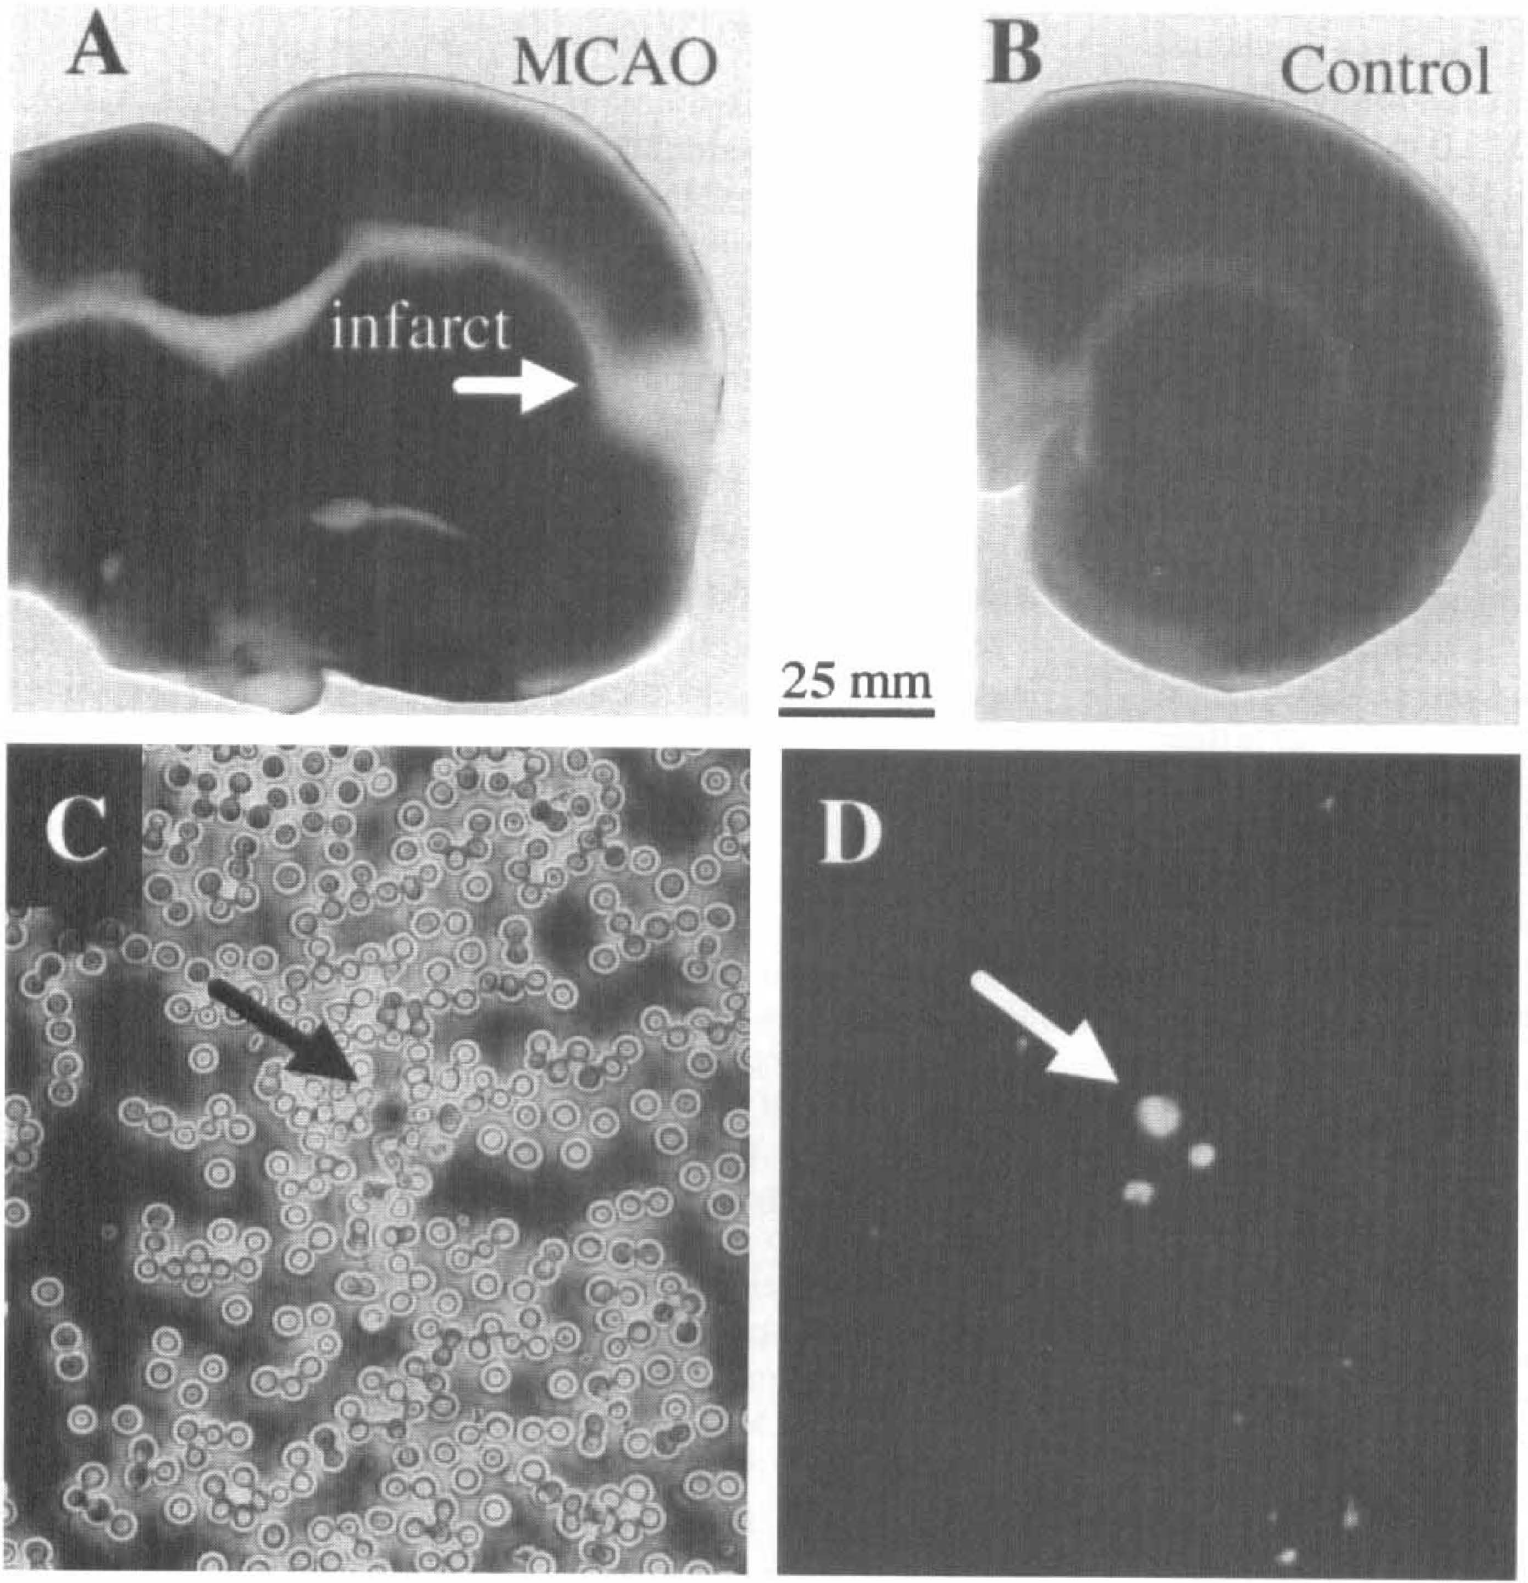
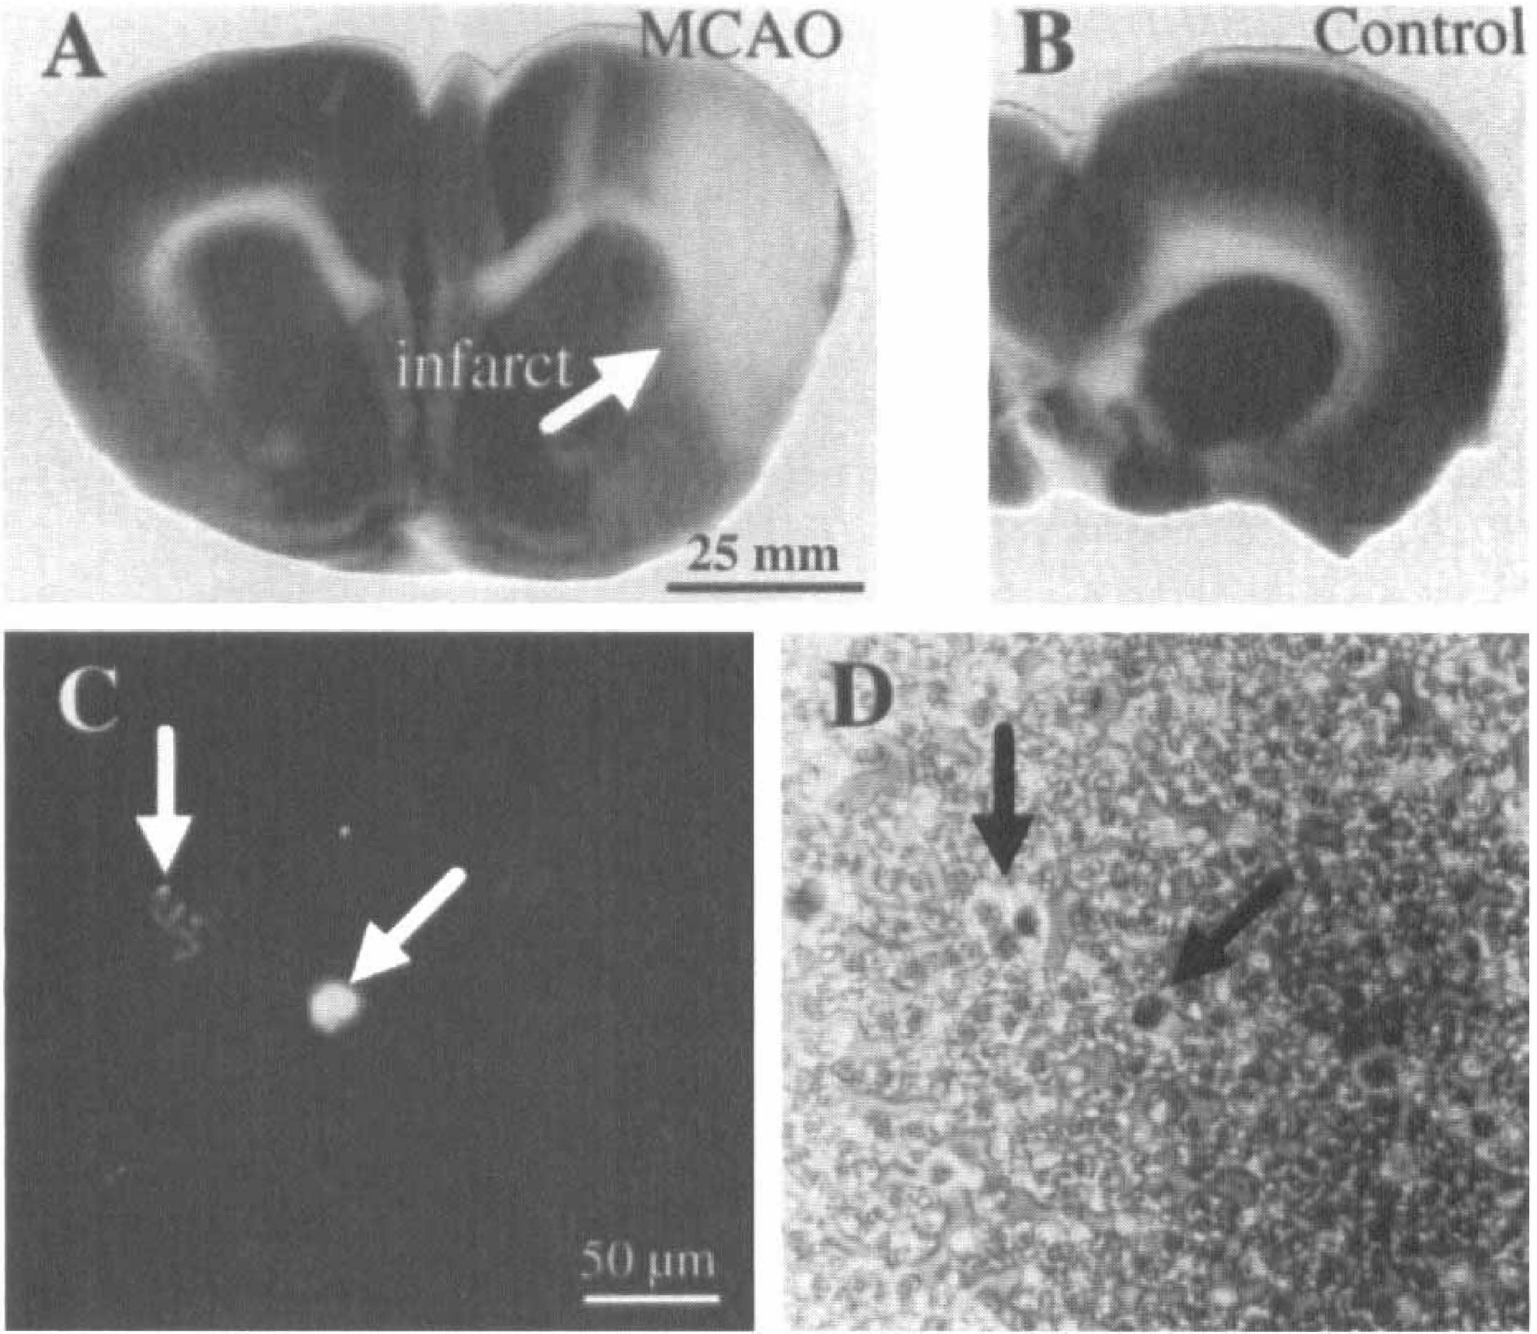
At 6 hours after middle cerebral artery occlusion (MCAO), the infarct is identified by the absence of TTC stain as indicated by the white arrow in
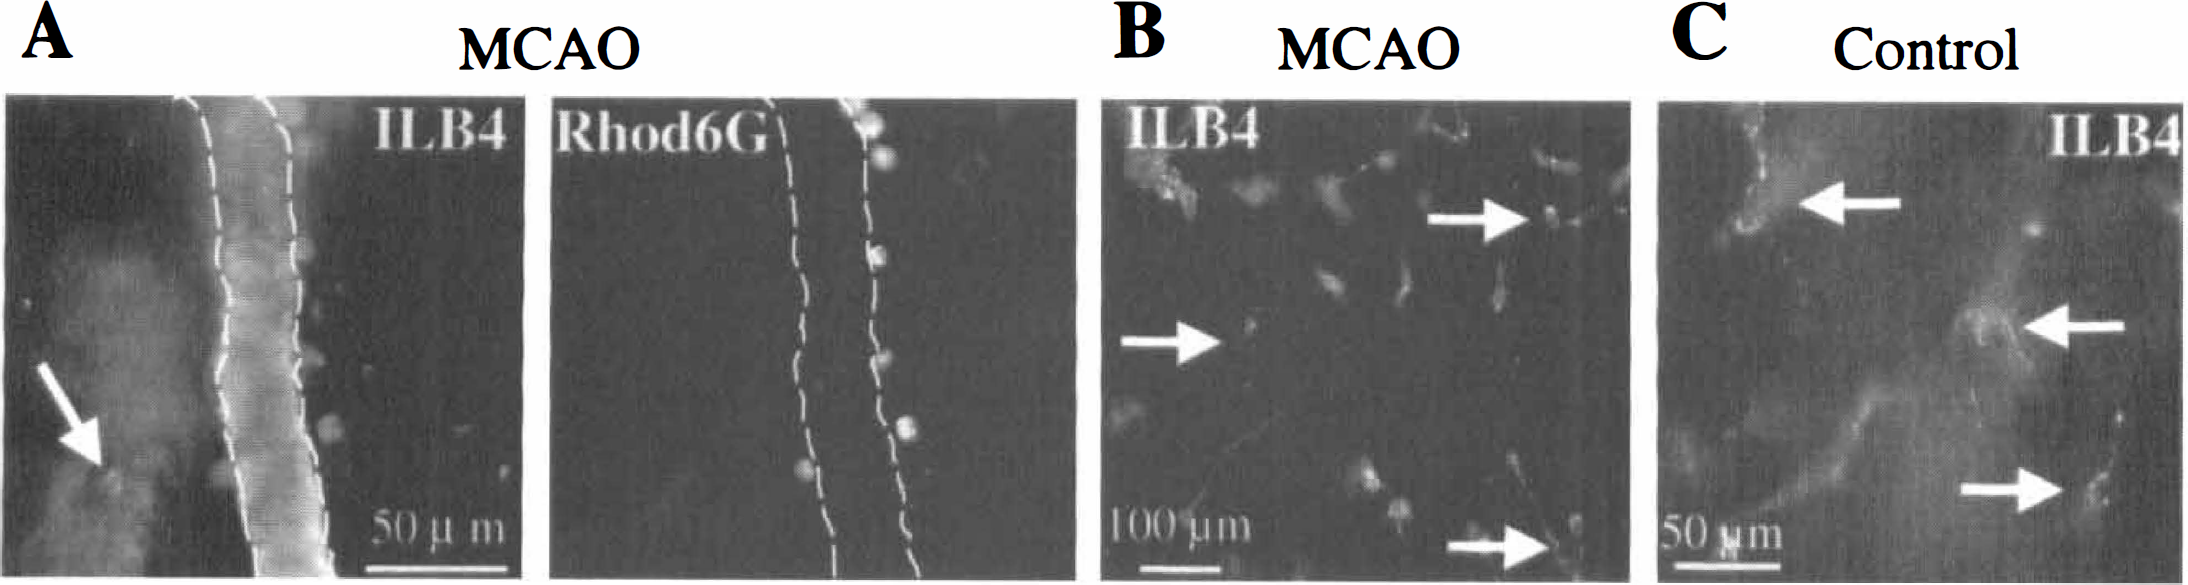
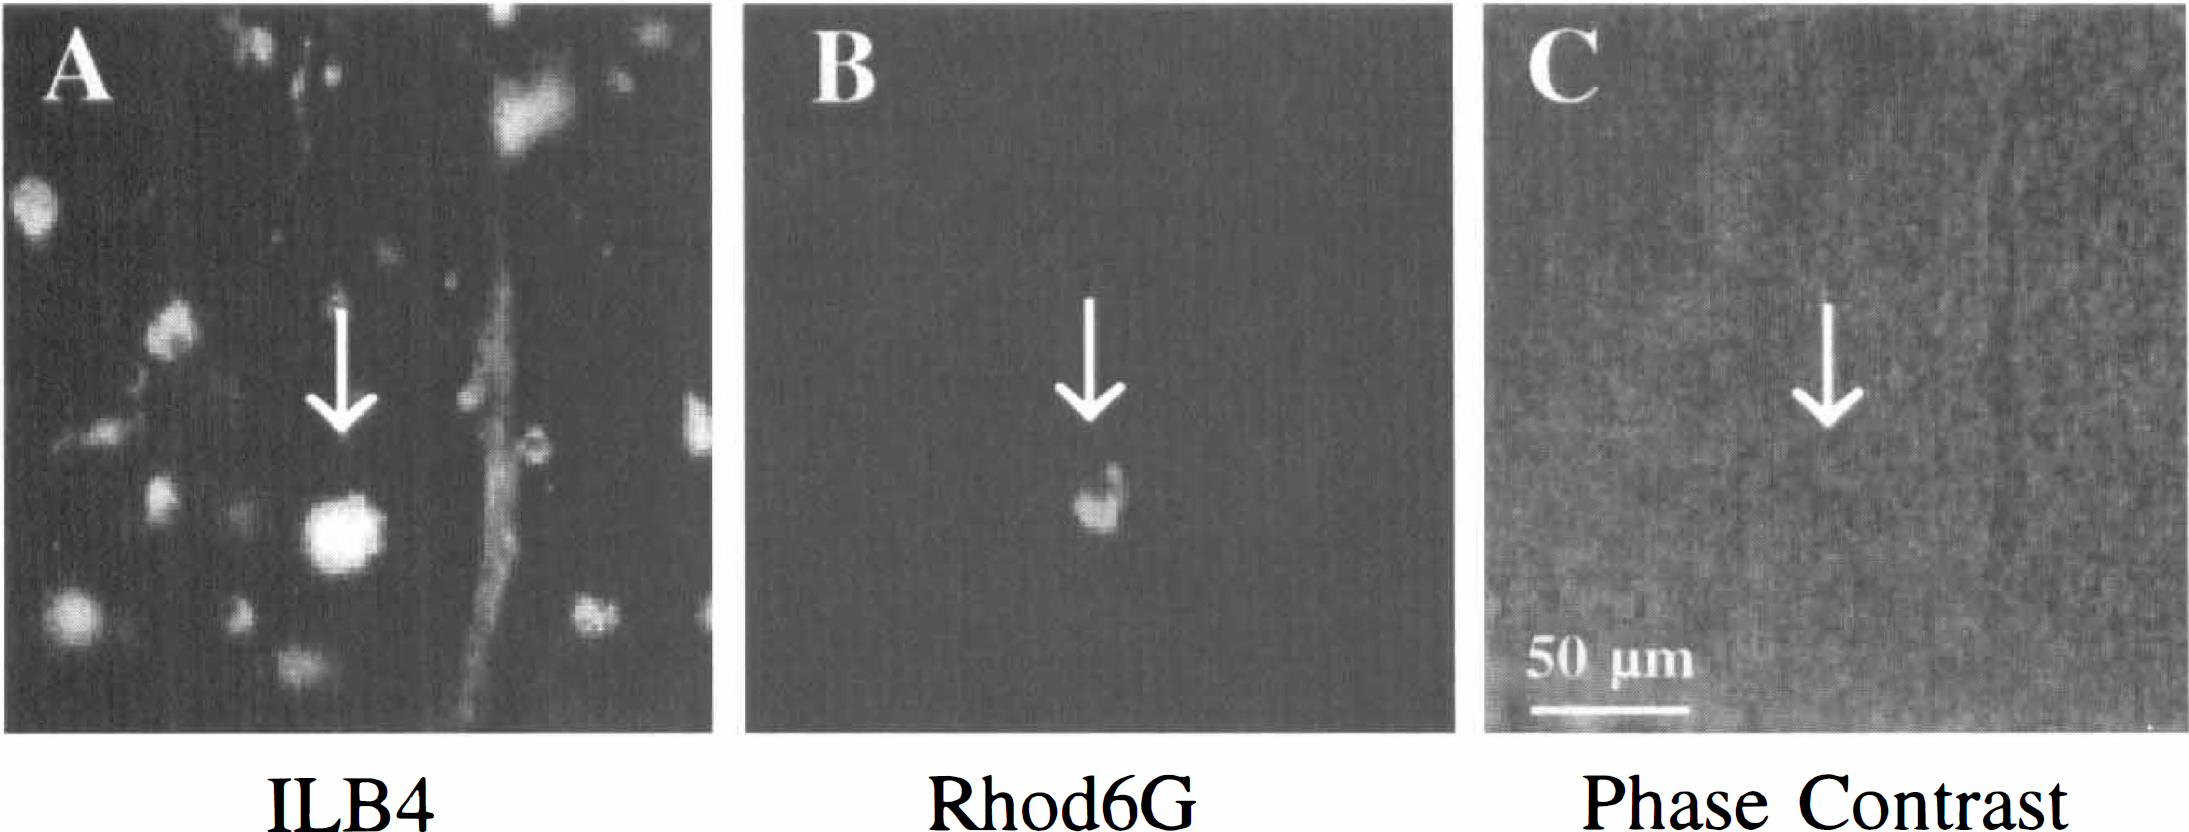
The infiltration of leukocytes into the brain parenchyma was studied by cutting a series of approximately 10 consecutive slices (150 to 200 μm) and performing a series of experiments on each experimental animal. The extent of the infarcted area was determined by staining the first slices from the series with 2,3,5-triphenyltetrazolium chloride (TTC, Figs. 2A and 2B). This live dye is excluded from white matter tracts and dead cells. Because ILB4 labels all leukocytes and microglia, the infiltrating ILB4+ leukocytes were distinguished from the ILB4+ microglia (both activated and resting) and endothelial cells by their positive label for Rhod6G as shown in Fig. 3. Leukocytes were larger than resting microglial cells and were round-to oval-shaped at 10 to 20 μm in diameter without apparent processes (Figs. 3A and 3B). Most of the ILB4+/Rhod6G+ cells were close to the surface of the vessels (Figs. 3A and 3B) while a few ILB4+ cells were found up to 50 μm from the nearest vessel (left arrow in Fig. 3C). The ILB4+/ Rhod6G+ cells were found only in the hemisphere of the infarct, specifically in the periinfarct region with few or none in the core of the infarct.
ILB4+ (
In control experiments, Rhod6G+ cells were not found outside the blood vessels in animals after 6 hours sham-MCAO operation (not shown), whereas Rhod6G+ leukocytes could be identified in the blood smears (see Figs. 2C and 2D). Moreover, control slices contained ILB4+ microglia with highly ramified morphology (Fig. 3C).
Intrinsic microglia show morphologic changes and population increases after 6 hours MCAO
ILB4+ microglia and leukocytes (peripherally-labeled with Rhod6G) present in slices were analyzed according to location, numbers, and morphologic characteristics after 6 hours permanent MCAO. The population of ILB4+/Rhod6G− cells within the brain parenchyma exhibited a more ramified morphology with thin processes, similar to that described for resting microglial cells (compare Figs. 3B and 3C). The population of the Rhod6G cells exhibited the morphology of ramified microglia and could thereby be distinguished from the population of Rhod6G+ cells.
There were more microglia present in the infarct than invasive leukocytes. Ten equal areas from five MCAO animals and control were compared for the ratio of blood-borne leukocytes to brain-derived microglia. Microglia outnumbered the leukocytes (n = 5 animals, 18 ILB4+/Rhod6G− to 12 ILB4+/Rhod6G+ cells; ratio of 1.48 ± 0.11). This also indicated an increase in the number of microglia at the lesion site; only a few microglia per field (ILB4+ /Rhod6G− cells) were observed in the control hemisphere or in sham-operated control rats. In these control animals, Rhod6G+ cells were restricted to the lumen of the larger blood vessels. When inspecting the periinfarct region of the same five animals, the highest density of ILB4+/Rhod6G− cells could be detected at the border areas of the infarct. Counting ILB4+ cells in 10 equal areas of these periinfarct regions demonstrated that three times more intrinsic microglia were present in areas in the periinfarct compared with cells in noninfarct areas (n = 5 animals, 30 ILB4+/Rhod6G− cells to 8 ILB4+/Rhod6G+ cells: ratio of 3.36 ± 1.5).
Microglia and leukocytes express distinctly different K+ channel patterns 6 hours after MCAO
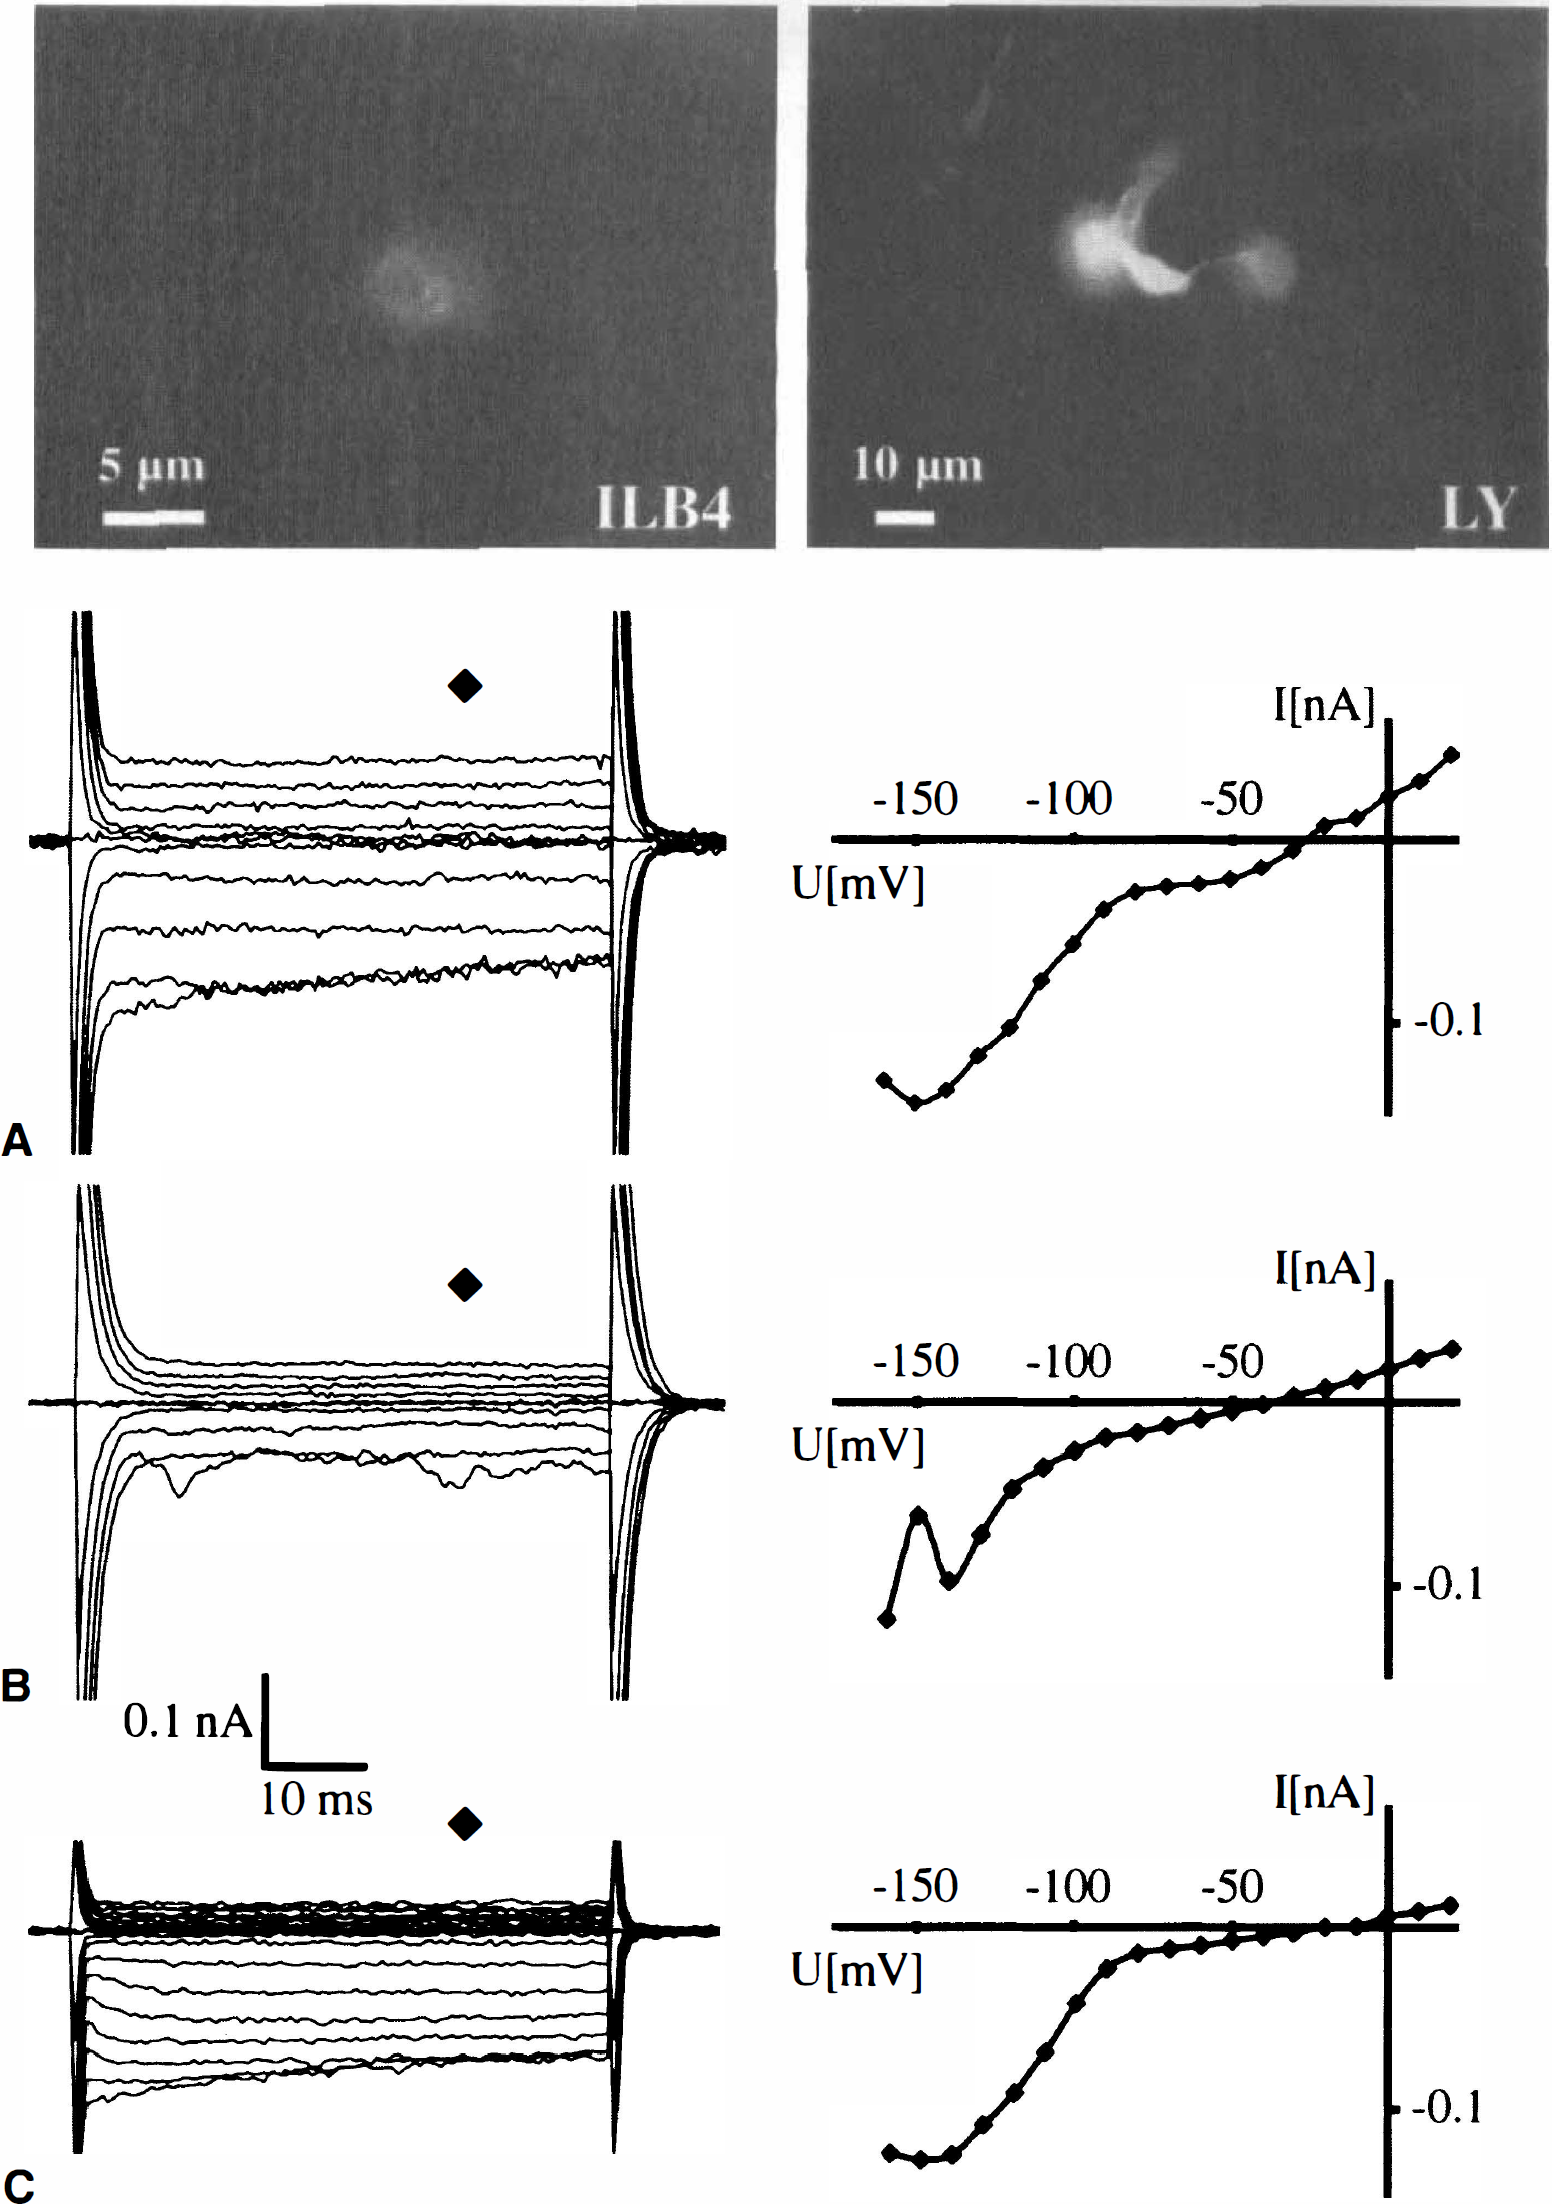
Unstimulated microglial cells in culture are distinct from macrophages with respect to their K+ channel pattern and the additional expression of the OR K+ current is an indicator of microglial activation (Eder, 1998). The authors focused on the damaged periinfarct region to characterize the membrane currents of the ILB4+ cells in the brain slices. The ILB4 staining was documented in individual cells before patch-clamp recording by a snapshot from the CCD camera (Fig. 4A, left). This ILB4+ cell was dialyzed with LY during the membrane current recordings (Fig. 4A, right) yielding a very bright staining at the ILB4 excitation wavelength. The slice was then fixed to document LY and Rhod6G labeling of the recorded cell (not shown).
An ILB4+ (
At 48 hours after MCAO, the infarct is identified by TCC live-stain (
After establishing the whole cell recording mode of the patch-clamp technique, cells were clamped at −70 mV and subsequently depolarized and hyperpolarized to −160 and +20 mV, respectively, with 10 mV increments. In 44% of cells patch-clamped and identified as ILB4+/Rhod6G−, depolarizing and hyperpolarizing voltage steps elicited no voltage-gated currents similar to those described for ramified microglial cells in situ (Boucsein et al., 2000) (n = 8 animals, 8 cells of 18 cells total, Fig. 4B). In the other 56% of the ILB4+/Rhod6G− cells, hyperpolarization induced large, inactivating currents, but the cells lacked outward currents (10 of 18 cells, Fig. 4C). The inactivation was voltage-dependent as described for the inwardly rectifying K+ channels. The resulting current voltage curve for the current trace of the cell in Fig. 4C illustrates the inward rectification of the membrane conductance of the ILB4+/Rhod6G− cells. The average membrane potential was −30 ± 14 mV. This pattern is characteristic of unstimulated cultured microglial cells (Kettenmann et al., 1993) or microglia in the early postnatal slice (Brockhaus et al., 1993).
All ILB4+/Rhod6G+ cells expressed the IR K+ channel and also exhibited depolarization activated currents at a threshold of approximately −30 mV (n = 4, Fig. 4A). In some cells, the current inactivated within the 50 milliseconds voltage step. This current usually showed a delay in activation, characteristic for the delayed outwardly rectifying K+ channel. The average membrane potential was −27 ± 11 mV. This pattern is similar to that described for macrophages (Gallin, 1984).
Microglia populations increase and morphology modifies further at 48 hours after MCAO
Slices containing infarcts were studied at 48 hours after MCAO to analyze the distribution of ILB4+ cells in a later ischemic phase (n = 28 animals). The infarcted area is marked by an arrow in the TTC-stained brain slice (Fig. 5A), whereas the same area in the sham-operated hemisphere shows no infarct (Fig. 5B). Blood smears verified that the Rhod6G label was present in leukocytes (Figs. 5C and 5D). The total number of ILB4+ cells (Fig. 6A) significantly increased in the periinfarcted region 48 hours after MCAO compared with 6 hours. The density of cells, defined by the number of ILB4+ cells counted per equal number and size of areas in each field of interest, tripled after 6 hours MCAO when compared with control. The density of the ILB4+ cells was more than ten times higher after 48 hours than the control (n = 10, 93 cells to 8 cells of control). This increase was primarily because of an increase of the population of Rhod6G- cells (n = 10 animals; 76 ILB4+/Rhod6G− cells to 17 ILB4+/Rhod6G− ratio of 4.3 ± 1.0 cells), indicating that the majority of ILB4+ cells were intrinsic microglial cells. An example of this increase of ILB4+/Rhod6G− cells is shown in Figs. 6A and 6B. The phase contrast photomicrograph (Fig. 6C) reveals a blood vessel in the same field as Figs. 6A and 6B. The Rhod6G+ cells were found further from the vessels when compared with 6 hours after MCAO. For example, the distance from the nearest blood vessel of 21 cells located, 17 were found more than 20 μm from the nearest vessel (see Fig. 6B). Moreover, ILB4+/Rhod6G− cells were no longer characterized by a ramified morphology, but were more rounded in shape reminiscent of ameboid, activated microglia, or leukocytes.
Cells stained ILB4+/Rhod6G− outnumber the ILB4+/Rhod6G+ cells. ILB4 staining
An accumulation of ILB4+ cells could be detected by the demarcation of the cortical infarct in Fig. 7A. The blood vessel structures were deformed and most cells were dead. Not only was a dramatic increase in the number of microglia found in the infarcted hemisphere (Fig. 7B), but microglia were strikingly abundant in the white matter tract near the infarct (Fig. 7C). In 3 equal areas of 1 brain slice, 36 ILB4+ cells were detected in the white matter tract compared with 15 ILB4+ outside of the periinfarcted region. The noninfarcted region hemisphere presented very few microglia (2 cells, Fig. 7D). At the 48-hour time point, the morphology of the ILB4+ cells supported the fact that resident microglia become ameboid after activation. It is interesting to note that the morphology of the microglia in the corpus callosum proper (Fig. 7C) is between the ramified and ameboid morphotypes.
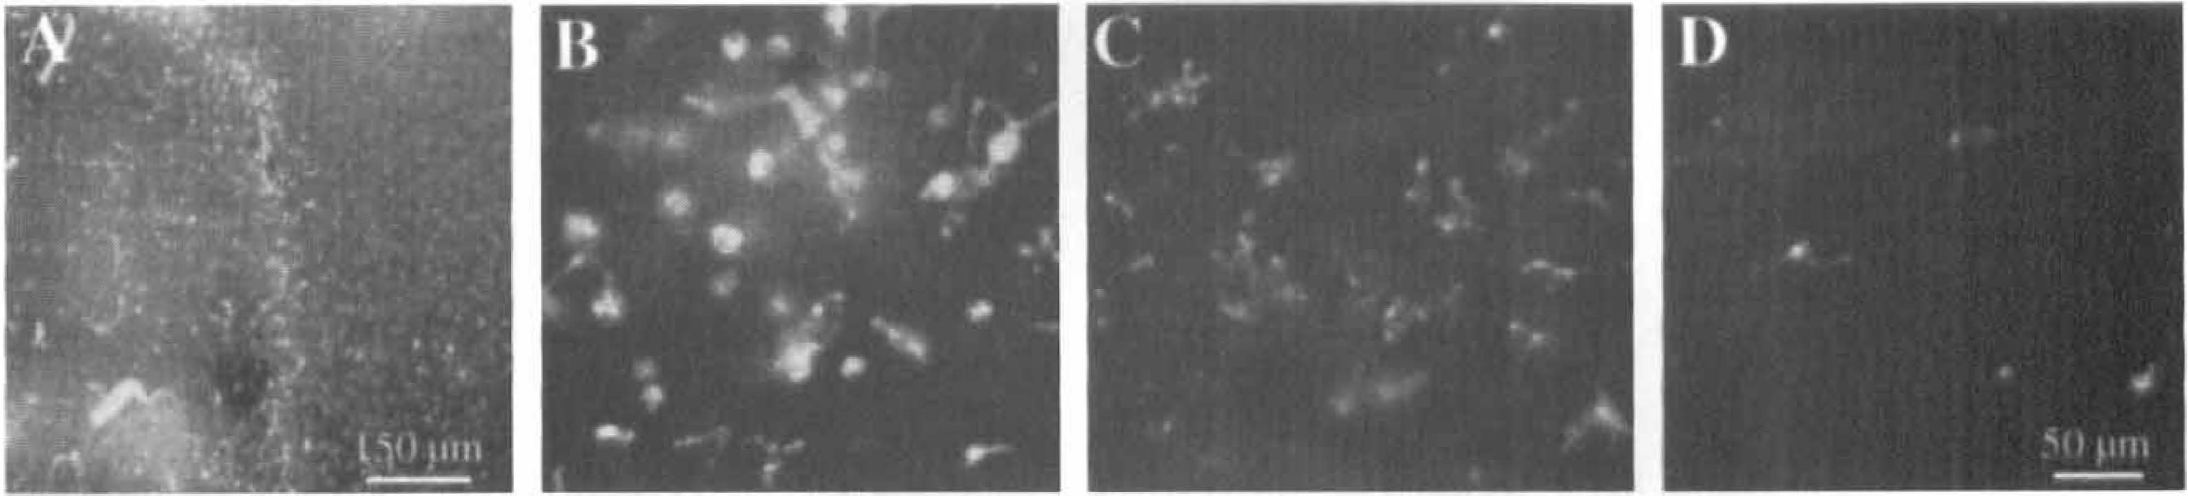
ILB4+ cells of infarct, periinfarct, and surrounding areas indicate a clustering of microglia at the border shown at low magnification
Microglia acquire the activated physiologic phenotype at 48 hours after MCAO
The expression of outward K+ currents in cultured microglia in response to activation has been well documented. Whether this change occurs in microglia in vivo under pathologic conditions has not yet been characterized. The membrane current pattern was investigated for ILB4+/Rhod6G+ and ILB4+/Rhod6G− cells in slices obtained 48 hours after MCAO. The ILB4+/Rhod6G+ cell population exhibited similar properties to the cells recorded in slices 6 hours after MCAO: the membrane was dominated by the inwardly rectifying currents with their characteristic inactivation at negative potentials and by delayed outward rectifier currents (n = 8). In contrast, the physiologic properties of the ILB4+/Rhod6G- population were changed from the 6-hour time point. The majority of cells were electrophysiologically indistinguishable from the Rhod6G+ cells, except they exhibited no Rhod6G staining (Figs. 8A and 8B, upper panel). The cells (n = 46 out of 48 cells of 28 animals) were characterized by the presence of inward and outward currents (Figs. 8A and 8B, middle panel), shown with the corresponding current-voltage curves (Figs. 8A and 8B, lower panel). The outward current activated at potentials positive to −30 mV and inactivated in 50% of cells. Only 2 out of 48 cells showed a strong inward rectification and lacked the delayed rectifying outward currents. The average membrane potential was −30 ± 15 mV (range −75 to −5 mV). This physiologic phenotype correlates to that observed in activated cultured microglia (Draheim et al., 1999).
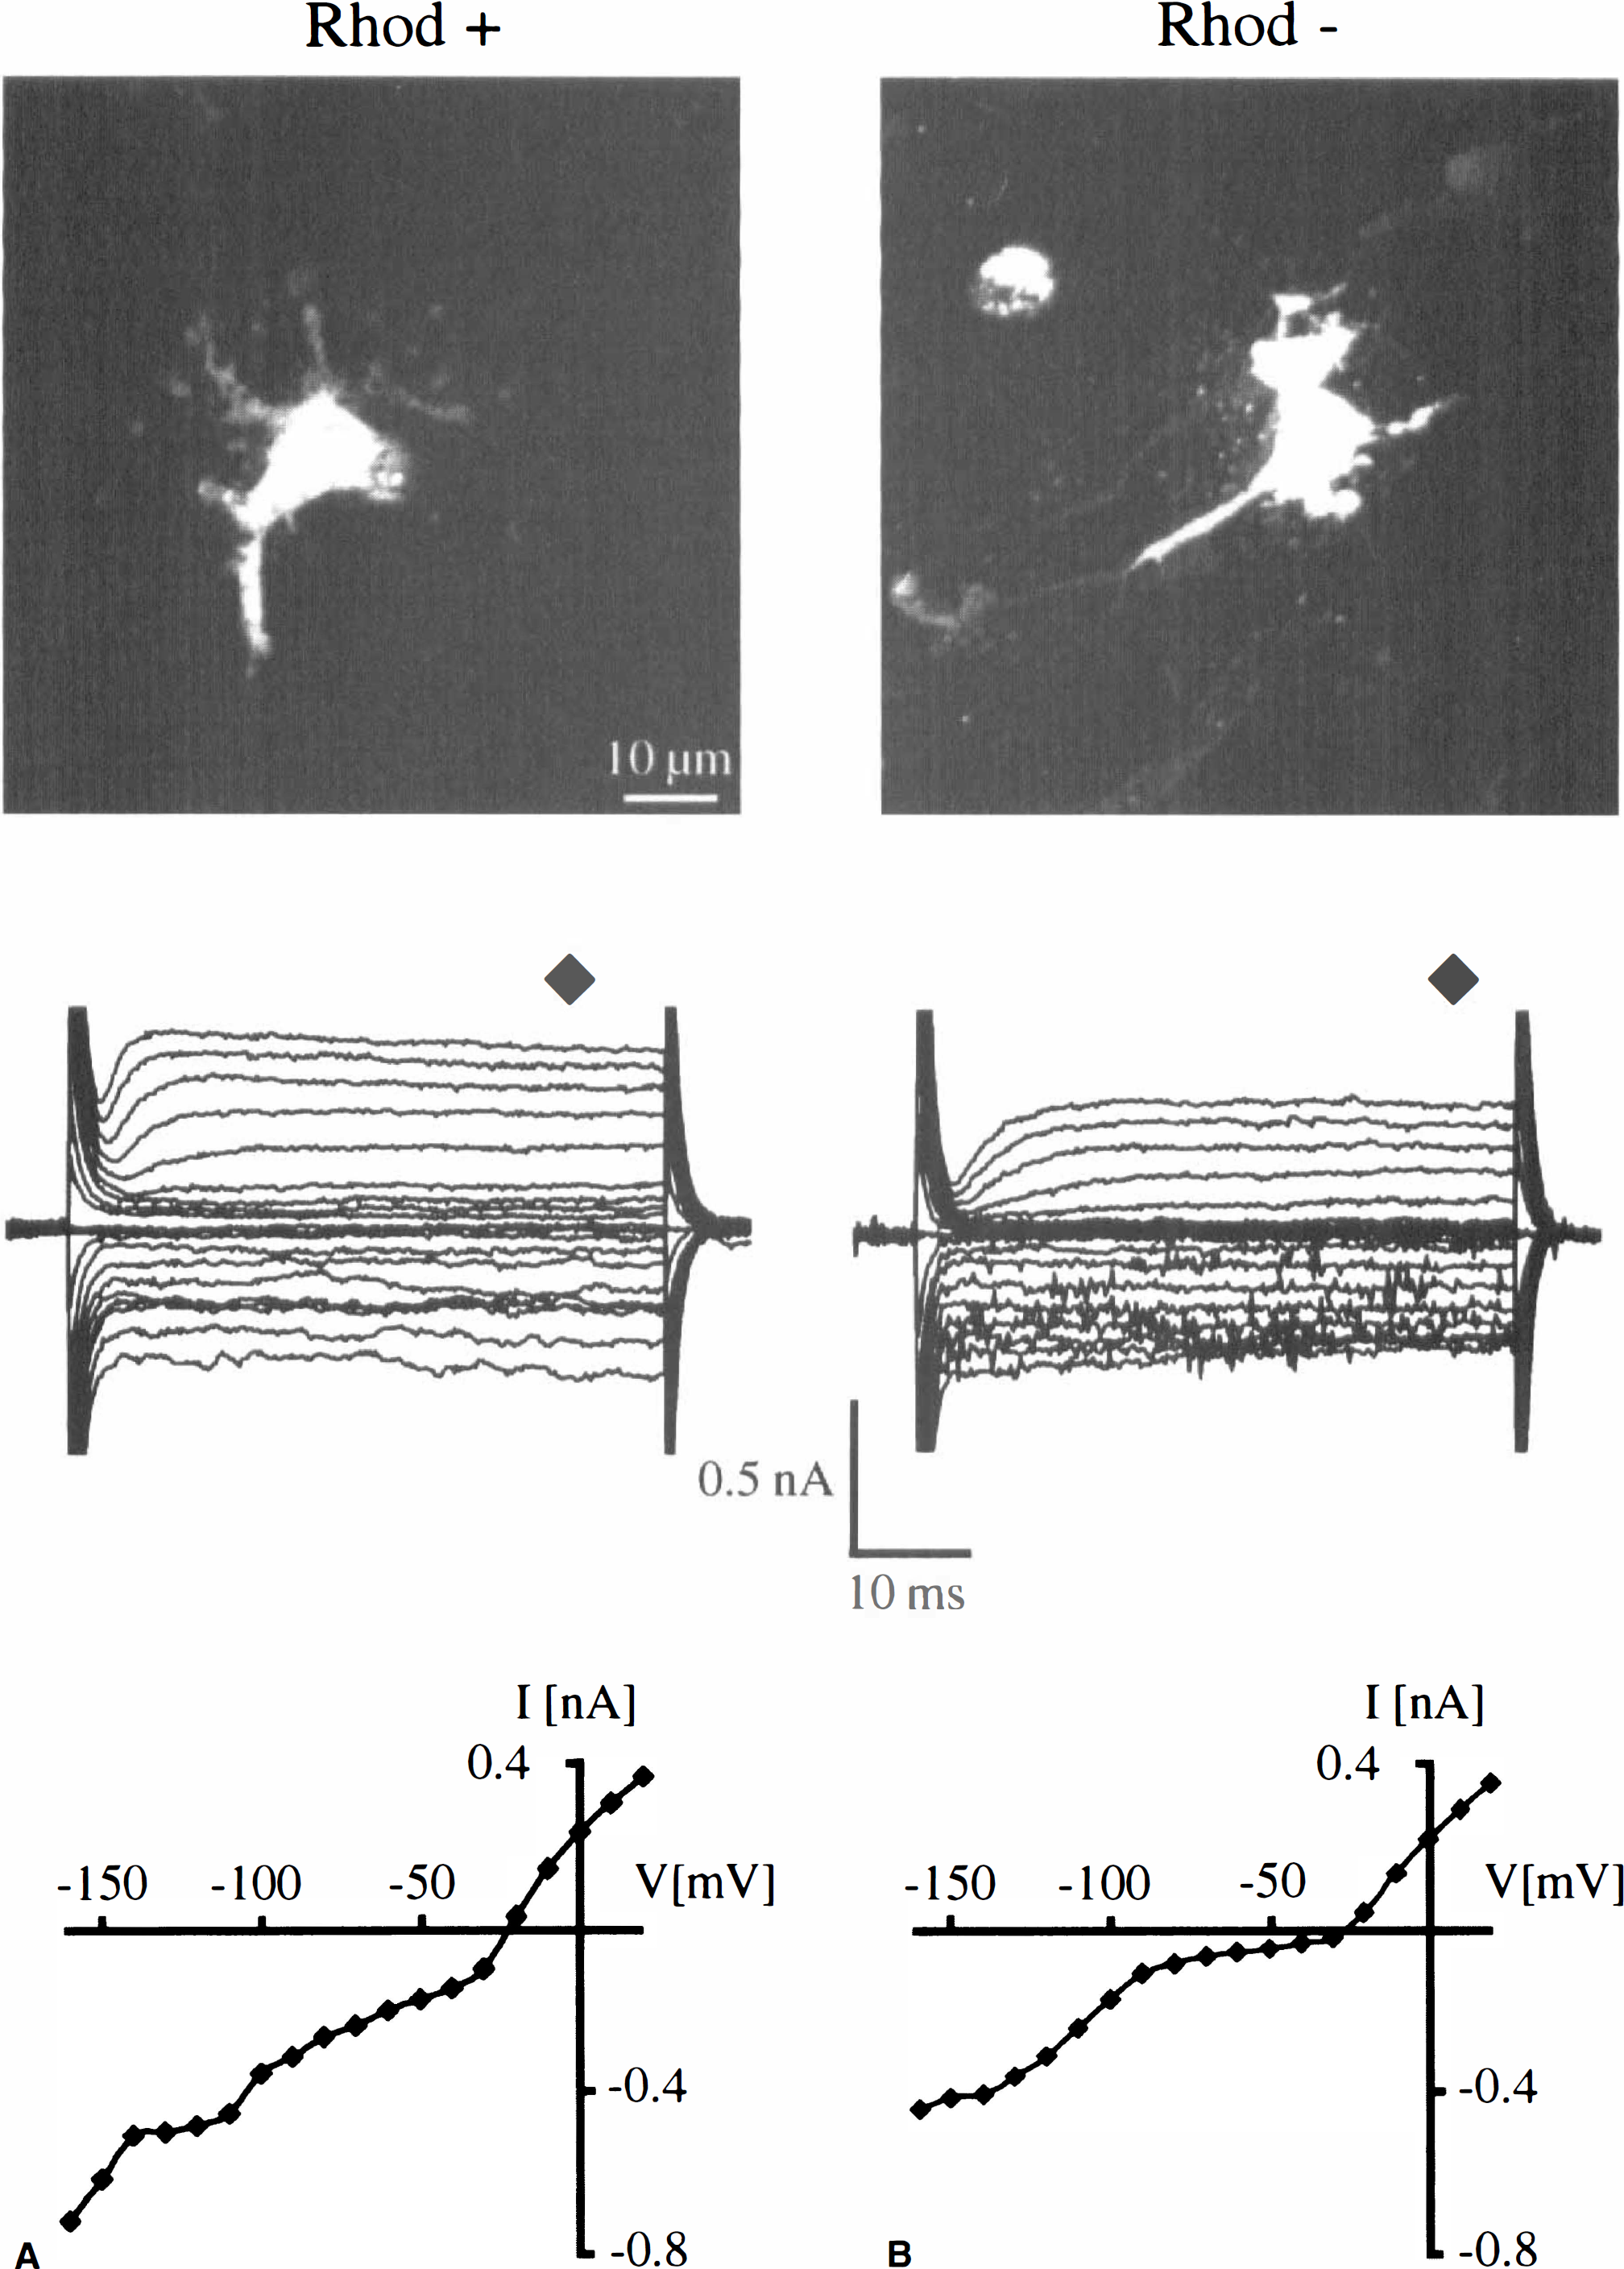
Comparison of previously determined ILB4+ cells (not shown) with and without RhodG6 label
Movement increases with time after MCAO
Invading leukocytes or brain-derived microglia are attracted by a host of signals from dead or dying cells to migrate to the site of injury. In a previous study, ameboid microglial cells were observed developmentally in postnatal brain slices showing a high degree of motility, whereas no such activity could be observed in slices containing only resting microglia (Brockhaus et al., 1993). To analyze movement after pathologic stimulation, videotaped images from brain slices were obtained between 6 hours and 8 days after MCAO and the recordings were observed in the time-lapse mode. In control slices, no movement of cellular elements was observed in any of the areas of interest. At the periinfarct region of the MCAO animals, two types of movement were seen: translocation (mobility) of cells occurred within the parenchyma and movement of cellular processes (motility) from cells that were located at the surface of the slice. Examples of these two kinds of movement are depicted in a series of photomicrographs taken from video clips (see Figs. 9A and 9B). The type and extent of cell movement varied according to time after MCAO. To quantify the extent of movement, three different investigators compared series of images obtained at 6 hours, 48 hours, 72 hours, and 8 days after MCAO. There were fewer cell movements at 6 hours with increasing numbers of movements seen at 48 hours. The greatest activity occurred 72 hours after MCAO with virtually no movements detected at 8 days. A breakdown of the results according to location observed, time points, and number of animals tested is shown in Table 1. The overall movement ratio indicates that the greatest number of cell movements were quadrupled from 6 to 48 hours and increased further at 72 hours. The area of greatest movement is in the periinfarct region both at 48 and 72 hours, but is significantly greater at 72 hours. The movement ratio is determined by dividing the number of moving cells by the number of areas counted.
Summary of movement recordings taken from three target areas of the infarcted brain slice after MCAO
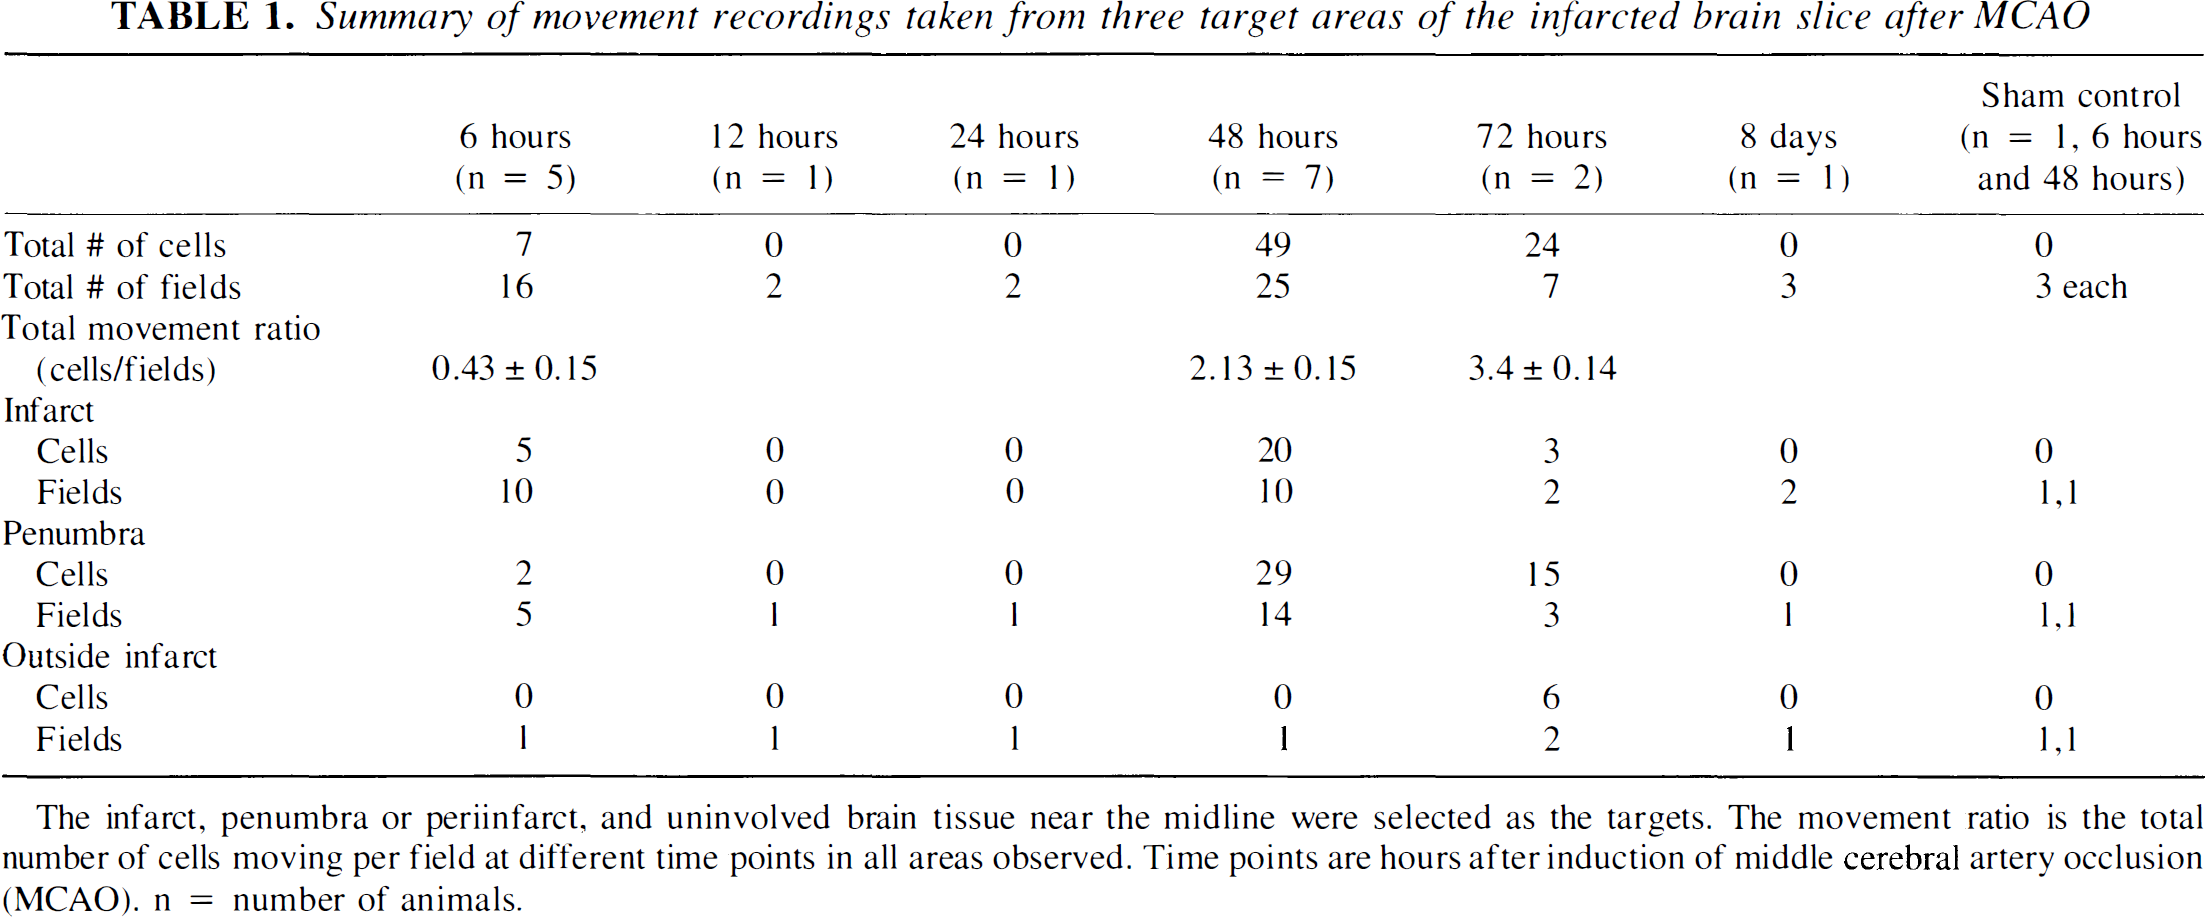
The infarct, penumbra or periinfarct, and uninvolved brain tissue near the midline were selected as the targets. The movement ratio is the total number of cells moving per field at different time points in all areas observed. Time points are hours after induction of middle cerebral artery occlusion (MCAO). n = number of animals.
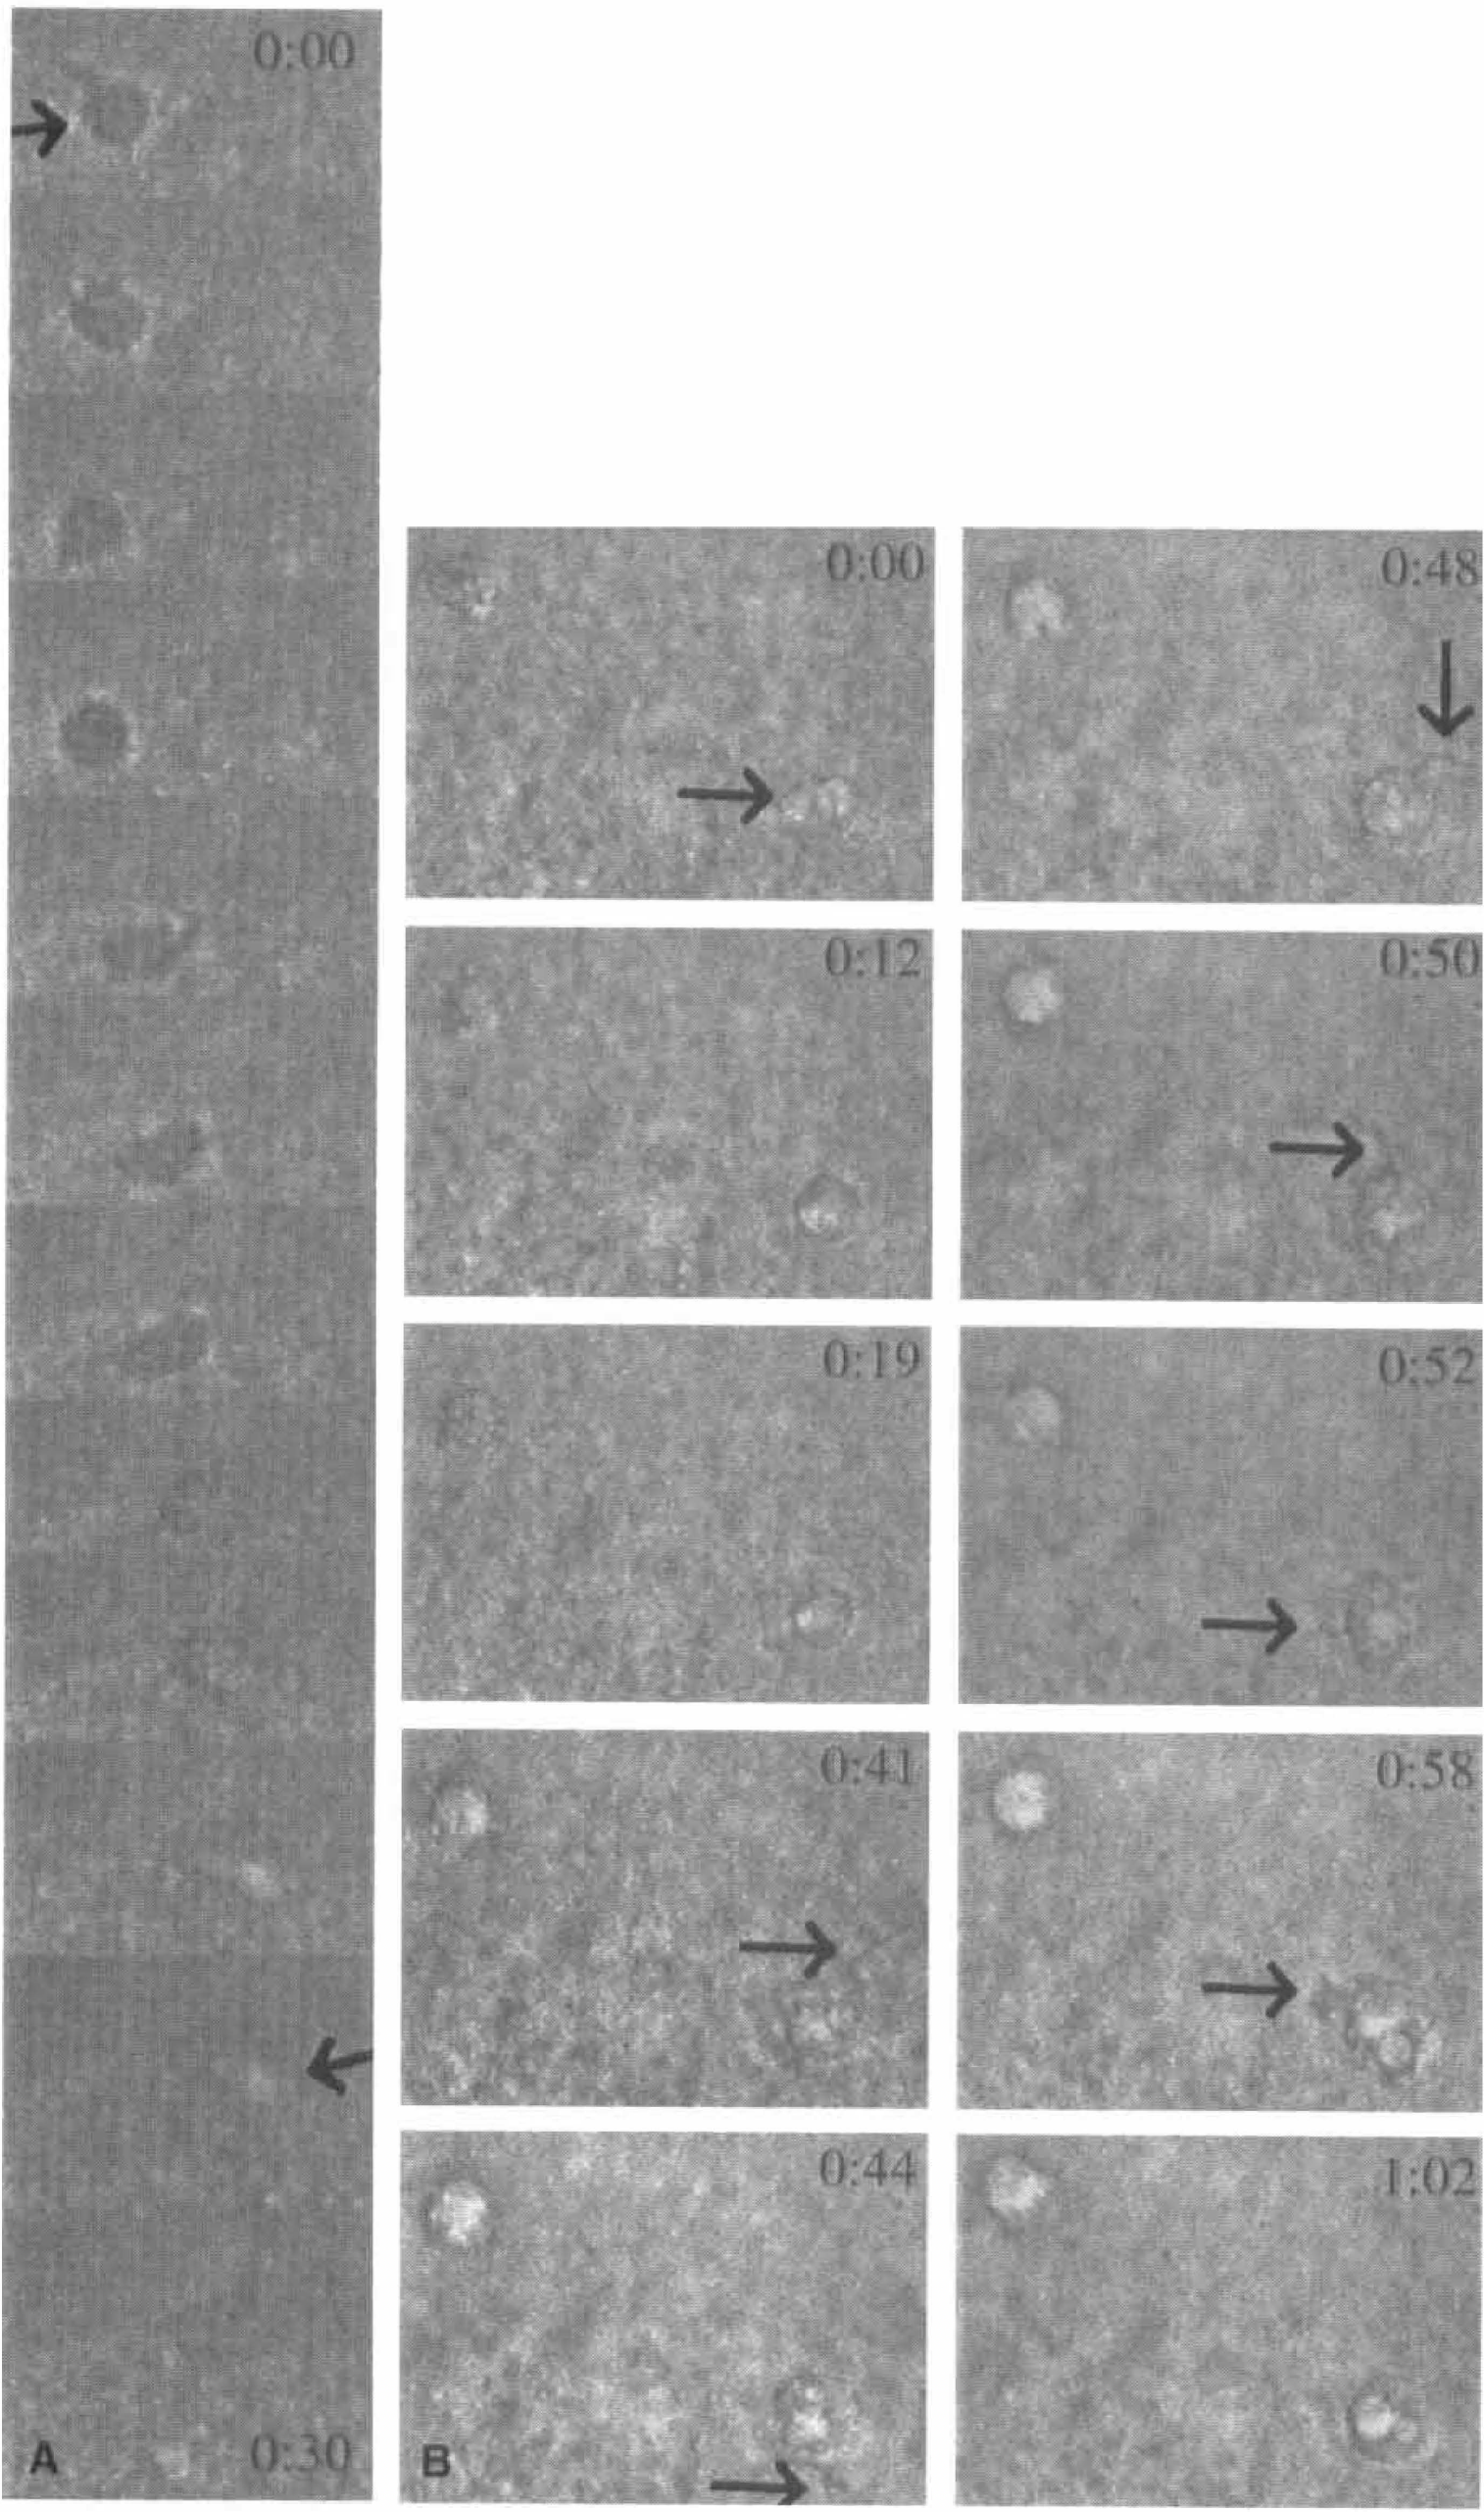
Two series of captured images from video recording demonstrate two kinds of cell movements observed in selected regions of the rat brain after 48 hours of middle cerebral artery occlusion.
DISCUSSION
Histologic studies of animal and human brains after induction of experimental focal cerebral ischemia revealed that microglial cells, or invading leukocytes, or both, accumulate in the border zone of the lesion (Garcia et al., 1994; Gregersen et al., 2000; Zhang et al., 1994). Here the authors used acute brain slices to study cellular properties of intrinsic microglial cells and the invading leukocytes. Moreover, the authors prelabeled the invading leukocytes with one fluorescent marker and were thus able to distinguish invading cells from the intrinsic cells labeled with another fluorescent marker. The authors identified leukocytes invading the brain parenchyma within 6 hours after MCAO, a time point when activation of resident microglia was not yet prominent. Over the next 42 hours, microglia increasingly became activated, particularly in the border zone of the evolving infarct, as evidenced by a change in the cells' potassium current patterns, an increase in microglia numbers, and a change in morphology from ramified to ameboid. Coincident with these changes in membrane currents, cell mobility and motility increased in the border zone of the infarct as recorded by video time-lapse microscopy.
Membrane channel pattern as a marker for microglial activation
The membrane channel pattern of cultured microglial cells correlate with the state of activation. Ramified microglial cells in slices from uninjured brain are characterized with a lack of voltage-gated channels (Boucsein et al., 2000). The majority of microglial cells 6 hours after MCAO exhibited such morphologic and physiologic properties. Cultured, unstimulated microglial cells (Kettenmann et al., 1990), ameboid microglial cells from early postnatal slices (Brockhaus et al., 1993), and ramified microglial cells 12 hours after the peripheral nerve lesion were characterized not by the presence of inwardly rectifying currents, but by the lack of outward currents (Boucsein et al., 2000). The recorded cells and cells identified as microglia 6 hours after MCAO exhibited these physiologic properties but were few compared with other cells present. In comparison, leukocytes including granulocytes, neutrophils, and monocytes have exhibited combinations of both inward and outward currents in cell culture and in situ (Nelson et al., 1992). Forty-eight hours after MCAO, the microglial cells were characterized by the expression of outward currents in addition to the inwardly rectifying currents. These characteristics are similar to cultured microglial cells activated by pathogens such as lipopolysaccharide, cell wall components of gram-positive bacteria, or interferon-γ (Draheim et al., 1999; Fischer et al., 1995; Noerenberg et al., 1993). The activation of the cultured cells triggers the release of a defined pattern of mediators including chemokines, cytokines and growth factors such as TNF-α, IL-6, or MIB-1a (Haslberger et al., 1992; Nakamura et al., 1999). Thus, microglial activation will have a strong impact on the other brain cells or cells invading the brain. This release pattern in cell culture is paralleled by the expression of the outward currents. If this correlation of release and the expression of the outward currents is similar in situ and in culture, it indicates that microglial cells 6 hours after induction of ischemia are not yet as secretorily active as in a later phase. In contrast, the invading leukocytes show the channel pattern of macrophages similar to activated microglial cells in culture at all times examined in vitro, in situ, and in vivo. Indeed, they are thought to be “activated”in vivo as they circulate through the blood and tissues. Two to three days after MCAO, the microglial cells are in the physiologic state of activation and it can be assumed that these cells are at least as secretorily active as the stimulated cultured cells. It is even likely that the change in the channel pattern is a prerequisite of microglial activation. In oligodendrocytes, Schwann cells, and T lymphocytes, the K+ channel pattern is linked to the proliferation of cells (Chiu and Wilson, 1989; deCoursey et al., 1984; Ghiani et al., 1999). For microglial cells, Pyo et al. (1997) showed that NO release, one of the functional consequences of microglial activation, was reduced to less than 50% in the presence of 4-aminopyridine, a blocker of outward K+ currents. Thus, the microglial channel pattern could serve as an activation marker for live microglial cells.
Movement of cells
For technical reasons, the authors could not discriminate between microglia and leukocytes when studying cell movement. However, they did find at the beginning of leukocyte invasion, namely with the first 6h, only a few large cells with high motile activity. Forty-eight hours after MCAO, when most microglial cells were in the activated state, there was a distinct increase in the population of cells with high motile activity. This activity in movement was even higher at 72 hours after MCAO. Consequently, the authors correlated that it is the number of microglia, not invading leukocytes, that are increasing and that the majority of mobile and motile cells were microglia. This fits nicely when correlated with the results from the cell counts of the ILB4+/Rhod6G+ and Rhod6G− cells in similar areas. Movement was detected equally in the infarct area and in border zone at 48 hours after MCAO, but at 72 hours after MCAO the majority of cell movement was detected in the border zone only. There was significant lack of movement in the nonischemic areas at all time points although the number of labeled microglia had increased in all areas observed in the infarcted hemisphere. As microglial cells are known to migrate to the site of injury, the authors observed those cells that had been activated to migrate to this pathologic site, namely the border zone of the infarct, or had undergone proliferation, or both. The authors observed a surprising increase in the number of ILB4+ cells in the corpus callosum closest to the infarct area. Whether the corpus callosum provides better access to the damaged areas of the brain is not known.
Ischemia-induced inflammation: intrinsic versus extrinsic cells
In the rat model of permanent focal cerebral ischemia used here, a large portion of the infarct evolves within 24 hours with continual changes occurring at other time points. However, in the authors' model treatment with the antiinflammatory agent, aminoguanidine (an inhibitor of the inducible nitric oxide synthase), even when started 24 hours after MCAO, can salvage approximately 30% of the cortex that otherwise would undergo infarction (studied 7 days after MCAO, Wiegand and Dirnagl, unpublished observation;Nagayama et al., 1998). In general, permanent cerebral ischemia is believed to involve inflammatory mechanisms, in particular the invasion into the brain parenchyma of leukocytes, to a much lesser degree than transient ischemia (reperfusion after 60 to 90 minutes). The current findings, in principle, are in agreement with this notion: hematogenous parenchymal cells were prominent only at earlier time points, whereas the microglial reaction was more prominent at later time points. Although the deleterious role of intraparenchymal leukocytes, in particular neutrophils (responsible for free radical burst, phagocytosis, and so on), is undisputed, the role of microglial activation is much less clear. Activated microglia may be as harmful to the tissue as leukocytes, however, they also have the potential to confer protection, for example, by synthesizing antioxidants or even inducing regeneration by producing growth factors. Although the role of microglia in cerebral ischemia remains speculative, the temporal and the spatial activation pattern of microglia found in the current study is compatible with a more protective role of these cells.
Conclusion
The authors have demonstrated that an adult rat MCAO model can be useful to study dynamic physiologic activation parameters of microglia and leukocytes in acute slices of focally ischemic brain. The current findings for the first time give in vivo support to findings from cell culture approaches, linking the activity of microglia to changes in the expression of ion channel conductances. Early signs of staining, movement, and increase in cells numbers confirm the activation and the progressive nature of immunomolecule expression and other activation parameters on activated microglia after an ischemic insult. However, further investigations are needed to substantiate a causal link between enhanced motility and current pattern changes in individual microglia and leukocytes involved in tissue damage processes after focal cerebral ischemia.
Footnotes
Acknowledgements
The authors thank Dr. Christiane Nolte for helpful discussions.