
Abstract
EZH2 inhibition can decrease global histone H3 lysine 27 trimethylation (H3K27me3) and thereby reactivates silenced tumor suppressor genes. Inhibition of EZH2 is regarded as an option for therapeutic cancer intervention. To identify novel small-molecule (SMOL) inhibitors of EZH2 in drug discovery, trustworthy cellular assays amenable for phenotypic high-throughput screening (HTS) are crucial. We describe a reliable approach that quantifies changes in global levels of histone modification marks using high-content analysis (HCA). The approach was validated in different cell lines by using small interfering RNA and SMOL inhibitors. By automation and miniaturization from a 384-well to 1536-well plate, we demonstrated its utility in conducting phenotypic HTS campaigns and assessing structure-activity relationships (SAR). This assay enables screening of SMOL EZH2 inhibitors and can advance the mechanistic understanding of H3K27me3 suppression, which is crucial with regard to epigenetic therapy. We observed that a decrease in global H3K27me3, induced by EZH2 inhibition, comprises two distinct mechanisms: (1) inhibition of de novo DNA methylation and (II) inhibition of dynamic, replication-independent H3K27me3 turnover. This report describes an HCA assay for primary HTS to identify, profile, and optimize cellular active SMOL inhibitors targeting histone methyltransferases, which could benefit epigenetic drug discovery.
Introduction
Histones are subject to a wide array of posttranslational modifications often located at their amino-terminal domains. Changes in chromatin structure, including the addition or removal of histone modifications, play a central role in eukaryotic transcriptional regulation. Unlike the acetylation or phosphorylation of histones, histone methylation can be either activating or repressing transcription. Lysines are subject to multiple methylations (mono-, di-, and trimethylation), increasing the complexity of different histone methylation patterns. Moreover, methylation is a less transient modification, having a much slower turnover rate, comparable to that of the entire histone (e.g., the half-life of H3K27me3 is approximately 3 days, whereas most acetyl groups at the four core histones exhibit a half-life of only a few minutes). 1 In fact, histone methylation was thought to be irreversible before the discovery of the flavin-dependent monoamine oxidase lysine (K)–specific demethlyase 1A (LSD1/KDM1A), 2 the first histone demethylase. The timed regulation of genes is crucial throughout the life span of a cell, with genes active at certain times but inactive at other times. At present, histone methylation is considered a dynamically regulated process and is correlated with the gene activation state. 3 H3K27me3 has been reported to be fine-tuned by the opposing activities of the methyltransferase polycomb-repressive complex 2 (PRC2) and demethylases. The two H3K27-specific demethylases identified to date are the ubiquitously transcribed tetratricopeptide repeat, X chromosome (UTX/KDM6A), and Jumonji domain-containing protein 3 (JMJD3/KDM6B). They enable a dynamic switch between transcriptional repression and activation by active H3K27me2/3 demethylation.4,5
Even though it is under debate whether a true “code” is formed by histone modifications,6 –8 global aberrant patterns of these modifications, leading to gene deregulation, represent one hallmark of cancer. In contrast to DNA mutations, the induced changes in gene expression by histone modifications are, in general, reversible. In particular, histone methyltransferases have been shown to be deregulated by various genetic alterations. 9 The PRC2 complex has been identified as a potential oncogenic driver by the establishment of cancer-specific gene expression patterns. 10 The catalytic subunit EZH2 (KMT6A) is overexpressed in various cancers, most notably in breast and prostate cancers. 10 Moreover, activating mutations within the SET domain of EZH2 at tyrosine 641, alanine 677/687 have been found in lymphoma.11,12 These mutations change the catalytic preferences of EZH2 and generate a genome-wide increase in H3K27me3. 12 They are found especially in germinal center B cells and induce a sustained silencing of PRC2 target genes, inhibit normal differentiation, and promote proliferation and transformation. 13 In addition, overexpression of other PRC2 subunits and loss-of-function mutations in UTX lead to a deregulation of the H3K27me3 pattern. 9 The exact mechanism of how H3K27me3 promotes gene repression is still not understood. Nevertheless, it has been shown that the inhibition of EZH2 is able to decrease global levels of the repressive mark H3K27me3 and, thereby, reactivates silenced tumor suppressor genes.14,15
So far, it has been challenging to develop cell-based assays amenable for high-throughput screening (HTS) and compound profiling to monitor SMOL EZH2 inhibition. Cellular global histone methylation levels are most commonly detected by Western blot analysis or by enzyme-linked immunosorbent assay (ELISA). In addition, quantitative mass spectrometry–based methods are described, enabling an unbiased analysis of also yet unknown histone modifications. 16 Antibody-based cellular assays for the detection of global H3K27me3 levels, which are amenable to HTS, are the AlphaLISA assay (PerkinElmer, Waltham, MA) 17 and the LanthaScreen assay (Life Technologies, Carlsbad, CA). 18 The AlphaLISA assay is a chemiluminescent assay, which uses luminescent oxygen-channeling chemistry. Here, the analyte is captured by a biotinylated antibody bound to streptavidin-coated donor beads and a second antibody conjugated to AlphaLISA acceptor beads. Upon laser irradiation, donor beads and acceptor beads in proximity generate an amplified chemiluminescent signal. 19 The LanthaScreen assay comprises a terbium-based time-resolved fluorescence resonance energy transfer (TR-FRET) technology in conjunction with the Baculovirus-mediated gene transduction of mammalian cells (BacMam) gene delivery system. The used histone H3K27me3 fusion protein with green fluorescent protein (GFP) can be introduced to different cell lines through transient transfection, offering flexibility in the cellular background. 19
However, the described methods detect exogenous levels of epigenetic markers from cellular extracts. Responses are therefore averaged cell population effects and are, due to an additional cell lysis step, less close to the native cellular state. Herein we report the establishment and qualification of a high-content analysis (HCA) assay in HTS-format to characterize SMOL inhibitors of EZH2, enabling high-content screening (HCS) of large-scale compound libraries and lead optimization support.
In contrast to the described cell extract bound methods, an HCA approach enables the measurement of endogenous levels of different histone modifications on the level of a single cell. The assay allows for a multiparametrical design, measuring not only different histone modifications in parallel but also morphologic parameters to accurately assess cellular viability. A robotic screening platform and a sensitive automated confocal imaging system allowed the miniaturization of the HCA assay. Hence, the HCA approach enables HTS and cellular validation of potential SMOL inhibitors for EZH2.
Materials and Methods
Antibodies and Materials
The following antibodies were used: H3K27me1 (07-448; Millipore, Billerica, MA), H3K27me2 (9728; Cell Signaling Technology, Danvers, MA), H3K27me3 (9733; Cell Signaling Technology), H3K27ac (8173; Cell Signaling Technology), H3K9me2 (ab1220; Abcam, Cambridge, UK), H3K79me2 (ab3594; Abcam), H3K4me3 (04-745; Millipore), H3K36me2 (39255; Active Motif, Carlsbad, CA), and total H3 (4499; Cell Signaling Technology). For species-specific fluorescent-conjugated secondary antibodies and whole-molecule goat immunoglobulin G (IgG), DyLight 649–conjugated goat anti–rabbit IgG, DyLight 488–conjugated goat anti–mouse, and ChromePure Goat IgG (111-496-045, 115-486-062, and 005-000-003; Jackson ImmunoResearch, West Grove, PA) were used. Cell culture media, chemicals, and reagents were obtained from the following vendors: Dulbecco’s modified Eagle’s medium (DMEM)/Ham’s F12, RPMI 1640, DMEM, Trypsin (TrypLE Express), Dulbecco’s phosphate-buffered saline (PBS) without Ca and Mg (HEPES pH 7.5), and Hoechst 33342 trihydrochloride, trihydrate (14190) from Invitrogen (Carlsbad, CA); penicillin-streptomycin solution stabilized, L-glutamine solution, bovine serum albumin (BSA), DL-dithiothreitol (DTT), Pluronic F-68, and Triton X-100 from Sigma-Aldrich (St. Louis, MO); FBS Gold from GE Healthcare (Piscataway, NJ); and paraformaldehyde 32% solution EM Grade (15714S) from Electron Microscopy Sciences (Hatfield, PA). Tissue culture 384-well plates, CellCarrier Black, were purchased from PerkinElmer (6007550) and 1536-well plates, µclear black, from Greiner Bio-One (Monroe, NC; 789866). EZH2 tool inhibitor (patent: WO2011/140325A1; name: 1346702-70-2), EPI-0023 and EPI-0009 (patent: WO2007/ 149782A2), and the S-adenosyl-L-homocysteine (SAH) hydrolase inhibitor 3-deazaneplanocin A (DZNep) were synthesized in house.
Cell Culture and Cell Plate Preparation
MDA-MB-231, MCF7 breast adenocarcinoma cell lines, and HeLa S3 cervix adenocarcinoma were obtained from the American Type Culture Collection (ATCC, Manassas, VA). Cell lines were maintained in media conditions recommended by the manufacturer at 37 °C in a humidified atmosphere (5% CO2 and 95% air). Cells were passaged using trypsin when 80% to 90% confluent, and viable cells were counted with the Casy (Roche Innovatis AG, Bielefeld, Germany) and plated 24 h prior to small interfering (siRNA) or inhibitor addition in 384-well plates at 20 µL/well volume and desired cell densities. Ready-to-use cryopreserved cell culture samples, containing 1.5E6 cells per sample, were obtained from CSS Cell Culture Service (Evotec, Hamburg, Germany). For each 1536-well plate, one sample was plated 24 h prior to inhibitor addition at 2 µL/well volume.
Compound Plate Preparation and Compound Addition
All compounds were stored at high-concentration stock (10 mM) dissolved in DMSO at −80 °C. For compound plate preparation, compound stock was diluted in cell culture media to a desired concentration. For IC50 determination, serial compound dilutions were automatically prepared using the Biomek 2000 (Beckman Coulter, Brea, CA). The final DMSO assay concentration was 0.6% at a maximum and was kept throughout the entire assay plate. One compound plate was used for multiple cell plates to ensure similar assay conditions and reduce assay variance. For 384-well plates, 20 µL/well compound was added to the cells to achieve a final assay volume of 40 µL/well. For 1536-well plates, 4 µL/well compound was added to the cells, resulting in a final assay volume of 6 µL/well. For biochemical inhibition assays, serial DMSO dilutions (3.5-fold, 11-point) were previously prepared from 10-mM compound stocks in clear 384-well small-volume plates (784101, 784075; Greiner Bio-One) using a Precision microtiter plate pipetting system (BioTek, Winooski, VT). In control wells, test compounds were replaced by DMSO. Next, 50 nL compound was transferred from the stock dilution plates to multiple “assay-ready” plate replicates using a Hummingbird liquid handling system (Digilab, Marlborough, MA). All plates were sealed with adhesive aluminum foil (PerkinElmer) and stored at −20 °C until final use.
Immunofluorescence, EdU Detection, and DNA Counterstain
Cells were fixed with 4% paraformaldehyde, permeabilized using 0.5% Triton in PBS, and blocked in 1% BSA/PBS containing 0.5% Triton. When necessary, the fluorescently labeled thymidine analogue 5-ethynyl-2′-deoxyuridine (EdU), which efficiently incorporates into newly synthesized DNA, was detected according to the manufacturer’s recommendation (Click-iT EdU and Alexa Fluor 488 Imaging Kit, C10337; Invitrogen). Subsequently, cells were incubated with EZH2-specific or histone-H3-specific primary antibodies in 1% BSA/PBS containing 0.5% Triton for 16 h at 4 °C. Secondary antibodies were diluted in 0.5% BSA/PBS containing 0.5% Triton and goat IgG at 22 µg/mL. After blocking, cells were incubated with secondary antibodies for 1 h at 37 °C. For DNA staining, cells were incubated for 10 min at room temperature using Hoechst at 4 µg/mL. Cells were washed three times using PBS after each antibody or Hoechst incubation step. PBS was added prior to image acquisition. Antibodies and Hoechst were added at a volume of 20 µL/well for 384-well plates and at a volume of 4 µL/well for 1536-well plates. Liquid handling steps were executed using Multidrop Combi Reagent Dispensers (Thermo Scientific, Waltham, MA) or automated stand-alone pipettors (CyBi-Well from CyBio, Jena, Germany) implemented in a fully robotic system.
RNA Interference
Two different siRNAs for EZH2 were synthesized by Qiagen (Valencia, CA; EZH2: siRNA 1 ID SI00063959 and 2 SI02665166), and one negative control siRNA was synthesized by Invitrogen. Cells were transfected with siRNA, 24 h after plating, using HiPerFect Transfection Reagent (301707; Qiagen) according to the manufacturer’s recommendation. At various time points after transfection, cells were subjected to immunofluorescence analysis or harvested for real-time quantitative PCR.
Real-Time Quantitative PCR
Total RNA was isolated following the manufacturer’s instructions using the RNeasy Mini Kit from Qiagen (74104) and reverse transcribed using the High Capacity RNA-to-cDNA Master Mix from Applied Biosystems (Foster City, CA; 4390779) following the manufacturer’s instructions. The obtained complementary DNA (cDNA) was amplified using the following TaqMan MGB probes obtained from Applied Biosystems: Hs00172783_m1 (EZH2), Hs02758991_g1 (GABDH), and 18S rRNA (4319413E) as endogenous control, respectively. TaqMan Fast Advanced Master Mix (4444557; Invitrogen) and a 7900HT Fast Real-Time PCR System (Applied Biosystems) were used according to the manufacturer’s recommendation for gene expression quantification.
Image Acquisition
Image acquisition was carried out using the confocal imaging system OPERA (PerkinElmer). Images were captured using two or three channels—Hoechst stain (DNA), DyLight 488, and DyLight 649 (EZH2 or histone H3 modification-specific staining)—and were analyzed using the MetaXpress software (Molecular Devices, Sunnyvale, CA). Exposure times were chosen for individual experiments to prevent saturation and allow for quantification in the linear range. A minimum of 1000 cells or a maximum of nine field views were analyzed per well using 10× or 20× immersion objectives with a 2-fold binning.
Image Analysis
The image analysis routine was developed using MetaXpress software. For nuclei detection, the standardized image analysis module (“Count Nuclei”) and the DNA-channel images were used. Nuclei boundaries were recognized by setting a gray-level threshold value, which discriminates noise from signal, and a minimum and maximum diameter of the nuclei to be analyzed. By choosing these parameters carefully based on control cells (DMSO or transfection lipid-treated cells), contiguous nuclei were segmented and recognized as single objects while cell debris were counted out of the analysis. The segmented nuclei were filtered for size, shape, and signal intensity to further exclude possible nonviable cells and metaphase nuclei (metaphase nuclei were excluded from the analysis because of their strong compaction resulting in heavily increased antibody signal intensities). For further processing, the segmented nuclei were reduced to binary code (binary object mask), consisting of yes-(signal)- and no-(background)-information. Peripheral pixels were eroded to smooth signal edges, and objects touching the image border were spared from the analysis. To locate EZH2- or histone H3–specific antibody signals to be quantified, the generated binary masks were used to be superimposed over the respective fluorescent signal of the image sets (identical-pixel x/y-coordinates). Signal intensities were quantified and results were exported to a spreadsheet for further statistical analysis. When stated in the experiment, the standardized module (“Cell Cycle”; MetaXpress) was used to classify the cell cycle phases based on Hoechst signal intensity and nuclear morphology. Total numbers of nuclei from the DNA channel were used for describing cell proliferation.
Biochemical SPA Imaging Assays
Inhibitory activities of compounds on wild-type (wt) EZH2 were quantified using a homogeneous scintillation proximity imaging assay (SPA or SPIA). The assay measures specific methylation of synthetic, C-terminal biotinylated peptides (Biosyntan, Berlin, Germany) mimicking the N-terminal tail of histone H3 trimethylated at the lysine residue 27 (H3(1-40)me3K27). PRC2-EZH2 multiprotein complexes (composed by full-length recombinant proteins Flag-EZH wt, SUZ12, EED, and RbAp46/48) were purchased from Active Motif. Used enzyme concentrations were adjusted to fit the assay’s linearity range and varied between 0.5 and 1.0 ng/µL. Two independent compound dilutions (concentrations starting from 0.1 nM up to 20 µM) were tested in duplicate using white 384-well microtiter small-volume plates (Greiner Bio-One). A buffer containing 50 mM HEPES, 2.75 mM DTT, 0.01% BSA, and 0.01% Pluronic was used. First, enzyme and compounds were incubated for 15 min at 22 °C for enzyme-inhibitor complex preequilibration. The methylation reaction was initiated by adding “cold” S-adenosyl-L-methionine (SAM, 0.875 µM; Sigma), tritiated 3H-SAM (0.125 µM; PerkinElmer), and peptide substrate (0.15 µM). The mixture was centrifuged (2 min, 1500 rpm) and incubated at 22 °C for 60 min. Streptavidin PS SPA imaging beads (1.562 µg/µL; PerkinElmer) stopped the methylation reaction, and “cold” SAM (250 µM; AK Scientific, Union City, CA) reduced nonspecific binding. Processed plates were sealed with transparent adhesive foil, centrifuged (2 min, 1500 rpm), and incubated overnight at 4 °C to allow SPA signals to develop. The product amount was measured as energy transfer from the β-particles emitted by the 3H-labeled substrate to the europium scintillator copolymerized in the polystyrene matrix of the PS imaging beads, using a Viewlux (PerkinElmer) CCD plate imaging device (emission filter 613/55 [IFP]). The resulting scintillation counts (proportional to the methylated peptide per well) were normalized using two sets of control wells for “high” (DMSO) and “low” (no enzyme) EZH2 activity controls. IC50 values were calculated by fitting the normalized data to a four-parameter logistic equation (see below).
Data Analysis
Average results were fitted using a four-parameter equation, and the IC50 was determined using GraphPad Prism (Version 5.04 for Windows; GraphPad Software, San Diego, CA). For normalization, cells treated with DMSO or transfection lipid followed by immunofluorescence represented 100% response, while the same cells followed by immunofluorescence with only fluorescent-conjugated secondary antibodies, but omitting primary antibodies, represented 0% response.
Results
Establishment and Qualification of an H3K27me3 HCA Assay
We established an HCA approach to provide a cellular mechanistic and HTS-capable assay that allows for profiling of compounds modulating EZH2 on a single-cell basis. We analyzed individual cells using immunofluorescence detection of endogenous EZH2 and specific histone modifications in combination with Hoechst-stained chromatin. The cells were imaged using an automated confocal imaging platform (OPERA reader; PerkinElmer), followed by image analysis using a MetaXpress-based routine. To validate the assay, we treated HeLa S3 cells with different siRNAs, targeting distinct regions of the EZH2 transcript. We quantified a time-dependent decrease in the EZH2 level directly followed by a reduction in global H3K27me3 to approximately 25% at 4 days after the siRNA-mediated EZH2 knockdown (
Fig. 1A
,
B
). The knockdown efficiency was proven for up to 4 days by a reduced messenger RNA (mRNA) level to at least 30% (
Fig. 1B
). In control experiments, we clearly demonstrated that EZH2 knockdown leads to a significant reduction of H3K27me3 and H3K27me2 but did not significantly affect levels of H3K27me1 and total H3 (
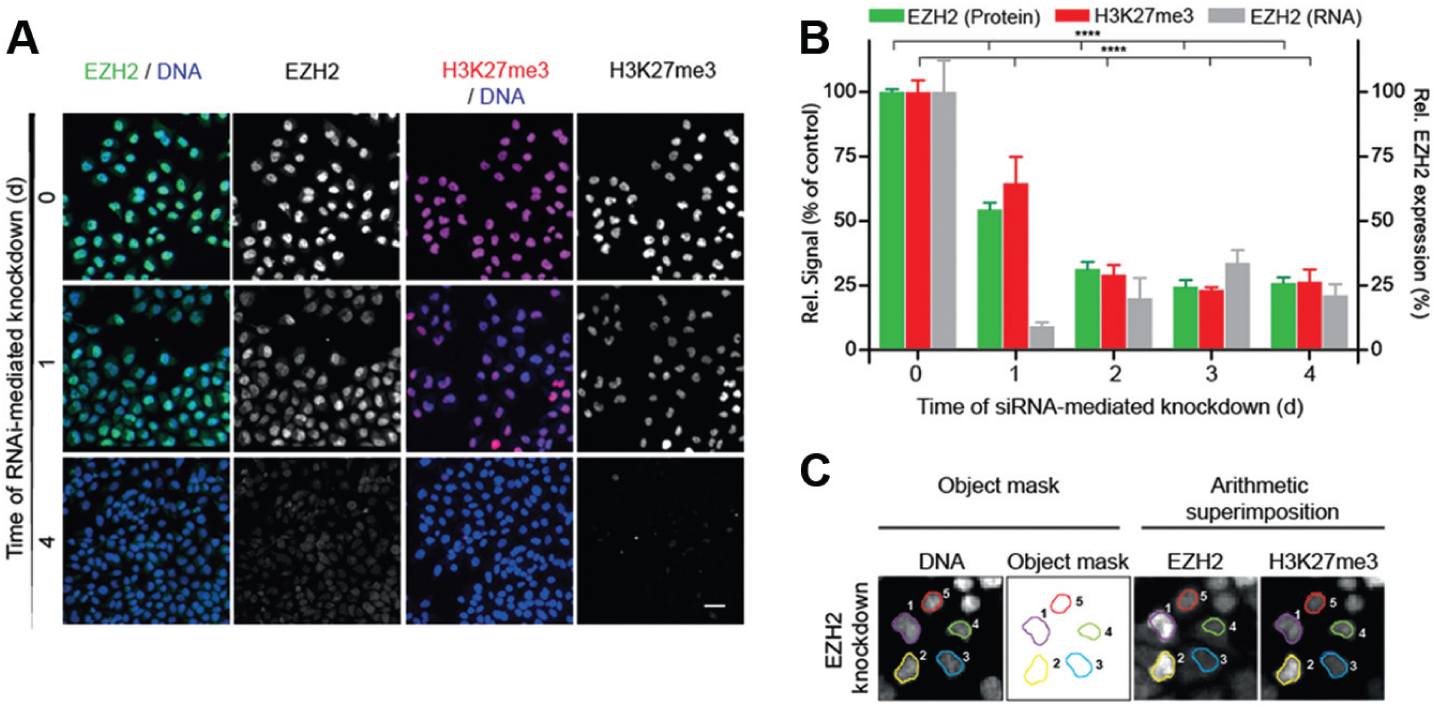
H3K27me3 was directly suppressed in a time-dependent manner after small interfering RNA (siRNA)–mediated knockdown of EZH2. (
For the image analysis, individual nuclei were segmented from the acquired images using a DNA stain. Generated binary object masks were superimposed over the EZH2- and H3K27me3-specific staining of the image set, and the integrated signal intensity level was measured for each nucleus (
Fig. 1C
). Multiplex staining enabled the direct correlation of the level of EZH2 and H3K27me3 for every single nucleus. By monitoring the siRNA-mediated knockdown of EZH2 and its direct effect on the H3K27me3 level, the data demonstrate the functionality of our HCA approach. Moreover, correlation of EZH2 knockdown with a decrease in H3K27me3 emphasizes histone methylation being a flexible and dynamic process. The data were confirmed using an alternative siRNA (
For assay development, we treated MDA-MB-231 cells with a recently published, selective, and cell-active indazole EZH2 inhibitor (the chemical structure is displayed in Fig. 3C ). The potent EZH2 tool inhibitor shows an enzymatic potency of about 4 nM 20 on EZH2. As expected, SMOL inhibition of EZH2 using the tool inhibitor induced a strong time- and dose-dependent suppression of H3K27me3, reducing the global H3K27me3 methylation level to barely detectable amounts at higher inhibitor concentrations (3 µM) on day 3 ( Fig. 2 ). Interestingly, a 6-h treatment reduced H3K27me3 to 75% of the original level ( Fig. 2A ).
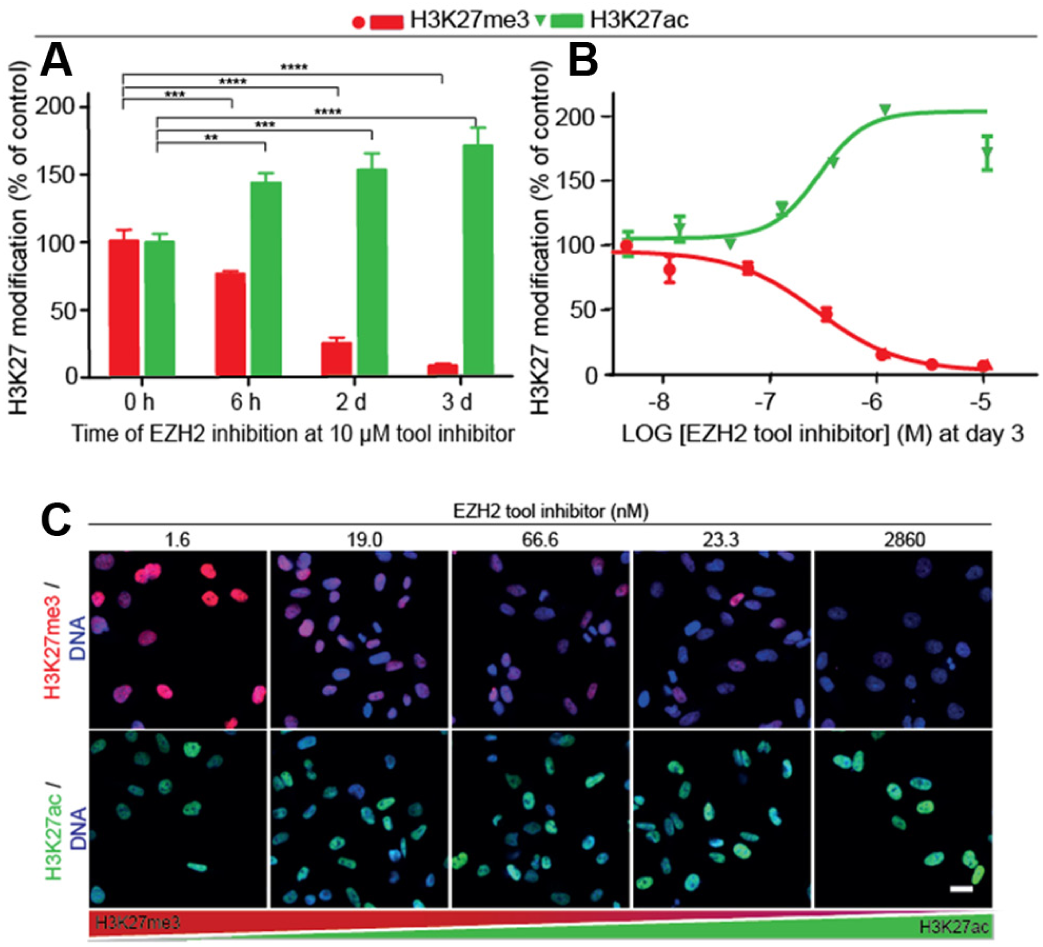
Small-molecule EZH2 inhibition induced a progressive H3K27me3 suppression over 3 days accompanied by a genome-wide modification switch from H3K27me3 to H3K27ac in MDA-MB-231 cells. Cells, treated with the EZH2 tool inhibitor for a maximum of 3 days at 37 °C in 5% CO2, were immunostained followed by image acquisition and image analysis. The graphs show the relative H3K27 modification levels at (
The inhibition of EZH2 at a fixed inhibitor concentration (3 µM) at various treatment times showed an increasing percentage of H3K27me3 suppression with 75% after 2-day and 92% after 3-day treatment (
Fig. 2A
). After 3 days of EZH2 inhibition, an evaluation of the cellular inhibitory activity of the tool inhibitor generated an average IC50 of 30.1 ± 5.65 nM (
Fig. 2B
, determined for at least three experiments). Robustness, reproducibility, and signal variation across different assay plates over longer time periods were assessed through Z′ factor and signal-to-background (S/B) ratio determination for six discrete assay plates. Independent data sets generated Z′ factors between 0.66 and 0.86 and S/B values between 5.2 and 11.1 (n = 6;
In addition, our data display for the first time quantitatively a genome-wide modification switch from H3K27me3 to H3K27ac. This result was demonstrated by a time- and dose-dependent increase in H3K27ac up to approximately 200% of the wild-type almost symmetric to the observed decrease in H3K27me3 (
Fig. 2
) in EZH2 inhibitor-treated cells. Thus, a loss of histone H3K27me3 loci seems to trigger a significant increase of the H3K27 acetylation. These results were confirmed using the cell lines HeLa S3 and MCF7 (
To explore the utility of different compounds as inhibitors of EZH2, we applied the assay setup to quantitatively benchmark their potential to reduce global H3K27me3 levels ( Fig. 3 ). To this end, we treated MDA-MB-231 cells over 3 days with varying concentrations of the indazole tool inhibitors, EPI-0023 and EPI-0009 (two compounds reported early in 2009 to inhibit histone methyltransferases), and the nucleoside analogue DZNep (all chemical structures are displayed in Fig. 3C ). EPI-0023 and EPI-0009 inhibit EZH2 with an enzymatic potency of 3 µM and 25 µM, respectively (targeted histone methyltransferases include EZH2 and PRSET7). 21 DZNep modulates chromatin through indirect inhibition of histone methyltransferases. It hinders S-adenosyl-methionine–dependent reactions by inhibiting S-adenosyl-L-homocysteine (SAH) hydrolase. 22 DZNep has also been used to probe the cellular function of EZH2 and H3K27me3.
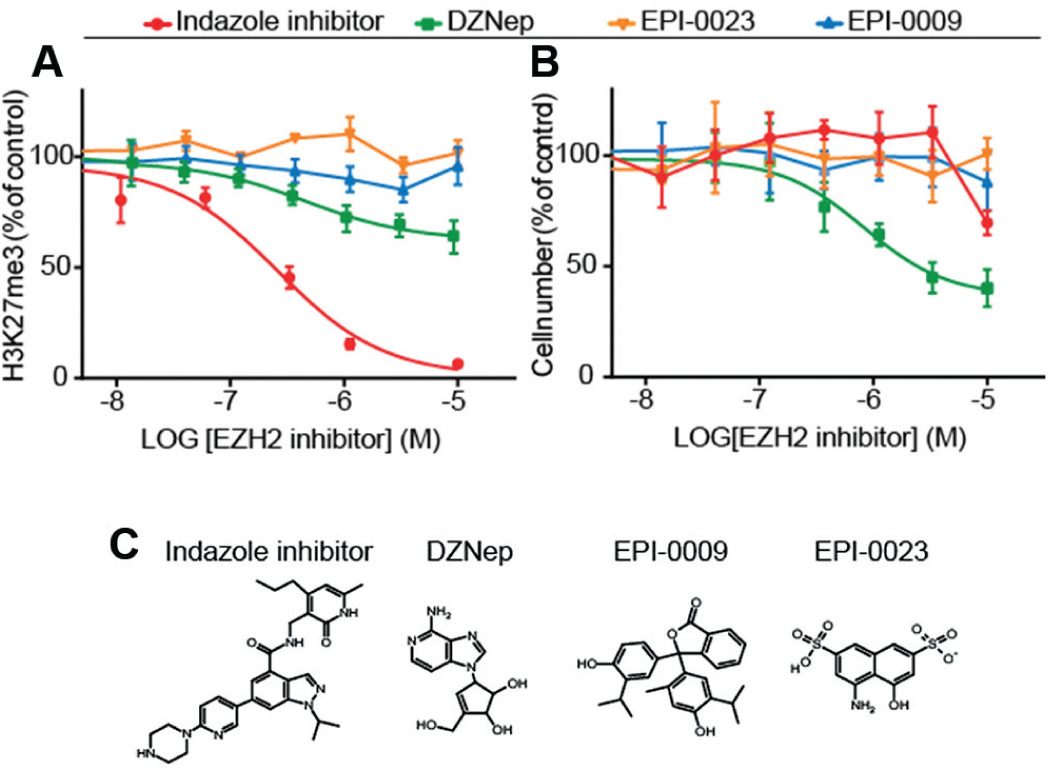
Different EZH2 inhibitors demonstrated distinct cellular inhibitory activity on H3K27me3. MDA-MB-231 cells, treated with varying concentrations of the different compounds over 3 days at 37 °C in 5% CO2, were immunostained followed by image acquisition and image analysis. The graphs show the concentration response of the inhibitors in the relative H3K27me3 level (
As observed in the prior experiment, the tool inhibitor induced a strong dose-dependent H3K27me3 suppression with a reduction in cell number to 60% at the highest inhibitor concentration of 10 µM. DZNep induced a clear dose-dependent reduction in global H3K27me3 to 65% at maximum and induced a dose-dependent proliferative response with some stronger impact, diminishing the cell number to 45%. The two inhibitors, EPI-0023 and EPI-0009, did not alter the level of H3K27me3 globally and also showed no proliferative effect at the tested inhibitor concentrations. Results were confirmed with HeLa S3 cells (
Miniaturization and Automation to Enable HTS of Compound Libraries
To increase throughput, reduce consumable costs, and thus enable large-scale phenotypic screening campaigns of several million compounds, we further miniaturized and fully automatized the HCA assay. To this end, we investigated assay performance while testing the possibility of lowering the assay volume (from 384- to 1536-well format) and adapting the protocol in terms of automation. By applying ready-to-use cryopreserved cell culture samples, reducing the assay volume from 40 µL to 6 µL, and completely automating the assay, we obtained an assay signal sufficient for large-scale screening according to our business rules. For this purpose, we employed a fully robotic system containing incubators, several dispensers, and pipettors for liquid handling, as well as a stacker and robotic arms for plate handling. However, as a consequence of miniaturization and automation, the robustness of the assay lessened from Z′ = 0.67 ± 0.13 to Z′ = 0.32 ± 0.05 (
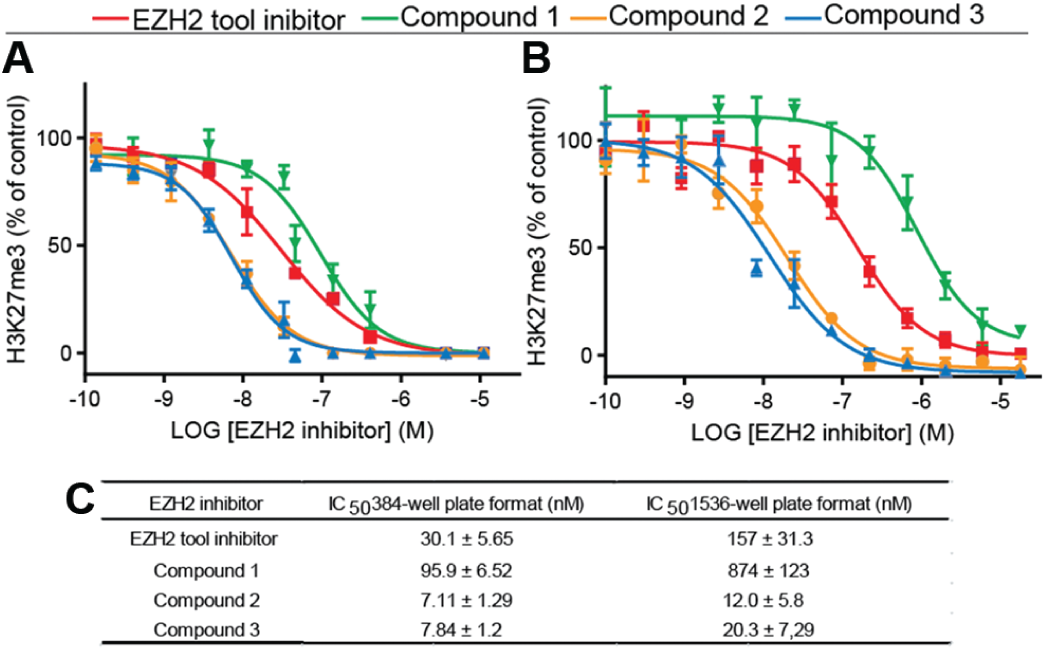
A decrease in inhibitor potency occurred as a result of miniaturization and automation from 384-well plate format to 1536-well plate format with the same order in potency. (
Compound Profiling for SAR
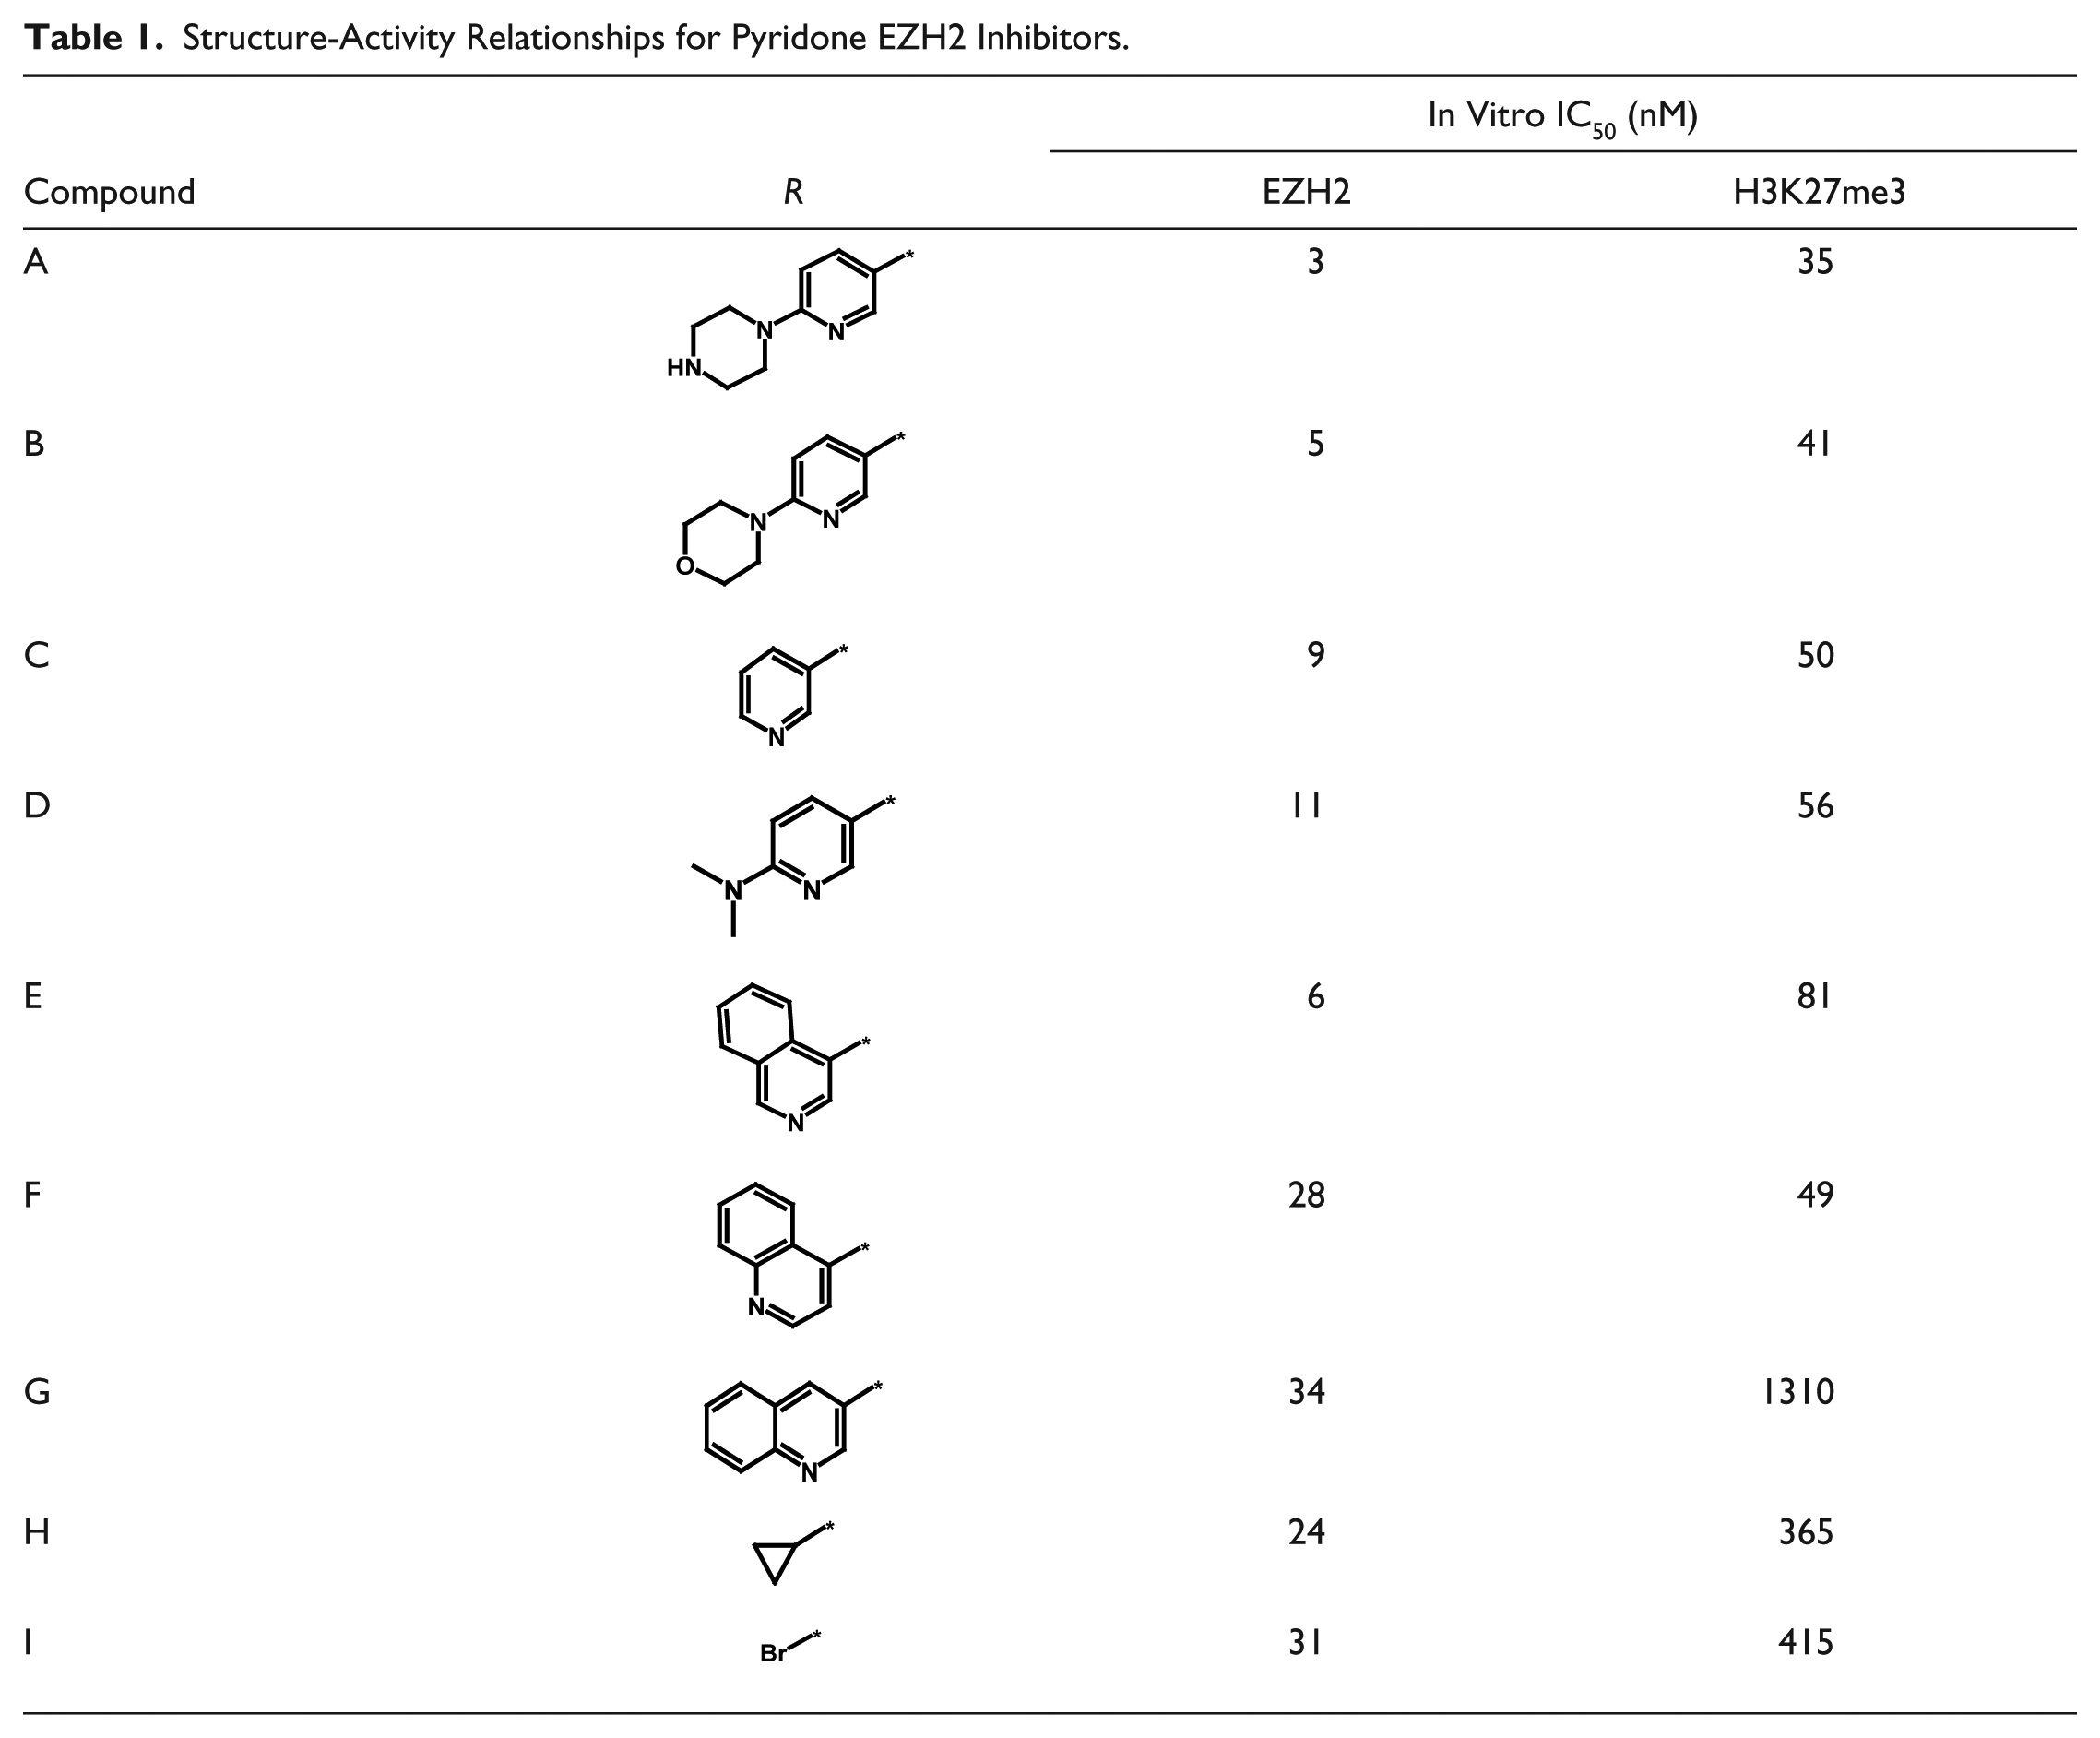
To evaluate the utility of the HCA assay in assessing SAR, we have synthesized and profiled a focused set of SAM-competitive EZH2 inhibitors related to the recently published series of pyridone-containing tool inhibitors. 23 Applying the assay in HTS format allowed us to easily gather meaningful cellular SAR data ( Table 1 ). Our results show that variations of the piperazinyl pyridine (compounds A–D) did not translate into differences in cell potency. Within a series of chinoline and isochinoline analogues (compounds E–G), a surprisingly steep cellular SAR was uncovered. Replacing the piperazinyl pyridine with significantly smaller substituents (compounds H–I) deteriorated target and cell potency. We have thereby demonstrated that the HCA assay can readily differentiate cell potency of different EZH2 inhibitors and can be successfully applied in determining SAR during the lead optimization process.
Structure-Activity Relationships for Pyridone EZH2 Inhibitors.
Mechanisms of SMOL-Induced Suppression of H3K27me3
In addition to HTS and compound profiling, the described HCA assay can be applied to increase the mechanistic understanding about induced H3K27me3 suppression. We observed that a 6-h treatment with the EZH2 tool inhibitor induced an H3K27me3 reduction of 25%. This is very intriguing because histone methylation is viewed to have a relatively long lifetime ( Fig. 2 ).1,24 To answer whether an induced early H3K27me3 suppression may basically depend on dilution of the mark through DNA replication or active removal, we applied our assay to investigate treated MDA-MB-231 cells after 6 h of EZH2 inhibition at a tool inhibitor concentration of 3 µM. All experiments were conducted using nonsynchronized cells. By image analysis based on nuclear size, cells were sorted into different cell cycle phases with subsequent quantification of global H3K27me3.This revealed that cells in G1-, S-, and G2-phase all underwent a similar decrease in H3K27me3 after 6 h of EZH2 inhibition ( Fig. 5A ). Furthermore, we used the nucleoside EdU to distinguish cells undergoing S-phase (replication) during EZH2 inhibitor treatment. We incubated MDA-MB-231 cells with the tool inhibitor at 3 µM together with EdU. After 6 h, 61% ± 0.08% of the treated cells had incorporated EdU, while 38% ± 0.08% did not ( Fig. 5B ). Cells that underwent S-phase showed a decrease in H3K27me3 of 30% when treated with the EZH2 tool inhibitor ( Fig. 5C ). In accordance with the previous result, cells that did not incorporate EdU (and therefore did not newly synthesize DNA) showed an H3K27me3 reduction of 35% after treatment with the EZH2 tool inhibitor. This indicates the existence of a dynamic and cell cycle–independent H3K27me3 removal. It may result from a dynamic H3K27me3 fraction, which is actively maintained by PRC2 independent from the cell cycle. Understanding of the mechanisms involved in a SMOL-induced suppression of H3K27me3 is essential with regard to epigenetic therapy.
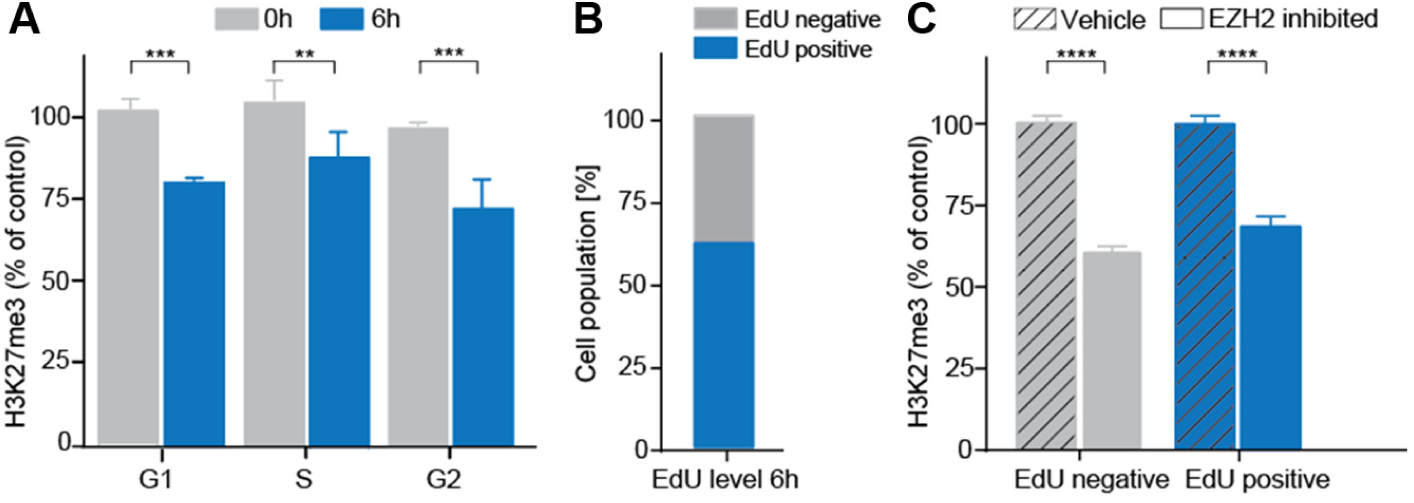
Small-molecule EZH2 inhibition reveals a dynamic, cell cycle–independent H3K27me3 fraction. (
Discussion
The biologic complexity associated with the regulation of EZH2 and H3K27me3 makes a phenotypic mechanistic assay, determining all relevant cellular parameters, particularly desirable. HCA combines robust statistical significance with high informational yield of cellular imaging, addressing those requirements. An HCA platform has been recently configured to pharmacologically assess the inhibition of ectopically expressed JMJD3 (KDM6B) demethylase enzyme.
25
We established a phenotypic single-cell readout that quantified a strong reduction of H3K27me3 together with a genome-wide modification shift to H3K27ac in response to EZH2 inhibition, but no alteration for a broad panel of alternative histone methylation marks (
Fig. 2
and
We validated the functionality of the HCA assay to mechanistically profile SMOL EZH2 inhibitors by conducting a benchmark analysis of the compounds EPI-0023 and EPI-0009, the nucleoside analogue DZNep, and an EZH2 tool inhibitor from the indazole/pyridone structural class on their potential to reduce global H3K27me3 levels (
Fig. 3
and
By synthesizing a small series of derivatives of the recently published EZH2 tool inhibitor GSK343, 23 we were able to correlate biochemical with cellular potency ( Table 1 ). A good match of data was achieved. This enabled us to bin the members of this set of inhibitors into three potency buckets: highly potent inhibitors (compounds A–F), inhibitors of intermediate potency (compounds H–I), and inhibitors of low cellular potency (compound G). In many drug discovery programs, compounds are first assayed in a biochemical format, and selected analogues are then advanced to a cellular assay to eliminate structures with cell permeation limitations. Traditionally, proliferation assays are used in oncology programs as the first cellular assay. However, an antiproliferation effect in a given cancer cell line is not necessarily target specific but instead may be influenced by off-target effects. The described H3K27me3 HCA assay combines the advantages of high throughput (more typical for enzymatic assays) with a target-specific cellular readout. We have thereby demonstrated that the first two stages of a drug discovery screening tree for identifying EZH2 inhibitors can be combined into one assay. This is highly relevant as it enables one to expedite the identification of cellular active lead compounds from very large compound collections.
The H3K27me3 HCA assay combines robust statistical significance with high informational yield of cellular imaging, thus providing a high assay accuracy that enables also SAR determination during the lead optimization process. Several hundreds of cells per well were analyzed individually with multiple replicates per sample across different treatment conditions, allowing a high degree of statistical reliability and reproducibility. The use of good-quality primary and secondary antibodies, providing a clear staining with very little background, in combination with a robust image analysis algorithm, strengthens this reliability and reproducibility.
Moreover, the described H3K27me3 HCA assay enhances our mechanistic understanding about induced H3K27me3 suppression. Our data strengthen the theory that active removal of the H3K27me3 mark (e.g., by histone exchange or demethylases) seems to be an important mechanism to modulate the level of H3K27me3.3,29 This was indicated by an observed H3K27me3 suppression in cells that have not replicated DNA during EZH2 inhibition over 6 h ( Fig. 5 ). Consequently, a decrease in global H3K27me3, induced by EZH2 inhibition, comprises two distinct mechanisms: the inhibition of de novo methylation and a dynamic, replication-independent H3K27me3 turnover. However, we and others observed that EZH2 inhibition over days is necessary to achieve maximal H3K27me3 suppression (Fig. 2).14,15 Hence, a noticeable portion of highly dynamic H3K27me3 seems to exist, while demethylation is mainly driven by the inhibition of the methylation maintenance function of PRC2 during S-phase. 30 A similar characteristic was reported for a suppression of H3K27me3 induced by the indazole inhibitor EPZ005687 in mutant EZH2-bearing lymphoma cells. 15 Here, a loss of H3K27me3 was apparent after 24 h but requires up to 5 days for full effects.
Through assay miniaturization and automation, we adapted the assay for HTS or, specifically, U-HCS of large-scale screening libraries. Miniaturization and automation is a prerequisite for large-scale screening opportunities, testing compound libraries consisting of millions of substances in an adequate period of time with reduced consumable costs. But miniaturization from the 384- to the 1536-well format exacerbates challenges, such as evaporation due to the long assay procedure over several days, susceptibility to systematic errors, or foam formation. We observed a decrease in robustness (
Miniaturization is a key driver in large-scale phenotypic screening setups that are analyzing more than 3 million compounds. It enables finalization of such phenotypic U-HTS campaigns in appropriate time, although accompanied by a compromised assay quality. This makes quality improvement during the secondary screening phase all the more important. During secondary screening, when notable less compounds have to be analyzed, a shift to the well-established semiautomated 384-well format is essential and will substantially improve assay quality and performance as well as data stability and reliability by providing a more robust and high-quality H3K27me3 HCA assay. In addition, a variety of well-selected orthogonal compound profiling assays will prove the pathway-specific compound impact during the hit characterization phase.
Due to the assay being an end-point measurement with fixed cells, the assay plates were able to be batch-processed within a stacker-equipped imaging platform, using the same exposure settings for the two laser channels throughout plate batches. The imaging time required per plate was 20 min, enabling a processing of seventy-two 1536-well plates per day when only one imaging plate reader was used. Unattended, fully automated image acquisition allowed imaging over 24 h for 7 days a week. The subsequent batch-processed image analysis was considerably faster than the image acquisition. Hence, the assay enables the analysis of large-scale compound libraries for the identification of inhibitors with high informational value (e.g., cellular downstream effects), identifying compounds with cellular permeability and potency.
Therefore, the H3K27me3 pathway-specific phenotypic HCA assay approach contributes to the identification and lead optimization of novel, cellular-active EZH2 inhibitors; the understanding of the biological role of EZH2 and H3K27me3; and the ability to affect human disease by their modulation. Thus, it represents an important benefit for epigenetic drug discovery, complementing other in vitro histone methyltransferase assay systems.17,18
Footnotes
Acknowledgements
We are very grateful to Alexander Kaminke for his support during the assay development, Jana Hannig for supporting siRNA-transfection studies, and Sebastian Räse for his support in journaling and image analysis. Moreover, we sincerely thank Katrin Nowak-Reppel for conducting the assay miniaturization to the 1536-well plate format and Stefani Bunse for performing fully automated miniaturized 1536-well large-scale experiments. We thank Kathy Gelato and Patrick Steigemann for proofreading.
Declaration of Conflicting Interests
The authors declared no potential conflicts of interest with respect to the research, authorship, and/or publication of this article.
Funding
The authors received no financial support for the research, authorship, and/or publication of this article. All authors are employees of Bayer Pharma AG, and the research work was conducted under the employment of Bayer Pharma AG.
References
Supplementary Material
Please find the following supplemental material available below.
For Open Access articles published under a Creative Commons License, all supplemental material carries the same license as the article it is associated with.
For non-Open Access articles published, all supplemental material carries a non-exclusive license, and permission requests for re-use of supplemental material or any part of supplemental material shall be sent directly to the copyright owner as specified in the copyright notice associated with the article.