
Abstract
Multiple Sclerosis is a demyelinating disease of the CNS and the primary cause of neurological disability in young adults. Loss of myelinating oligodendrocytes leads to neuronal dysfunction and death and is an important contributing factor to this disease. Endogenous oligodendrocyte precursor cells (OPCs), which on differentiation are responsible for replacing myelin, are present in the adult CNS. As such, therapeutic agents that can stimulate OPCs to differentiate and remyelinate demyelinated axons under pathologic conditions may improve neuronal function and clinical outcome. We describe the details of an automated, cell-based, morphometric-based, high-content screen that is used to identify small molecules eliciting the differentiation of OPCs after 3 days. Primary screening was performed using rat CG-4 cells maintained in culture conditions that normally support a progenitor cell–like state. From a library of 73,000 diverse small molecules within the Sanofi collection, 342 compounds were identified that increased OPC morphological complexity as an indicator of oligodendrocyte maturation. Subsequent to the primary high-content screen, a suite of cellular assays was established that identified 22 nontoxic compounds that selectively stimulated primary rat OPCs but not C2C12 muscle cell differentiation. This rigorous triaging yielded several chemical series for further expansion and bio- or cheminformatics studies, and their compelling biological activity merits further investigation.
Keywords
Introduction
Oligodendrocytes belong to a class of neural cells known as glial cells that structurally and functionally support the neurons and their axons in the CNS. Neural stem cells give rise to oligodendrocyte precursor cells (OPCs), which are mitotically competent cells with 1 or 2 membrane processes. These, in turn, undergo a process of differentiation to become mature oligodendrocytes as evidenced by sequential expression of various biomarkers, including O4 and myelin basic protein (MBP).1–6 Maturing oligodendrocytes are postmitotic cells, characterized morphologically by the extension of numerous and often branched membrane processes. In vivo, processes from a single mature oligodendrocyte wrap and subsequently form compact myelin around up to 50 proximal axons, becoming a segment of their insulating myelin sheath.2–5 Multiple Sclerosis (MS) is the most common demyelinating disease of the CNS as well as one of the primary causes of neurological disability in young adults, and loss of oligodendrocytes at MS lesions has long been thought to be a primary contributor to disease. More recently, it has been found that oligodendrocytes are heterogeneous in nature 7 and that a significant number of OPCs migrate to and are present in MS lesions even in the chronic phases. If these endogenous cells could be stimulated to differentiate, this could represent a promising new therapeutic avenue for MS treatments.2–4
To initiate this objective, a strategy was devised using a high-throughput screening tree to discover compounds that promote OPC differentiation. A major consideration in developing this type of screen was the sourcing of cells that recapitulate the biology of interest, could be easily expanded, and were not engineered (e.g., through the introduction of extraneous biology such as reporters) to conserve physiologically relevant responses. Studies of optic nerve–derived cells cultured from newborn rat brains had previously identified an oligodendrocyte-type 2-astrocyte (O-2A) progenitor cell that can develop into either an oligodendrocyte or a type 2-astrocyte given the appropriate conditions. 6 When placed in serum-free or low-serum-containing cell culture medium, O-2A cells quickly differentiate into oligodendrocytes, whereas high-serum-containing medium eventually favors their differentiation into type 2-astrocytes. Unfortunately, newly isolated O-2A cells maintained in the presence of platelet-derived growth factor (PDGF) and basic fibroblast growth factor (bFGF) survive for only a few doubling times before spontaneously undergoing terminal differentiation. Considering the method of preparation from tissue plus the limited cell yield and expansion potential, it is difficult to manage a sufficient and reproducible cell supply for a screening campaign of reasonable size. Our solution was to use a cell-line like CG-4, which was originally isolated from a culture of newborn rat cerebral cortex primary O-2A cells. 8 These bipotential glial cells are indistinguishable from primary O-2A cells by morphological and immunochemical criteria, and they are similarly capable of differentiating into either oligodendrocytes or type 2-astrocytes depending on culture conditions. Unlike primary OPCs derived from O-2A cells or early postnatal cortices, CG-4 cells are easily maintained and expanded. If carefully maintained in culture by subconfluent expansion in the presence of PDGF and bFGF, CG-4 cells continue to proliferate in a largely bipolar, immature state for many passages and express similar phenotypic markers to OPCs found in MS lesions. 9
This report describes a high-throughput morphometric-based imaging assay that was developed to identify compounds that stimulate OPC differentiation using CG-4 cells as a first-line surrogate assay. The CG-4 assay was performed in cell culture conditions that require a compound to override by 3 days the growth conditions favoring the OPC state. We describe the process for completing a screen of 73,000 small molecules and natural product–derived compounds, as well as the analytical methods used to filter and refine the list of active compounds by applying further phenotypic assays to eliminate those with less desirable activities. These efforts produced a set of about 350 compounds derived from primary screening that were triaged with a suite of secondary cellular assays, including primary rat OPCs, resulting in the identification of 22 specific stimulators of OPC differentiation. At the end of this biological selection process, bio- and cheminformatics were applied to identify the most attractive compounds for further investigation toward developing small molecules that have the potential to enhance CNS remyelination in vivo.
Materials and Methods
Materials
For cell fixing and staining, paraformaldehyde was purchased from Fisher Scientific (Pittsburgh, PA) or the Becton Dickinson (BD) Perm/Wash kit (Becton Dickinson, Franklin Lakes, NJ); CellMask Deep Red and Hoechst 33342 were from Life Technologies (Carlsbad, CA). Control compounds [dibutyryl cyclic adenosine monophosphate (dbcAMP), resveratrol, and retinoic acid] were purchased from Sigma-Aldrich (St. Louis, MO). For cell imaging in screening, an automated fluorescent microscope imaging system, the Thermo Fisher Cellomics ArrayScan II (Thermo Fisher, Waltham, MA), was used, together with the Neuronal Profiling V3 and the Target Activation V3 BioApplications for image analysis and feature quantitation. For secondary assays, the ArrayScan VTi with similar algorithms (V4) was used.
Evaluation of Compounds in the Primary Screening Assay Using CG-4 Cells
The CG-4 line was kindly provided by Dr. J. C. Louis. 8 CG-4 maintenance and expansion for screening are detailed in the Supplementary Materials. For the screening assay, CG-4 cells were plated in 54 µl GM at 500 cells/well in BD-Biocoat 384-well poly-D-lysine-coated plates and incubated at 37 °C/6.5% CO2 until cells adhered (about 2 h). Compounds to be evaluated were added to single wells (6 µl; 3 µM/0.1% DMSO final) at the same time as the positive (6 µl; dbcAMP; 5 mM/0.1% DMSO final) and negative (6 µl; 0.1% DMSO final) controls that were each added to 16 control wells on every plate. Plates were incubated at 37 °C/6.5% CO2 for 72 h, then cells were fixed overnight at 4 °C with paraformaldehyde (4% final). The fluid was aspirated, and the cells were washed twice with phosphate buffered saline, then stained for 1 h at room temperature with Hoechst 33342 (1.6 µM) to define the nucleus, plus CellMask Deep Red (1.5 µg/ml) to define the cytoplasm. Plates were washed as before, and then sealed and stored (protected from light) at 4 °C until imaging on the ArrayScan II (10× objective, NA 0.3).
After single replicate screening at 3 µM, compounds of interest were retested in triplicate at 3 and 0.3 µM. For dose responses, 10 concentrations making 1:3 dilutions starting from 12 µM were tested in triplicate.
Analysis of screening data is described in the Supplementary Materials.
O4 Staining of CG-4 Cells
The Chemicon antibody used in the experiments described recognizes the O4 epitope maximally on live cells, which unfortunately easily wash off the plates. To overcome this challenge, an automated method was devised and is detailed in the Supplementary Materials.
PBMC Toxicity Counterassay
Human peripheral blood mononuclear cells (HuPBMCs) were obtained as a frozen pellet from Lonza Walkersville Inc. (Walkersville, MD). For testing viability in the presence of compound, freshly thawed cells were plated at 10,000 cells/well in 45 µl cell culture medium [Phenol Red–free RPMI-1640 containing L-glutamine (Life Technologies), 50 U/ml penicillin–streptomycin, and 10% fetal bovine serum]; test compounds were added in 5 µl RPMI/1% DMSO, and 10 µM staurosporine was included as a “low control” compound. Cells were incubated at 37 °C/5% CO2 for 72 h, and then viability (adenosine triphosphate concentration) was assessed using the CellTiter-Glo luminescent assay from Promega (Madison, WI).
Secondary Assays
Two secondary assays were established; the first to provide confirmation of differentiating activity of compounds for primary rat OPCs after growth factor withdrawal for 3 days, and the second to eliminate compounds capable of causing differentiation of cells from a distinct mesenchymal lineage, for which we selected C2C12 differentiating to myotubes. Compounds cytotoxic to either cell type were also eliminated. Details of these two assay methods are provided in the Supplementary Materials.
Results
Primary Screening
1. Primary screening assay
A method to screen small molecules and purified natural product compounds was established in 384-well plates using the rat CG-4 cell line. The assay was configured to identify compounds stimulating OPC differentiation in growth factor–rich conditions that normally sustain the undifferentiated phenotype where the majority of cells continue to divide and exhibit a simple morphology. Although CG-4 cells differentiate well when growth factors are withdrawn,
8
for screening we wanted to avoid fluid removal. Therefore, a previously well-characterized small molecule, dbcAMP (bucladesine), was used as the positive assay–plate control to compare the effects of compounds on stimulating OPC differentiation. As detailed in the Materials and Methods section and
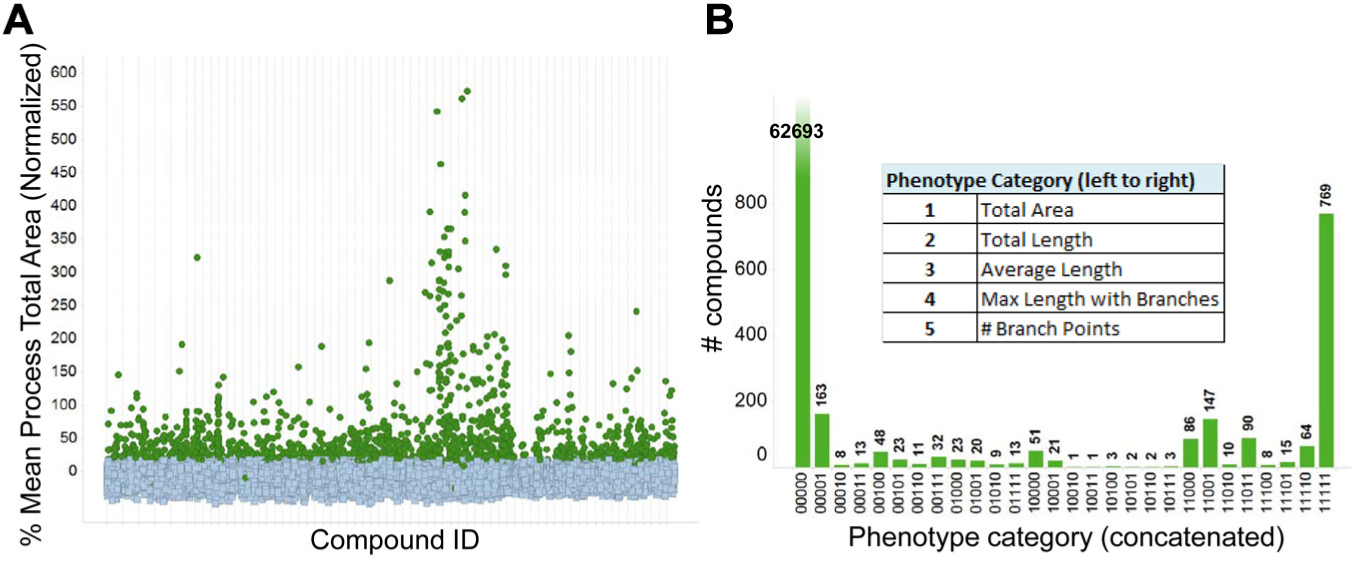
The outcome of the primary screening (y-axis plotted with the most commonly positive parameter, mean process total area) is illustrated in
Figure 1A
. For each plate and parameter, the mean of 16 0.1% DMSO-treated (low) control wells was set to 0%, and the change elicited by dbcAMP (high, 16 wells) to 100%; control results were analyzed for plate and run quality control, and compound responses were normalized to individual plate control high–low means. The assay was robust and reproducible: throughout the whole screen (ca. 73,000 compounds and 300 384-well plates), the mean individual plate Z’ was 0.53±0.05, and very few plates had to be repeated. The 5 morphology parameters were scored separately for positivity: those higher than a 20% threshold were scored as 1, and those lower as 0. The scores were then concatenated to produce a phenotypic profile of each compound, and 28 of 32 possible categories were observed (
Fig. 1B
). The parameters used to select positives in primary screening were deliberately set to include as many compounds as possible. Compounds (1710/73,241; 2.3% hit rate) were designated active if they scored positive in any 1 of the selected 5 morphology parameters (
Fig. 1A
), although nearly half (42%) of the active compounds were positive in all 5 parameters (
Fig. 1B
). The screening tree is detailed in
Primary screen results. (
2. Confirmation of positives, counterassay, and refinement of the analysis model
Positive compounds were retested in confirmation assays at 2 doses (3 and 0.3 µM) with 3 replicates, using the same morphological analysis. The 2 doses were included to try to mitigate any marginal high-dose toxicity by potentially still interesting structures. Of the 1710 compounds retested, 704 (41%) confirmed at 3 µM, and 129 positives confirmed at 0.3 µM (
In our experience with automated image-based screens, 10 it is only after the effect of a diverse set of compounds on the cells is directly observed by inspecting images that it becomes clear that other parameters should be taken into account. During the confirmation stage of the project, a further refined strategy was taken to reanalyze stored images from the high-content primary screen and to “flag” certain phenotypes or eliminate less optimal compounds.
For example, a subset of compounds caused CG-4 cells to assume larger, brighter nuclei than the controls, which on closer examination by confocal microscopy was attributable to nuclear polyploidy. These compounds were identified from the internal Sanofi database as Aurora kinase inhibitors, which are known to affect cell cycle progression and lead to endoreduplication. 11 A measure of nucleus fluorescent intensity was added to flag cells that exhibited this phenotype.
An analysis artifact was observed that appeared to be generated by marginally toxic compounds or by compounds that acted on dividing cells only. Because cells remained in the same culture medium for 3 days, some inevitably began to differentiate. Cells exhibiting a more complex phenotype adhered better to the plates throughout the staining procedure, whereas cells with minimal process extensions were more prone to wash off. Therefore, certain compounds favored the removal of OPCs, yielding a misleadingly high percentage of differentiated cells. A method to eliminate these false positives was devised, using a gated cell analysis in which only cells that exceeded a threshold were included in the analysis. This threshold was set as 750 µm
2
for mean process total area and 4 branch points per cell for branch point total count, and these were normalized to the negative control wells, a process illustrated in
Figure 2
. Well-level features were then analyzed for each of the gated populations. Adding this filter into the analysis process eliminated approximately half of the compounds, validating 378 of the compounds that confirmed at 3 and 0.3 µM, and 40 at 0.3 µM only (
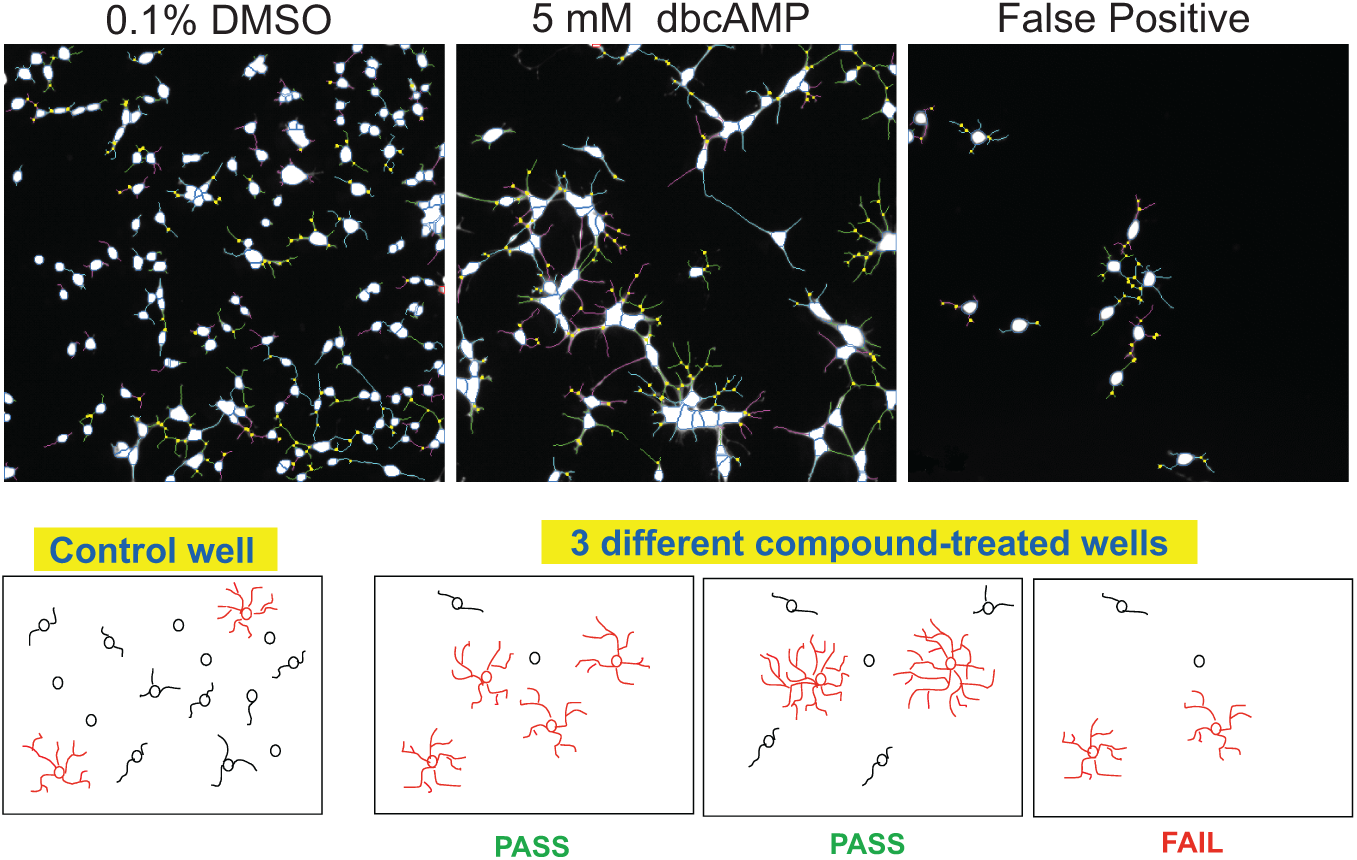
Eliminating false positives by gating. (
Finally, in this initial screening triage, a counterassay was added to identify remaining compounds demonstrating cytotoxicity after 72 h incubation with HuPBMCs. This assay was configured specifically to test human, noncycling cells in a timeframe similar to that of the primary assay, and it was used to eliminate only those compounds with pronounced cytotoxicity (>50%) at 3 µM; this assay excluded a further 26 compounds (
3. Dose response
The remaining 392 compounds were analyzed in triplicate in 10-point dose response curves (1 nM to 12 µM). Criteria were established to identify compounds and compound series that could be clearly prioritized for further evaluation, as described in the Data Analysis section of the Supplementary Materials. As a result of this analysis, from the 392 compounds tested in dose response, 342 compounds were designated active (
Secondary Assays
1. O4 staining of CG-4 cells
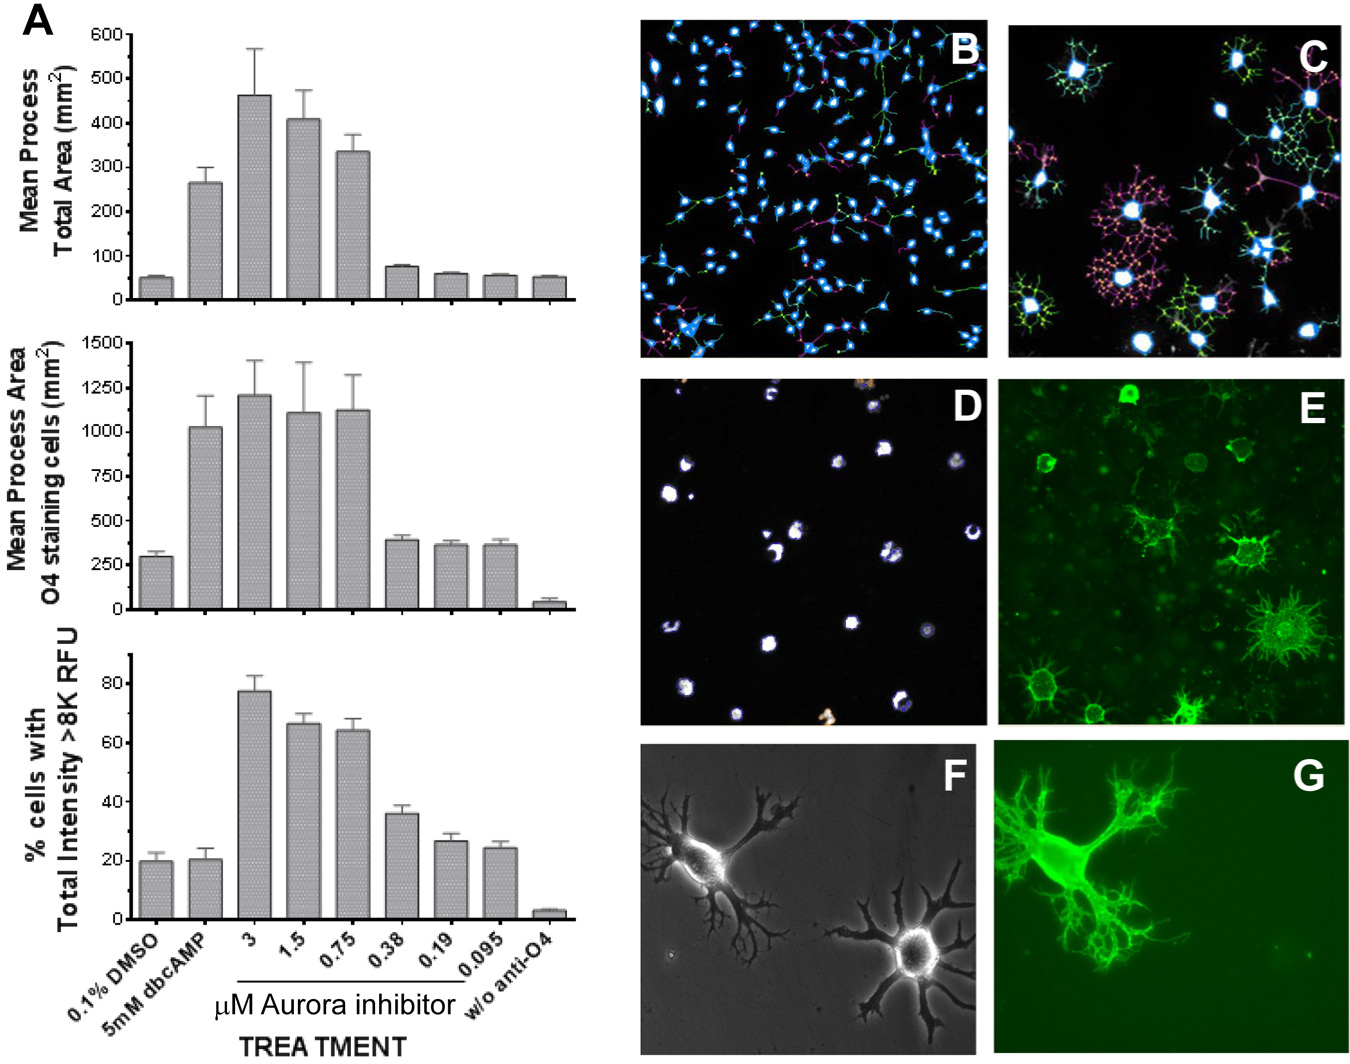
CG-4 cells are capable of differentiation to astrocytes or oligodendrocytes depending on the cell culture conditions. 8 To confirm compound-induced OPC maturation, a secondary assay measured the O4 surface marker of early rodent OPC differentiation. Cells were assayed after compound treatment, and the production of O4 immunoreactive (O4+) cells was assessed by applying the Cellomics Target Activation V3 BioApplication to measure the number of O4+ cells, and the Neuronal Profiling V3.5 BioApplication to assess their relative complexity. Results of a dose response with the Aurora inhibitor compound are shown in Figure 3 and illustrate the utility of including more than 1 measure to profile a compound’s activity. Although both dbcAMP and the inhibitor increased both total area and percentage of cells with O4 staining, the Aurora inhibitor also increased the total fluorescence “signature” (size) of the cell nucleus ( Fig. 3B versus 3C and 3D ). Importantly, not all compounds that increased cell complexity increased O4 immunoreactivity within the 3-day timeframe of the assay, and not all cells that developed a complex morphology stained for O4 by then ( Fig. 3D–F ). In subsequent experiments using primary rat OPCs (results not shown), similar results were observed: Although, by 5 days in culture, most cells demonstrated increased morphological complexity, consistent O4 immunoreactivity was not observed until later. Our experience with this assay suggested that a change in morphology could successfully predict O4 production, but that O4 expression under compound stimulation was very time and compound dependent, and therefore not a clear selection tool. To avoid losing compounds at this early stage, therefore, all compounds were carried into the next phase of testing.
(
2. C2C12 myoblast formation: specificity assay
In addition to monitoring for minimal GFAP immunoreactive astrocytes (not shown), progenitor cells from a distinct lineage that exhibits differentiation dynamics after growth factor withdrawal comparable to OPCs were selected to eliminate compounds that had broad differentiation effects beyond OPCs, toward reducing potential in vivo side effects. The C2C12 line was derived from a primary mouse skeletal muscle cell culture.
12
This mesenchymal stem cell (MSC)-like multipotential cell line is capable under different growth conditions to differentiate into osteoblasts, adipocytes, or myoblasts. Significantly in this context, after growth factor withdrawal, C2C12 cells differentiate during the next several days into skeletal muscle myotubes. Therefore, differentiation of C2C12 cells to myotubes was chosen to ensure that the 342 active compounds demonstrated selective differentiation activity. Compounds were tested at 3 µM on cells maintained in C2C12-GM for 4 days, and myotube formation was assessed through staining for myosin heavy chain in combination with a change in cellular morphology. The 2 criteria designating compound specificity were (1) that C2C12 cells did not differentiate significantly more than the DMSO-treated population (
3. Primary rat glial precursor cell differentiation: confirmatory assay
To confirm that the compounds identified using the CG-4 cell line were active in a relevant primary cell type, all 342 compounds were tested in primary rat cortical OPCs using a 3-day assay configured and analyzed similarly to the CG-4 screening assay, but using growth factor withdrawal as the differentiation stimulus. Results in Figure 4A demonstrate a dose response with a peroxisome proliferator-activated receptor delta (PPARδ) agonist, oxadiazolone class compound that was previously shown active both in vitro and in animal models of MS,13,14 thereby supporting the potential value of the screening strategy. The results for 1 parameter assessed for compounds tested at 3 µM in triplicate plates are illustrated in Figure 5 . The primary cell morphology and changes with the OPCs were more variable than the CG-4 cell line. Compounds that induced an increase in morphological complexity in at least 2 of 5 parameters as compared to the undifferentiated controls, while not decreasing the cell (nucleus) number to lower than the differentiated control levels, were selected as positives.
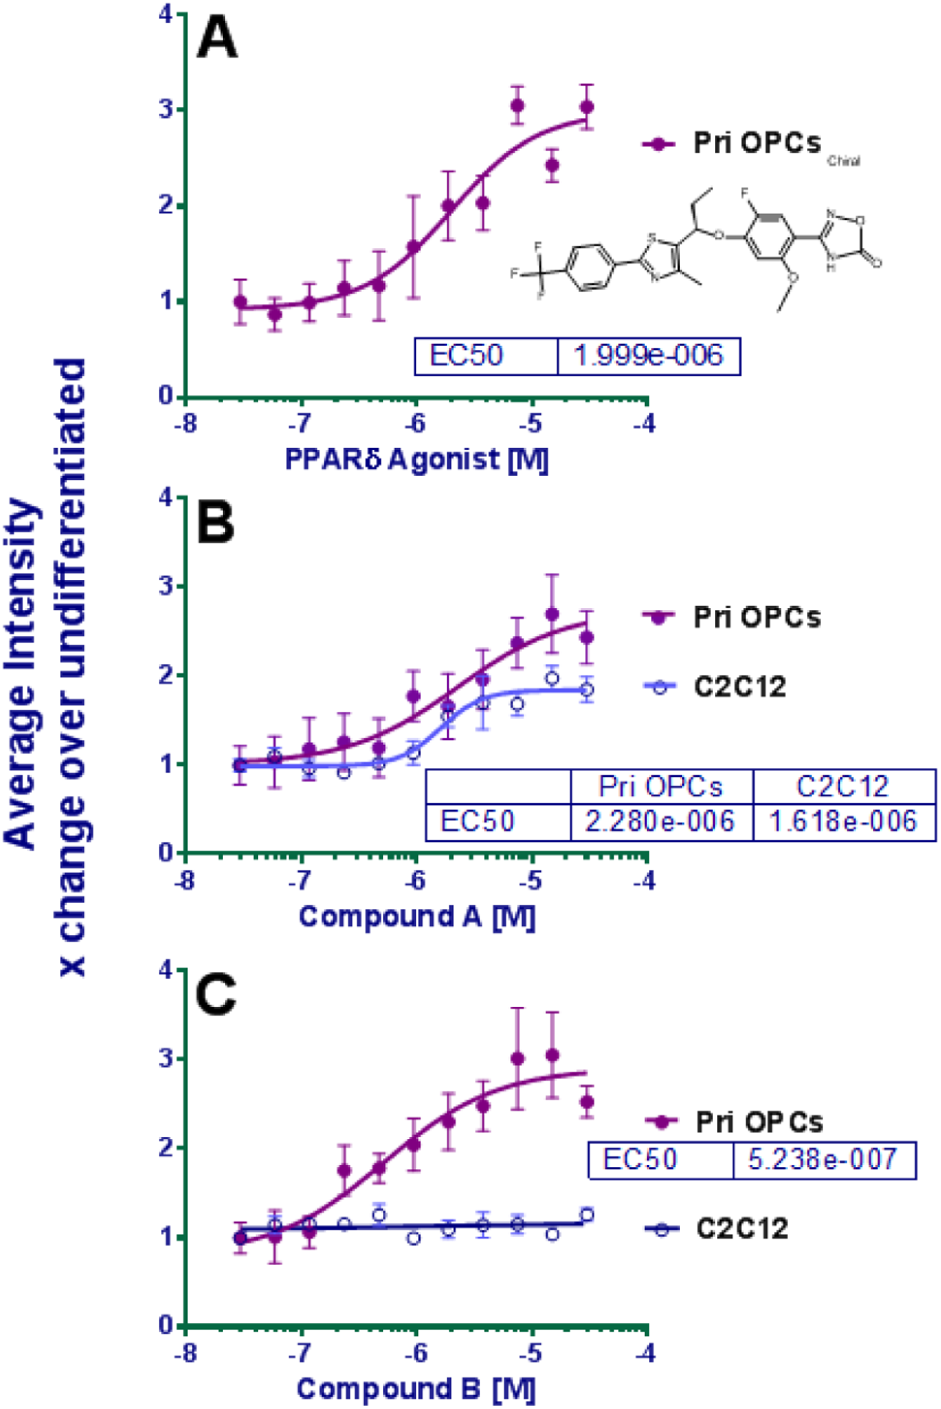
Dose responses in primary rat OPCs and mouse C2C12. The y-axis is plotted for total mean process intensity for primary OPCs and total myosin intensity for C2C12s; both are expressed as a fold-change higher than the undifferentiated controls of the respective assays. (
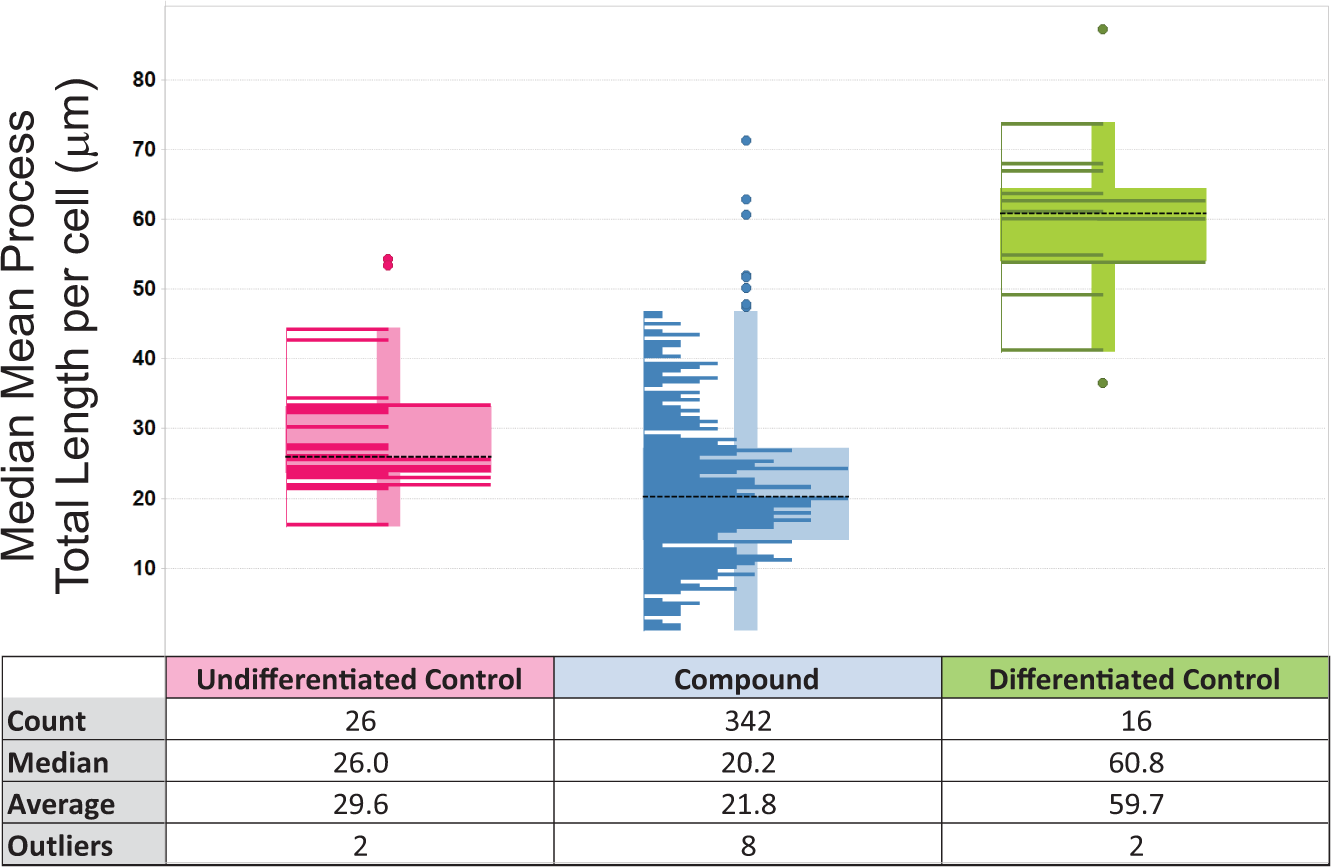
Testing 342 actives from a CG-4 primary screen in a rat primary OPC assay (3 µM, triplicate). The 2 control types (left and right hand plots) and the compounds (center plot) in a single parameter (process total length) were plotted as a box-and-whisker view overlaid with a histogram of the result distribution (Spotfire; TIBCO Spotfire, Boston, MA). The spread of the control wells was routinely found to be much greater than in the CG-4 screen. Dotted lines indicate the average of all of the results in the individual category. Compounds eliciting lengths of >30 µm were considered active.
Of the 93 (of 342) active compounds identified, 82 were also found inactive and nontoxic in the C2C12 assay. These were evaluated in parallel dose response (2 nM–30 µM) assays using C2C12 and rat primary OPCs (examples in
Fig. 4B
and
4C
). From this analysis, only 22 compounds qualified as dose responsive, ≥3× selective at the designated EC50 for rat primary OPCs versus C2C12, and nontoxic for either cell type at 10 µM. The structures of these molecules were assigned to 7 chemical series, with 6 individual “singletons.” The secondary assay triage process is summarized in
Discussion
The objective of the high-content, phenotypic screening campaign described in this article was to rapidly identify small molecules capable of selectively promoting the differentiation of OPCs to a more differentiated phenotype. Compounds identified through this effort have the potential to stimulate endogenous OPCs to differentiate and remyelinate demyelinated axons, thereby contributing new modalities of treatment for neurodegenerative diseases such as MS. A small-molecule approach to achieve this objective has a higher chance of resulting in an orally bioavailable therapy that is able to cross the blood–brain barrier and reach the CNS, compared to biological agents. Although significant data exist regarding the pathways and gene expression modifications during OPC differentiation,5,15–19 in the context of developing therapeutics there are important considerations concerning the specificity of putative targets. Therefore, we chose the approach of a phenotypic assay to identify compounds competent to initiate differentiation of both rat CG-4 cells and primary OPCs but not of the MSC-derived rodent progenitor cell (C2C12) in a comparable assay format (similar time and stimulus). A quantitative image-based readout for primary screening of CG-4 cells was used to measure morphology changes from bipolar progenitor cells to more complex multipolar cells in a relatively short 3-day assay (insufficient for assessing myelin production) conducted in conditions that normally support an undifferentiated state. Greater than 73,000 compounds were screened initially, and about 350 active molecules were subsequently biologically triaged in a suite of cellular assays, designed as described to eliminate undesirable effects, including toxicity and nonselective effects on cellular differentiation.
Changes in CG-4 morphology were assessed by adapting the Cellomics BioApplication for neurite outgrowth to assess cell complexity and by focusing on increases in process outgrowth and branching. Both our current and historical 10 results, however, reveal that, after primary phenotypic screens, several adjustments to the initial analysis model may be necessary to compensate for unexpected effects of compounds on morphology and cell survival. For this reason, it is critical to be able to easily retrieve images of the wells assayed to enable visual assessment. This approach was greatly facilitated by the use of Genedata’s Screener for HCS (Genedata, Basel, Switzerland), which not only permits automated processing of multiple features and visualizations of single features and their various possible combinations, but also can quickly display the cell images associated with single data points. As examples in the current study, during the fixing and staining procedure, unhealthy OPCs washed off plates more easily than the more morphologically complex oligodendrocytes, and there was a background level of CG-4 cells that differentiated by 3 days, even in full growth medium. Compounds that were moderately toxic (or were selectively killing proliferating cells) therefore tended to return a falsely high differentiation percentage. This phenomenon became clear to us when we retrieved representative images for inspection, rather than relying only on the quantitative analysis. In addition, fluorescent-quenching or -enhancing compounds were first identified as quantitative anomalies and then easily explained and flagged after images were viewed. Once these unwanted phenotypes were identified, a reanalysis of stored images was performed to take into account such post-hoc observations.
We screened about 73,000 compounds and found that only 22 qualified after our strict biological filtration process. The entire triage is summarized in
For a number of debilitating diseases or conditions, a discovery approach to identify small molecules to stimulate or expand endogenous progenitor cells could give rise to new treatment modalities. As already described, MS patients could benefit from stimulation of resident OPCs to differentiate and improve myelination of neurons that otherwise function at low efficiency and eventually die. To date, most existing clinical MS treatments target the inflammatory component of this disease; targeting resident progenitor cells represents a novel approach; also, knowledge in this area is relevant to several disease areas. For example, muscle wasting evident in muscular dystrophy or cancer cachexia could derive benefit from stimulation or increased self-renewal of the muscle precursor satellite cells present in a quiescent state in skeletal muscle laminae. 20 Key to an approach of stimulating endogenous precursors is that small molecules should be fairly specific or able to be correctly targeted physiologically. For this project, systemically delivered compounds must be able to cross the blood–brain barrier and reach the CNS. Especially in the absence of clearly relevant biological targets and a plethora of possibilities, a phenotypic screening approach is a valid approach to such discovery challenges. Not only does it allow the discovery of small molecules (or other entities) that are effective at interacting with the desired system, but also it would be expected to provide tool compounds that are useful in identifying relevant biological targets or pathways that can be addressed at a molecular level. As always for screening, 21 the initial selection of an assay format and cell type used 22 will surely influence outcomes. Our 3-day assay was designed to enable rapid screening, first using a cell line before confirming with primary cells derived from the rat cerebral cortex. Three days is more desirable from a screening perspective but is insufficient to directly identify compounds that stimulate myelin production. A different assay format was used by Deshmukh et al. 23 in which myelin basic protein production was measured in a 6-day growth factor withdrawal assay with primary rat optic nerve–derived OPCs. They identified the compound benztropine, which we find inactive (data not shown) in our primary rat OPC model performed in full growth factor conditions and on a substrate that normally maintains cells in a nondifferentiated state. Similarly, in a screen 24 using the mouse CNS–derived Oli-neu cell line, a compound from the Library of Pharmacologically Active Compounds (LOPAC; PD174265) active in the primary assay (performed on collagen-coated plates in the absence of growth factors) turned out later to be dependent on the absence of PDGF. Assay formats, such as choice or origin of cell type or technical execution,22,25,26 can therefore be expected to select for different types of compounds and ultimately different mechanisms of action. It should also be noted that whole cell–based phenotypic approaches lend themselves to the very pertinent study of synergism of diverse compound classes found in screening, or compounds that affect other relevant related cell types in co-cultures (e.g., for OPC co-cultured with neurons and/or astrocytes). Phenotypic screens have led to the development of many first-in-class U.S. Food and Drug Administration–approved drugs during the past 15 years,27–29 and such analyses indicate that the deployment of cellular or organism screening in drug discovery is a demonstrably successful approach that should be supported for innovative drug discovery.
Footnotes
Acknowledgements
We thank Randall Munson, Raquel Paranal, Julie Li, and Tina Garyantes for their useful input and comments during the course of this work.
Declaration of Conflicting Interests
The authors declare no potential conflicts of interest with the respect to the research, authorship, and/or publication of this article.
Funding
The authors received no financial support for the research, authorship, and/or publication of this article.
References
Supplementary Material
Please find the following supplemental material available below.
For Open Access articles published under a Creative Commons License, all supplemental material carries the same license as the article it is associated with.
For non-Open Access articles published, all supplemental material carries a non-exclusive license, and permission requests for re-use of supplemental material or any part of supplemental material shall be sent directly to the copyright owner as specified in the copyright notice associated with the article.