
Abstract
Automated image processing is a critical and often rate-limiting step in high-content screening (HCS) workflows. The authors describe an open-source imaging-statistical framework with emphasis on segmentation to identify novel selective pharmacological inducers of autophagy. They screened a human alveolar cancer cell line and evaluated images by both local adaptive and global segmentation. At an individual cell level, region-growing segmentation was compared with histogram-derived segmentation. The histogram approach allowed segmentation of a sporadic-pattern foreground and hence the attainment of pixel-level precision. Single-cell phenotypic features were measured and reduced after assessing assay quality control. Hit compounds selected by machine learning corresponded well to the subjective threshold-based hits determined by expert analysis. Histogram-derived segmentation displayed robustness against image noise, a factor adversely affecting region growing segmentation.
Introduction
I
The ultimate objective of any HCS screen is the selection of compounds that may be effective against diseases such as cancer, Alzheimer’s disease, and Huntington’s disease. 1,2 These diseases are linked to autophagy, a highly regulated, homeostatic, intracellular catabolic mechanism by which eukaryotes degrade superfluous or faulty organelles and long-lived proteins. 3 Autophagy activation can lead to cell death through programmed self-digestion, and thus many anticancer agents may have autophagy-inducing capability. In addition, cell growth is negatively regulated by autophagy, which may slow down tumor growth. 4 Being an evolutionarily highly conserved process, autophagy-specific genes have been characterized in distant species ranging from yeast to human. 5 Macroautophagy (henceforth referred to as autophagy) is one of the 3 primary autophagy forms besides microautophagy and chaperone-mediated autophagy. The process of autophagy may be upregulated during both extracellular stress conditions such as starvation, infection, hypoxia, heat, or drug treatment, as well as intracellular stress conditions, including the accumulation of protein aggregate, misfolded proteins, or defective organelles. 6 Autophagy involves a series of steps, including the formation and expansion (vesicle elongation) of an isolation membrane (phagophore), which then fuses to form autophagosomes, also known as autophagic vacuoles (AVs), which in turn fuse with lysosomes to form an autolysosome where the cytoplasmic material is sequestered and then degraded. 7
HCS for autophagy activators is still limited, despite an emerging research interest. A recent high-content cellular image analysis study identified 8 autophagic cell death inducer compounds, 8 and a cell-based functional screening revealed 3 genes inducing high levels of autophagosome formation when overexpressed. 9 Upon induction of autophagy, both studies exploited the localization of microtubule-associated protein light chain 3 (LC3) fused with green fluorescent protein (GFP) to the autophagosomal membrane. 10 Increased levels of autophagy are phenotypically indicated by the increased number, size, and/or fluorescent intensity of autophagosomes that can also aggregate around the nuclear membrane. Cellular systems expressing LC3-GFP are considered as being more specific to indicate autophagy, although emission is not steady through the process because late-stage AVs emit a weaker fluorescent signal than early stage AVs. There are several alternative methods for measuring autophagosomal induction, with no clear consensus as to which is the most appropriate to use. The fluorescent dye monodansylcadaverine (MDC) accumulates in autophagic and other intracellular compartments, 11-13 making it a convenient indicator of autophagy activation. We have therefore combined a simple and cost-effective MDC-based primary assay with an orthogonal secondary assay using an immunofluorescent LC3B antibody marker into a high-throughput phenotypic screening strategy to identify activators of autophagy.
Using HCS also allows us to distinguish true autophagic inducer compounds from those that increase the level of autophagic degradation indirectly by cellular toxicity. 8
Automated fluorescent confocal microscopy coupled with increased computational power has dramatically enhanced the rate of image acquisition and analysis of derived multispectral data. A typical workflow starts with image preprocessing to improve the quality of raw images, followed by image segmentation where fluorescent regions of interest are separated from the background. Segmentation is a critical component of any image-processing workflow as errors at this phase profoundly influence hit selection. 14 A decline in segmentation performance will result in errors in derived numerical metrics. In contrast to the blob-like nucleus, a region-growing segmentation strategy is not optimal for the (usually) punctate AV structures and may not be able to distinguish between AV and background noise. 15 Autophagosomes do not appear as continuous but as sparse regions in an image. It is coupled with spectral crosstalk (bleed-through), which leads to multiple classes in the same image such as the nuclear, the AV bleed-through, and background pixels. A segmenting algorithm can address those challenges by clustering separate pixels into multiple classes.
As the capability to accurately segment sparse objects and correctly tackle bleed-through is not present in the commercial image analysis software available to us, we developed a custom macro in ImageJ, 16 an open-source image analysis application. We combined this image analysis approach with a well-established statistical and analytical tool, R 17 (http://r-project.org). R is an extensively used open-source platform for exploratory data analysis, descriptive statistics and assay quality control, 18-20 assay performance determination, and significance tests. Interactive visualization of the data was performed using the commercial data visualization application Spotfire (Somerville, MA). A statistical method-based feature selection was used to eliminate irrelevant or unhelpful numerical descriptors, followed by machine learning–based hit selection. Hit compounds selected from the primary screen were then confirmed in secondary screens. The initial quantitative and automated processing of the images and derived data contributes to an unbiased selection of hits from such phenotypic assays, in contrast to prevailing subjective methods based mostly on expert curation and analysis. 21,22
This article outlines a simple image analysis–statistical framework that can be applied readily in a high-content cellular screen of cancer cell lines to identify novel selective pharmacological inducers of autophagy in compound libraries.
Materials and Methods
Compounds for autophagy phenotypic screen
We used the LOPAC1280 compound library (Sigma-Aldrich, St. Louis, MO) as our test compounds, trifluoperazine dihydrochloride (Sigma-Aldrich) as our positive control, and DMSO (Sigma-Aldrich) as our negative control.
Cell culture and cell plating
Human alveolar carcinoma A549 (lung epithelial cancer) cells were seeded into 96-well transparent, flat-bottom plates (Greiner, Monroe, NC) at a density of 5000 cells per well in Dulbecco’s modified Eagle’s medium (DMEM) containing 4% fetal bovine serum (HyClone, Logan, UT). The cells were then incubated with library compounds at 5 concentrations (10, 2, 0.4, 0.08, and 0.016 µM) for 48 h.
Primary assay using MDC staining
The live cells were stained with MDC as follows: 100 µL staining medium containing 100 µM MDC was added to all wells and incubated for 40 min at 37°C. Excess MDC was then washed off with phosphate-buffered saline (PBS) on the Bio-Tek EL-405, followed by the addition of 100 µL of warm DMEM. The plate was then read immediately on the ImageXpress Ultra. Cell nuclei were then stained with 3 µM Hoechst 33342 (Invitrogen, Carlsbad, CA).
Secondary assay using LC3B staining
A549 cells were fixed in 4% paraformaldehyde for 10 min at room temperature and then permeabilized with 0.1% Triton X-100 for a further 10 min. The fixed cells were then blocked with 3% bovine serum albumin (BSA) for 30 min. To stain for LC3B, we incubated the cells with anti-LC3B rabbit polyclonal antibody at 1:2000 dilution (#NB600; Novus, Littleton, CO) and subsequently labeled it with 1:2000 dilution of anti-rabbit AlexaFluor546 secondary antibody (Invitrogen) for visualization. Cell nuclei were then stained with 3 µM Hoechst 33342 (Invitrogen).
Fluorescent image acquisition
Images of the microwells (4 fields per well) were acquired by an ImageXpress Ultra (Molecular Devices, Sunnyvale, CA) system using 20× objective. Subsequent images were analyzed using the ImageJ (http://rsb.info.nih.gov/ij/ [NIH 1997-2009]) application. The macro can be freely downloaded from the Web site of the institute at http://imaging.bii.a-star.edu.sg/projects/autophagy/Kriston_HCS_ImageJ_macro.zip. The segmenting and feature extracting algorithm identified nuclear objects through Hoechst 33342 (H0342) dye interaction with DNA and autophagosomes through MDC staining intensities.
Fluorescent image analysis
A range of computational, image processing, and statistical software is available for the phenotypic profiling of compound bioactivity at organelle, cell, cell subpopulation, or microtiter well levels. In the initial exploratory phase of this high-content cellular imaging work, the IN Cell Investigator (IN Cell Developer Toolbox, GE Healthcare, Piscataway, NJ), a commercially available application, facilitated the setup of a region growing-based imaging pipeline in a user-friendly manner and served as a benchmark imaging tool.
Image segmentation is a critical point in the imaging pipeline. Histogram-derived techniques are commonly used to perform this segmentation. These methods choose a brightness threshold (θ) by either maximizing the variance between pixel intensities associated with the foreground and background or minimizing the intraclass variance of foreground/background objects. The Isodata algorithm 23 is a representative of the former approach and the K-means clustering algorithm of the latter.
We used the fast, built-in ImageJ implementation of the Isodata algorithm to segment an image region into 1 foreground region and 1 background region. This technique was selected based on the observation that each image contained only 1 foreground and 1 background class. The Isodata algorithm initializes segmentation by dividing the maximal dynamic range of the image into 2 parts, representing foreground and background. The sample mean brightness of the foreground (mf,0) and background (mb,0) pixels is then calculated, and a new θ1 is calculated by averaging the 2 mean values. Based on this new θ1 value, the process is iterated until convergence to result in θk. 24
In those cases when images showed the existence of multiple foreground or background classes, we segmented those images with the K-means clustering 25,26 algorithm. Given the fixed number of clusters based on a priori assumptions, K-means is a simple unsupervised learning algorithm to place pixels into clusters whose centroids have maximal separation. 27 The objective of the K-means segmentation algorithm is to minimize the total intracluster pixel brightness variance. Although the algorithm is theoretically considered to be sensitive to randomly chosen pixels at initialization, it resulted in satisfactory segmentation in our practical application. We performed K-means clustering using Jarek Sacha’s “K-means clustering” plug-in 26 (http://ij-plugins.sourceforge.net/plugins/clustering/).
Cell proliferation measurement requires the precise identification of the nucleus number in each well. Spatial staining variability in H0342 staining can, however, result in a mixed population of weakly and strongly fluorescent nuclei. This variation complicates the accurate identification of these nuclei across the image. Segmentation methods can compensate for these variations in staining quality. These methods can be applied on an image either globally or locally. However, global whole-image segmentation with a single threshold (θ) cannot compensate for variable weak and strong staining resulting from variations in protocol or tissue type. In general, a global segmentation method can be effective when working with uniformly fluorescent foreground pixels over uniformly dark background pixels with no spatial changes.
In our case, segmentation with a global threshold can correctly identify strongly fluorescent nuclei but leads to false negatives by missing weakly stained nuclei. In addition, histogram-derived segmentation techniques using a single global threshold also cause false-negative pixels and/or false positives, if the global range of θ is spanned toward darker values.
Spectral bleed-through is the other factor that hinders the global application of a single-threshold segmentation. Both H0342 and MDC dyes are excited on the same wavelength (360 nm), and given some overlap between the broad emission spectra of both dyes, it is inevitable that some fluorescence emission from the MDC staining is detected in the nuclear fluorescence (H0342-optimized) channel (Ch1) as shown in
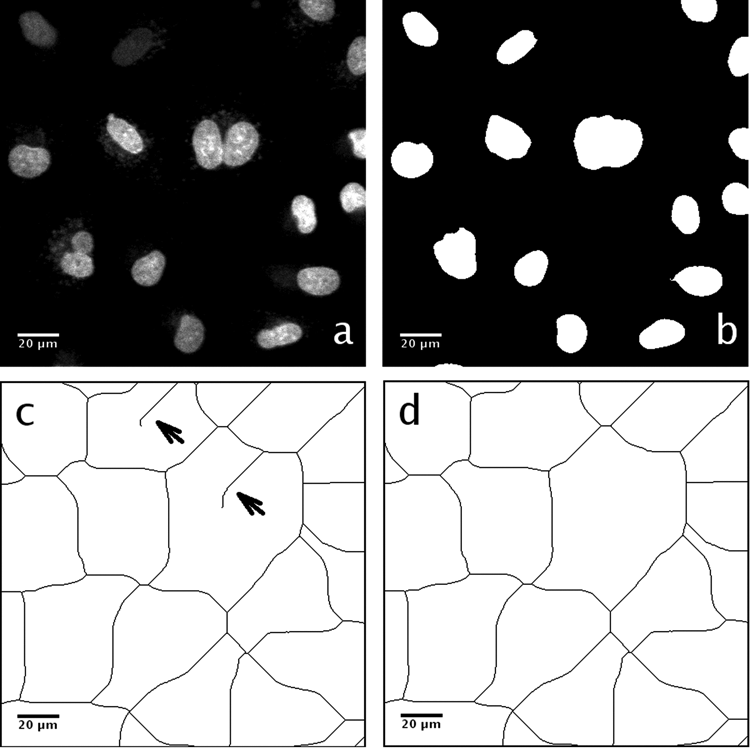
Generation of the influence zone binary image. (
For assay quality control, we used 3 well-established quality control (QC) metrics: coefficient of variation (CV), Z′ factor, and signal-to-background (S/B) ratio. 20 Coefficient of variation was calculated to measure the precision relative to the mean values calculated for c− as minimum and c+ as maximum signals.
In the subsequent plate, uniformity analysis Z′ values 19,20 were calculated for total and mean AV intensities of the control wells. Z′ takes into account the c− and c+ variability and the dynamic range of the assay too, and it is therefore an invaluable and widely used QC measure. The S/B ratio was expressed as SB = µc+/µc−, denoting the ratio of the mean values of positive and negative controls, respectively. The R script that we developed for the calculation is freely downloadable from the Bioinformatics Institute’s Web site: http://imaging.bii.a-star.edu.sg/projects/autophagy/Kriston_HCS_R_script.R.
Bioimage processing and statistical analysis was embedded into the HCS workflow as
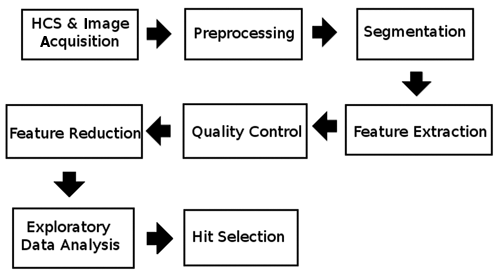
Overall workflow diagram.
Results
Preprocessing
Our proposed imaging workflow addresses both problems caused by the spectral bleed-through and punctate AV foreground by decomposing the image into subimages (influence zones). An influence zone represents an equally divided image partition approximating cell boundaries around one or a few nuclear “seeds” that serve as predefined markers.
28
An influence zone image was generated based on the influence zone image generation pipeline presented in Supplemental Figure S1 using a Ch1 image (
Segmentation: nuclear channel
Local segmentation was designed to analyze each influence zone individually. Assumptions were chosen to be as permissive as possible. An influence zone on Ch1 was supposed to contain either 1 or more nuclei with optional autophagosomal bleed-through pixels forming weaker stained punctate regions than the nuclei. Because H0342-derived fluorescent pixels’ appearance was assumed on Ch2, the nuclear pixels were blanked to zero to eliminate nuclear bleed-through.
As shown in
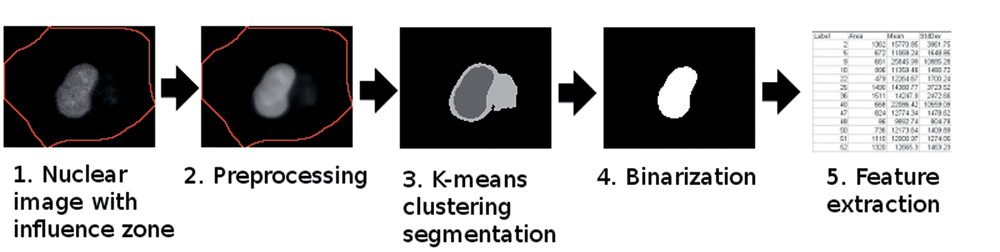
Imaging pipeline of the proposed local segmentation and feature extraction of nuclei.
Segmentation was performed on the median filtered result image. The K-means algorithm was used due to our observation that multiple foreground and/or background clusters exist in each Ch1 influence zone. Autophagosomal bleed-through led to multiple background clusters, where the centroid brightness value of the AV bleed-through cluster was typically lower than that of a strongly stained nucleus and higher than that of the local background. Based on this observation, 3 fixed clusters were selected indicating the local background, AV bleed-through, and nuclear foreground clusters.
A current limitation of the pipeline is the assumption that if multiple nuclei exist in a single influence zone, then they have similar brightness and thus fall into the same cluster. When the source of multiple foreground clusters is that of the H0342 staining variance, only those detected nuclei are clustered into the brightest centroid cluster. This limitation does not cause a systematic error, and the number of such influence zones is low. There is room for improvement of the speed of the imaging macro; currently, images of 1 to 3 plates can be processed overnight by a PC equipped with an Intel Core 2 Extreme X9650 quad core 3-GHz CPU and 16 GB memory. Influence zone generation takes an additional hour per plate, but the process can be run in parallel with other applications in a current multicore system.
During the binarization step, the 3 clusters with centroids µ1, µ2, and µ3 were classified as foreground or background. The darkest cluster with the lowest centroid brightness value (µ3) was always classified as local background and the brightest (µ1) as foreground (i.e., nucleus). The middle cluster (µ2) between those two acted as either nucleus or AV bleed-through depending on an empirically determined cluster centroid value. Because bitdepth of the images was 16, pixel intensity values ranged between zero and 216 − 1 = 65,535. We used θnuc as a threshold between strongly and weakly stained nuclei with a constant value such as θnuc = 10,000. In practice, µ2 was considered a nuclear cluster if µ1 > θnuc and µ2 > θnuc. Furthermore, µ2 was considered an AV bleed-through cluster if µ1 > θnuc and µ2 < θnuc.
Ambiguity occurred when an influence zone contained a weakly stained nucleus (µ1 < θnuc and µ2 < θnuc). In such cases, the centroids of nuclear and AV bleed-through clusters (if applicable) had similar brightness, and therefore it was not possible to separate them based on intensity. In the presence of an AV bleed-through, there was a chance for false-positive pixels if both µ1 and µ2 clusters were selected to be foregrounds. In the absence of an AV bleed-through, there was a chance for falsely segmented pixels, if the cluster µ2 alone was selected to be foreground. Choosing a segmentation threshold as θ = (µ1 + µ2)/2 resulted in a satisfying compromise when segmenting those influence zones.
Nuclear segmentation can result in merged nuclei artifacts when nuclei stained with a similar fluorescence intensity were located near each other in the same influence zone. A watershed algorithm was applied to separate such clumped nuclei if its circularity exceeded 0.63, an empirically determined value.
Feature extraction: nuclear channel
Because the number of influence zones in an image did not always correlate with the number of nuclei, the nuclei were counted based on a separate nuclear segmentation and binarization. Median area size of n = 4986 negative control (DMSO-treated) nuclei were measured as ā = 150 µm2, σ = 71 µm2. A highly permissive empirical size threshold of 32 µm2 (= 200 pixel2) was applied, and smaller objects were not considered nuclei and were filtered out.
Morphology, intensity, and texture-based nuclear features were extracted after nuclear segmentation to describe nuclei numerically. Basic shape descriptors such as area, circularity, and Feret’s diameter (also termed maximum caliper length, the longest distance between any 2 points along the nuclear contour) were computed using built-in ImageJ measures. Several additional nuclear morphological features were also computed using the Particles8 plug-in 30 (version 2.10) by Gabriel Landini: breadth (the largest axis perpendicular to Feret’s diameter), area of the convex hull polygon, and radius of the minimal bounding circle, to name a few. The complete list is available at the author’s Web site. 30 Particle coordinates were also extracted such as the binary blob’s centroid and the center of mass based on the brightness-weighted centroid. Intensity-based nuclear features included total, mean, median, and standard deviation of intensity.
For textural features extraction, the Gray Level Correlation Matrix Texture Analyzer plug-in was used (GLCM_Texture version 0.4, authored by Julio E. Cabrera and available at http://rsb.info.nih.gov/ij/plugins/texture.html [accessed March 30, 2010]), which calculated 5 standard texture features (angular second moment, contrast, correlation, inverse difference moment, entropy) from the co-occurrence matrices.
Segmentation: AV channel
The result of nuclear segmentation was used in the local segmentation of autophagosomes (
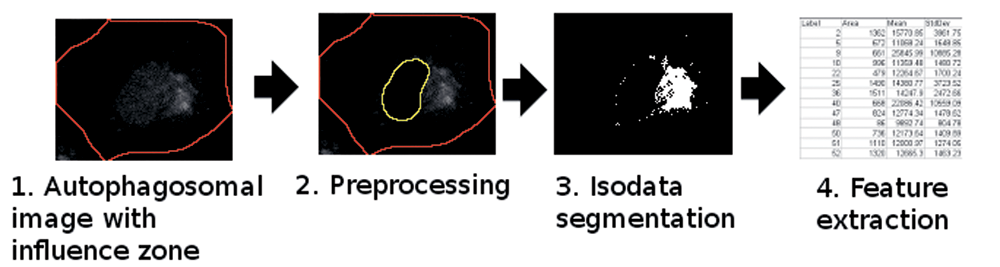
The proposed autophagic vacuole (AV) segmentation and feature extraction pipeline.
During AV segmentation, Ch2 influence zone pixels (apart from the nuclear projection) were classified into 2 groups: local background and AV. This binary presumption allowed us to use the computationally fast Isodata algorithm.
In contrast to the region-growing segmentation approach, which allocated (4 or 8) connected pixels to a central seed (e.g., here the nucleus) to form a continuous region, possibly including background pixels, the histogram-based Isodata algorithm developed a sporadic-pattern foreground presuming no connection between pixels, hence identifying more strictly the punctate AV structures. The thresholding was automatic, and θ was calculated from the image histogram.
If more than one nucleus was found in the same influence zone, the matching AV region was calculated for each nucleus separately to ensure one-to-one correspondence between an AV region and a nucleus. A region-growing method was applied from the nuclear centroids to partition the given influence zone into subzones corresponding to each nucleus. Histogram-based segmentation was then applied to those AV subzones.
Feature extraction: AV channel
The number and total area of puncta per influence zone was calculated. Intensity-based features were also calculated: minimum, maximum, standard deviation, mean, median, and total intensity of the whole AV mask.
Precision of the segmentation was validated visually by superimposing the nuclear and AV mask contours on the respective original image. Both the proposed and the region-growing segmentation method distinguished a hit from a nonhit, as depicted in
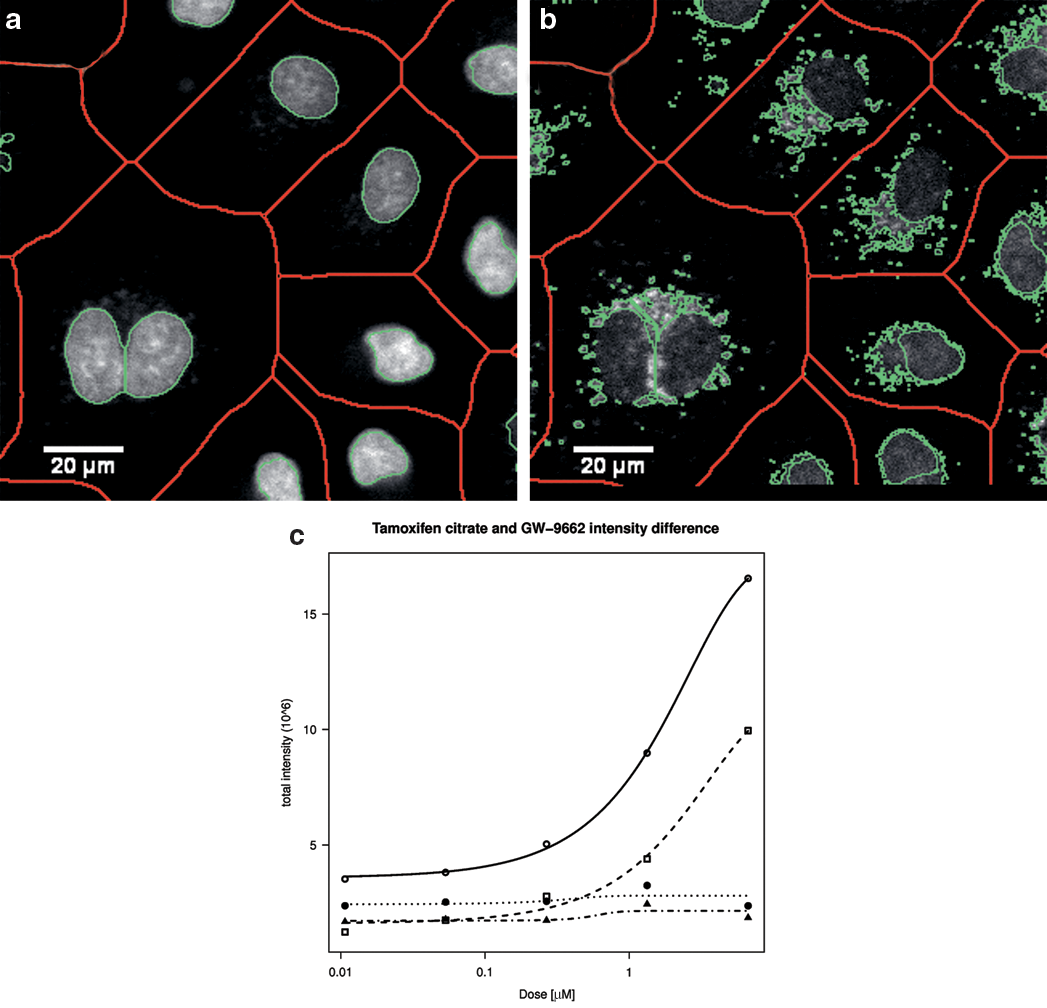
Validation of the proposed segmentation. Green contours of the (
Precise measurement of the number of nuclei is important to determine the toxicity of a compound. A ground truth image was created by manually segmenting a representative sample image in Ch1 based on pixel intensities evaluated by a human expert. The Ch1 ground truth image contained 365 nuclei (100%), the proposed segmentation resulted in the identification of 401 nuclei (110%), and the region-growing segmentation resulted in the identification of 427 nuclei (117%). Even though the proposed method had better performance, both segmentation methods measured the number of nuclei within the 20% error range that is used as a threshold to identify toxicity.
The quantification of pixel-level accuracy gives a numerical insight into the precision of the Ch2 AV segmentation. Common segmentation performance metrics
31
were used for quantification. The measurement of true-positive, false-positive, true-negative, and false-negative pixel numbers enabled the calculation of precision, sensitivity (also called true-positive rate or recall), specificity, false-positive rate, and F-measure. Perfect segmentation is indicated by 100% values for precision, sensitivity, specificity, and F-measure. A near-zero false-positive rate value indicates good segmentation as well. One hundred percent sensitivity of pixel-level segmentation means that all real AV pixels are segmented as foreground pixels. The sensitivity was 71.5% for the proposed segmentation method and 71.0% for the region-growing segmentation. The specificity measure was 99.8% and 54.9% for the proposed and region-growing methods, respectively. The lower value of the latter was due to the high number of false-positive pixels (
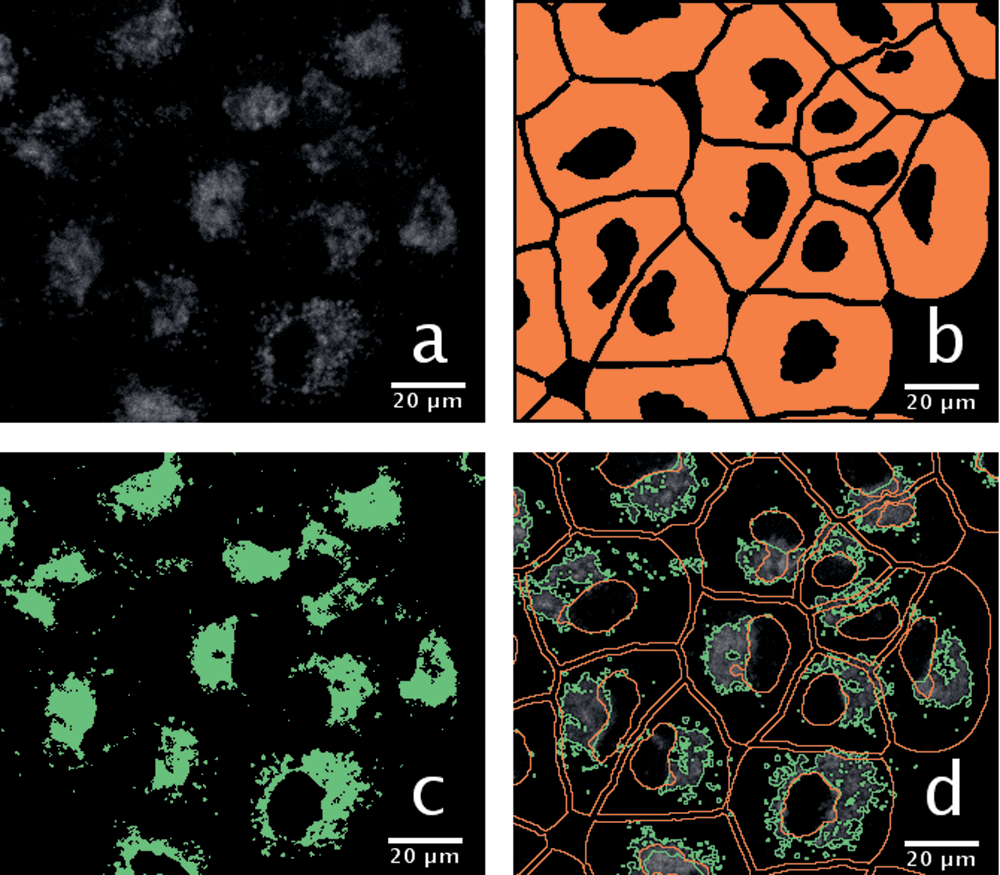
Comparison of the proposed and the region-growing pipelines. (
Segmentation of AV areas using either the region-growing (
Quality control
Following phenotypic feature extraction, statistical analyses were carried out to serve 2 main purposes: (1) to calculate plate quality metrics and (2) to provide decision support for hit selection. We developed a custom script in the R language (R Project for Statistical Computing) and used TIBCO Spotfire (Somerville, MA) for data visualization.
QC plays a crucial role in assay performance evaluation to determine if we can identify a hit with confidence. AV fluorescence intensities of negative control (c−) and positive control (c+) wells were used to compute an overall plate quality. Three established QC metrics were used: CV, Z′ factor, and S/B ratio.
CV values were calculated on cell number as well as on the total and mean AV intensity of negative and positive control wells. For the majority of the plates, CV values fell under 0.15 using any segmentation method. Z′ values of both total and mean AV intensities were above our range of acceptance 32 (Z′ > 0.40) in a representative plate, with Z′AV mean = 0.59 and Z′AV total = 0.66. The medians of Z′AV total were 0.41 and 0.39 in plates of the primary and secondary screen, respectively. A high S/B ratio (S/B > 2) is required to evaluate the assay as screenable. 20 S/B distributions of our assays ranged above that limit, as shown in Supplemental Figure S2. In the supplemental figure, quality control boxplots of S/B ratio represent primary (MDC) and secondary (LC3) assays, segmented by histogram-based (IJ) and region-growing (GE) methods. All assays by both methods spread above the acceptable S/B > 2 range. 20 The IJ and GE data sets showed significant difference (p-valueMDC = 0.0016 using the 2-sample t-test and p-valueLC3 = 0.0015 using the Welch 2-sample t-test).
Feature reduction
Throughout the feature collection phase of the workflow, a set of 44 nuclear and AV features was collected (intensity, morphology, and texture based) for each cell. The statistical correlation between these features was investigated by correlation analysis and hierarchical clustering. The results are shown on a heatmap with a dendrogram in
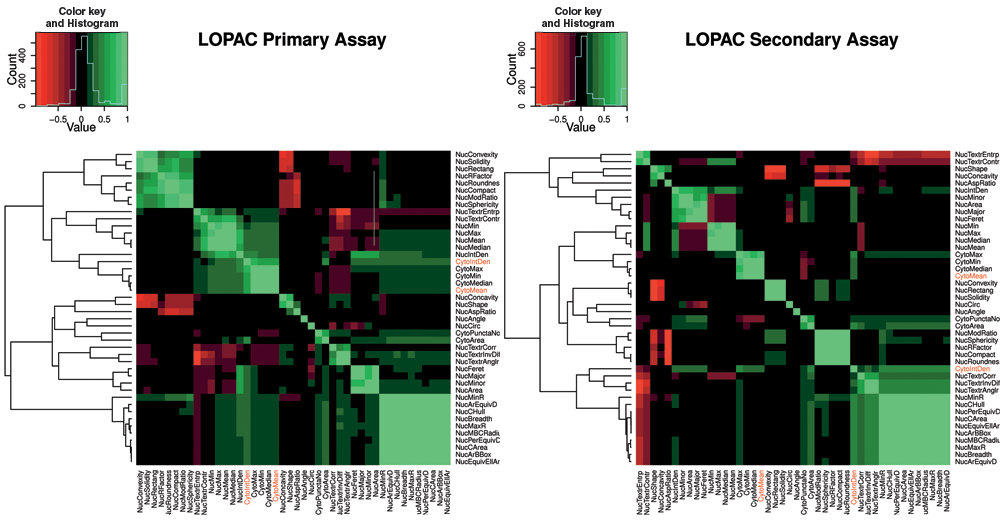
Heatmap and dendrogram representation of primary screen (left) and secondary screen (right) correlation coefficients between the 44 collected features using R statistical software. Sample sizes: Nprimary = 1,473,461 cells; Nsecondary = 395,017 cells.
Feature reduction is an important practical step in data mining because irrelevant features “confuse” machine learning systems. 33
To identify redundant, irrelevant features and reduce dimensionality, a correlation-based feature selector was used to determine the predictive power of each feature. Features were restricted by a correlation-based feature selecting subset evaluator 34 (CfsSubsetEval). That algorithm was implemented under the Weka 33 machine learning software. CfsSubsetEval provides the advantage to assess the predictive ability of each feature individually, selecting those being highly correlated with the hit/nonhit class, but have low intercorrelation with other features. Weka’s “BestFirst” 33 search method was performed on the feature space to find the subset that predicts the class best.
The feature selection method above determined how many times each feature was selected during a 10-fold cross-validation. Two features were selected: AVfold and Cytotox; both are present in 9 out of 10 folds of our cross-validation, and hence the 9 (90%) entry in the primary assay and 80% (AVfold) and 100% (Cytotox) in the secondary assay. AVfold is a feature derived from MDC staining intensity. The AV median (CDM) of a well is calculated by the mean AV pixel intensities of each cell. AVfold is calculated by dividing a compound’s CDM by the median of the 8 DMSO wells’ CDM (100%). Cytotox refers to compound toxicity where the cell number of a compound is divided by the mean cell numbers of 8 DMSO wells (100%).
The 2 selected features, AVfold and Cytotox, are the dominant features with obvious biological interpretation, both in the primary and secondary assays. However, other features could also be considered to separate novel compounds based on either only the primary or the secondary assay 10-fold cross-validation.
The standard deviation of the nuclear area and the AV mean intensity shows a 10 (100%) entry only in the primary assay but not in the secondary assay. The mean, median, and standard deviation of AV total intensity features have a 100% entry value in the secondary assay but not in the primary assay. The above-mentioned features are similar to the dominant intensity and area features but were filtered out because the significance of these features was not consistent in the 2 assays.
Exploratory data analysis
The scatterplot of the 2 selected features (
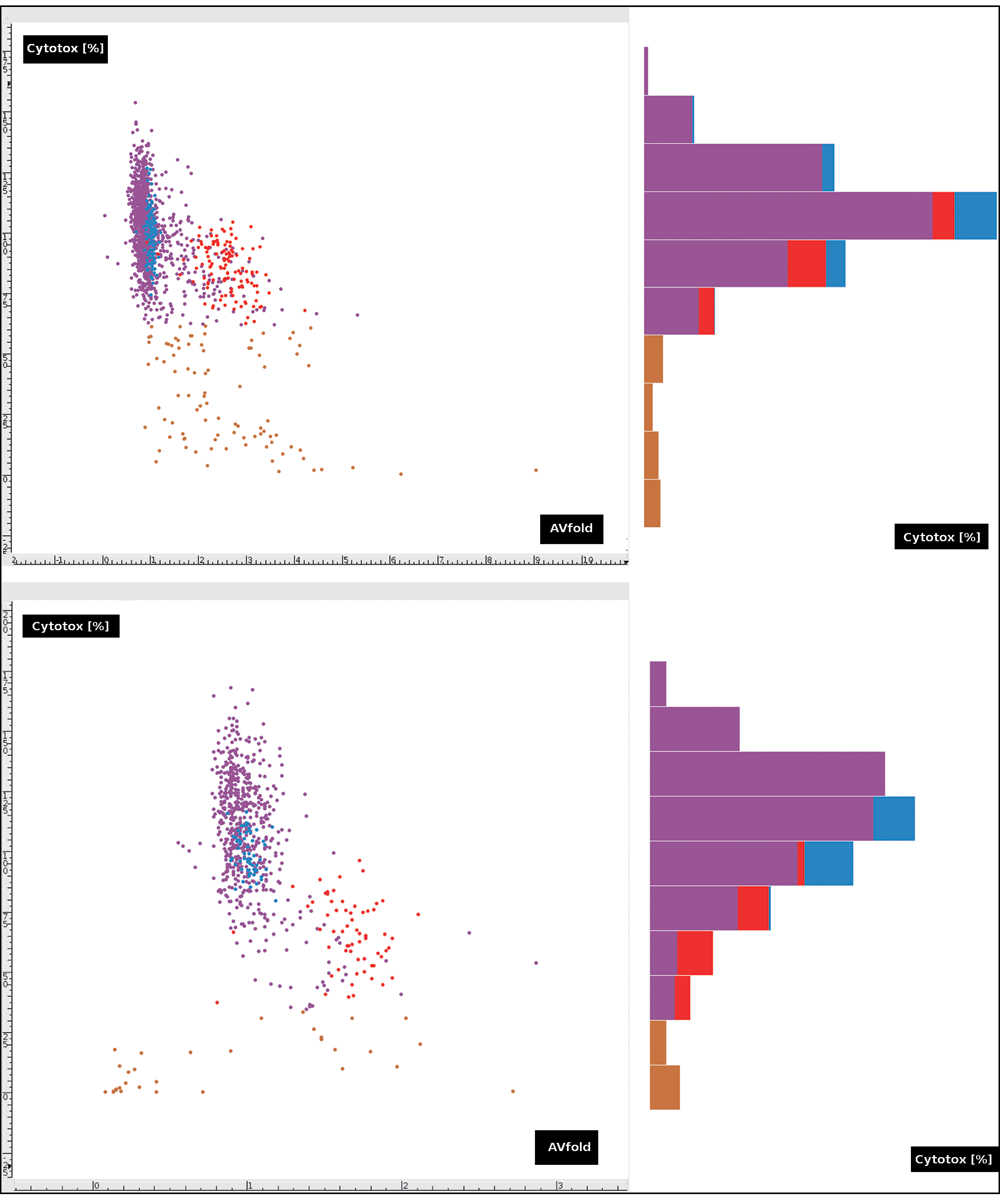
Scatterplot of primary (upper left) and secondary (lower left) screen data forming 2 clusters of c− (blue) and c+ (red) by AVfold values on the x-axis and Cytotox (%) values on the y-axis. Compound data are shown as purple dots. Compound values with Cytotox <61.79% (primary) and 33.33% (secondary) (brown dots) are considered outliers by the histograms (right).
Because outliers strongly affected the Support Vector Machine hyperplane calculation, we removed those c+ values.
Hit selection
The supervised classification method Support Vector Machine (SVM) was used for automatic hit selection because it has been found to be superior in high-content cell identification. 35 We used the SVM implementation of the R-project (package e1071). The classifier was trained using the negative and positive controls. Outliers were removed from the training set to increase the reliability of the classification. To test our classifier, we applied a 100-fold cross-validation with a test set fraction of c− and c+. The SVM using the linear kernel with default settings (C = 1, γ = 0.5) resulted in a model (see Suppl. Fig. S3) with total accuracy of 99.6%. The supplemental scatterplot shows the primary screen (left) and secondary screen (right) models calculated by the SVM classifier (linear kernel, C = 1, γ = 0.5) with c− (red dots in region a) and c+ (green dots in region b) data as the training set. Crosses indicate support vectors. The verification rate increased to 100% after removing c+ outliers. No further SVM parameter optimization seemed necessary due to the high correct classification rate.
The c+ component in the training data set of the secondary screen shows a slight cytotoxicity by shifting the c+ cluster toward the lower Cytotox domain. In addition to the highly accurate classification, the large margins between the 2 training clusters resulted in a higher number of automatically selected hits than that of the threshold-based selected hits.
Using SVM as a machine learning approach and the nuclear number ratio cutoff for hit selection, 163 compounds were selected as hits out of 1280 in the primary assay. Following the prevailing practice, a subjective, expert-determined (threshold-based) hit selection procedure was also carried out using the results of the region-growing imaging pipeline, with thresholds AVfold >2 and Cytotox >80%. The cutoff value AVfold >2 was chosen because the human expert could explicitly detect such an intensity difference by eye. The threshold-based method suggested 159 compounds with an overlap of 96 compounds of the 162 proposed by the machine learning method (see the Venn diagram in Suppl. Fig. S4 where TH_PR and ML_PR are mean hits of the primary screen by threshold-based and machine learning methods, respectively).
In the secondary assay, 30 hits (100%) were suggested by the threshold-based method, of which 26 were also selected by the machine learning–based method, resulting in an 87% overlap (see the supplementary Venn diagram in Suppl. Fig. S5 where TH_SC and ML_SC are mean hits of the secondary screen by threshold-based and machine learning methods, respectively). The mutual overlap of the 4 distinct sets contains 19 compounds (shown in Suppl. Fig. S6). Four threshold-based selected compounds were not listed among the secondary hits selected by machine learning. The machine learning–based method resulted in 19 additional secondary hits due to the more permissive Cytotox >33.33% threshold.
Machine learning–based primary hits contained 21 compounds (70%) of the 30 secondary assay hits suggested by the threshold-based method.
Discussion
We have presented an image-processing high-content analytical pipeline that is readily applicable to high-content cellular screens to identify novel selective pharmacological inducers of autophagy in compound libraries. Two different image segmentation approaches were evaluated. Histogram-derived segmentation algorithms such as K-means clustering and Isodata allowed pixel-level precision at segmenting the sporadic-pattern autophagosomes. Applying those algorithms locally enabled us to demonstrate a superior segmentation precision.
In cases where high levels of image noise are present, the region-growing segmentation approach may be adversely affected. However, the proposed segmentation approaches outlined here are less sensitive to image noise and should provide superior hit identification.
The speed of the proposed imaging macro currently limits the processing to 1 to 3 plates by overnight by a desktop PC, leaving potential room for future improvement. Implementing the current macro in the form of an ImageJ plug-in will provide an opportunity to exploit more multicore functions. A dedicated high-performance image-processing server would also improve the processing speed.
Several 2D single-cell phenotypic, morphology-based intensity and texture features were collected. QC measures remained above our range of acceptance.
To study the correlations between features, we applied correlation analysis and hierarchical clustering data analysis techniques. The features chosen for the actual hit selection were the same when chosen by the CFS subset evaluator and the “expert user.”
Finally, we applied the SVM machine learning technique that confirmed the histogram-derived image segmentation and algorithm methods run on the commercial software.
The hit selections obtained by the 2 methods were in very good agreement. The proposed pipeline can be done only with a robust HCS assay, where an expert user can decide on meaningful features to be extracted.
Footnotes
Acknowledgements
The authors thank Wee Choo Puah, Chinta Rambabu, and Tiehua Du for fruitful discussions.