
Abstract
High-content image–based screening was developed as an approach to test a small-molecule library of compounds targeting signal transduction pathways for antiviral activity against multiple highly pathogenic RNA viruses. Of the 2843 compounds screened, 120 compounds exhibited ≥60% antiviral activity. Four compounds (E225-0969, E528-0039, G118-0778, and G544-0735), which were most active against Rift Valley fever virus (RVFV) and showed broad-spectrum antiviral activity, were selected for further evaluation for their concentration-response profile and cytotoxicity. These compounds did not show any visible cytotoxicity at the highest concentration of compound tested (200 µM). All four of these compounds were more active than ribavirin against several viruses. One compound, E225-0969, had the lowest effective concentration (EC50 = 1.9–8.92 µM) for all the viruses tested. This compound was 13- and 43-fold more inhibitory against RVFV and Chikungunya virus (CHIKV), respectively, than ribavirin. The highest selectivity index (>106.2) was for E225-0969 against CHIKV. Time-of-addition assays suggested that all four lead compounds targeted early steps in the viral life cycle (entry and/or replication) but not virus egress. Overall, this work demonstrates that high-content image analysis can be used to screen chemical libraries for new antivirals against highly pathogenic viruses.
Introduction
Multiple RNA viruses are highly pathogenic to humans, and some can cause hemorrhagic fever and/or encephalitis, including Rift Valley fever virus (RVFV), Venezuelan equine encephalitis virus (VEEV), Chikungunya virus (CHIKV), Lassa virus (LASV), Junin virus (JUNV), Marburg virus (MARV), and Ebola virus (EBOV). RVFV is a mosquito-borne virus within the family Bunyaviridae that causes a disease that severely affects livestock and humans throughout Africa and the Arabian peninsula. 1 VEEV and CHIKV are mosquito-borne viruses in the family Togaviridae. VEEV causes severe encephalitis in humans and horses, whereas CHIKV can cause an acute polyarthritis in humans. EBOV and MARV (family Filoviridae), as well as JUNV and LASV (family Arenaviridae), can cause severe hemorrhagic fevers in humans (reviewed in Bray and Murphy 2 and Yun and Walker 3 ). These highly pathogenic RNA viruses often cause severe disease in many developing countries, which already suffer from fragile economies and inadequate health care infrastructures. Moreover, many of these viruses are spreading to new geographical locations, raising global concern. Most recently, CHIKV emerged in the Western Hemisphere for the first time 4 and is now present in many Caribbean countries. There is currently no U.S. Food and Drug Administration–approved therapeutic or prophylactic treatments for any of these viruses. 5 Thus, there is an urgent need for research to develop effective new drugs and vaccines to combat these diseases.
The use of high-content image (HCI)–based screening (HCS) assays has increased the efficiency of the drug discovery process. This has been particularly true in the search for new antivirals against dengue virus, another emerging mosquito-borne virus. 6 HCS uses automated high-speed, high-resolution microscopy and image analysis to measure the phenotypic changes of a cell in a quantitative and high-throughput manner. 7 In the image-based assay, virus replication is scored by immunofluorescence assay (IFA) of viral antigen expression in the host cell following a single or multiple cycles of virus replication. As a result, a potential hit compound could be identified that targets any of the several steps of a viral life cycle, which could represent novel drug targets. Most importantly, HCS allows for the simultaneous measurement of multiple phenotypic features of the cell that may provide additional insights into the compound’s mechanism of action or toxicity profile. Having this additional information can help facilitate the decision-making process that governs the progression from a candidate compound to a successful antiviral drug.
Recently, small-molecule libraries containing compounds targeting kinases, phosphatases, or G protein–coupled receptors have been used with HCS for antiviral drug discovery.6,8,9 However, few studies have focused on the use of specific inhibitors of cellular signal transduction pathways as potential antiviral drugs. Cell signaling plays a central role in regulating a variety of cellular process, and many viruses have learned to exploit or manipulate signaling molecules for their own propagation (reviewed in Randall and Goodbourn 10 ). Therefore, screening a small-molecule library that modulates signal transduction pathways is potentially an attractive approach to discover new compounds with broad-spectrum antiviral activity.
Among the pathogenic RNA viruses described in this study, we used RVFV to determine the stage of the virus life cycle active compounds may be targeting. RVFV is an enveloped virus containing a tri-segmented, single-stranded RNA genome, which encodes for the RNA-dependent RNA polymerase (RdRp), envelope glycoproteins (Gn/Gc), nucelocapsid proteins (N), and nonstructural proteins including NSs and NSm. 11 Virus entry into cells is mediated by the binding of the envelope glycoproteins (Gn/Gc) to a yet unknown cell surface receptor, which mediates virus endocytosis. Acidification of the virus-containing endocytotic vesicle promotes virus-host membrane fusion and results in the release of the encapsidated genome and RdRp into the cytoplasm, where transcription and replication of the viral genome occurs. 12 The glycoproteins Gn and Gc form a heteromeric complex at the Golgi, where viral assembly occurs. The release of the viron-filled vesicles from the Golgi and its subsequent fusion with the cell plasma membrane releases mature virions into extracellular medium.
Here we describe the development and application of a robust and statistically reliable HCS assay to test a library of 2843 small-molecule inhibitors of cell-signaling pathways for antiviral activity against several highly pathogenic RNA viruses from four different viral families. Active compounds resulting from the screens were further characterized using time-of-addition (ToA) assays in RVFV to determine the stage of the virus life cycle the compounds are acting.
Materials and Methods
Cells and Viruses
HeLa (human adenocarcinoma), Vero (African green monkey–derived kidney epithelium) and Vero E6, BHK-21 (baby hamster kidney fibroblast), and U2-OS (human bone osteosarcoma) cells were obtained from the American Type Culture Collection (ATCC; Manassas, VA) and maintained in Dulbecco’s Modified Eagle Medium (Life Technologies, Carlsbad, CA) supplemented with 10% fetal bovine serum (Life Technologies). RVFV strains ZH548/MP-12 (MP-12) and ZH501 were obtained from The Salk Institute’s Government Services Division and from Dr. Michael Turell (USAMRIID), respectively. RVFV strain MP12 was derived from a virulent strain of RVFV (ZH548) and is highly attenuated in its virulence due to several nucleotide mutations in its genome13,14 and can be handled safely under biosafety level (BSL)–2 laboratory conditions. ZH501 is the wild-type strain of RVFV and is fully virulent, requiring BSL-3 containment. VEEV (1CSH3), CHIKV (AF15561), JUNV (Romero), LASV (Josiah), EBOV (Zaire), and MARV (Ci67) were obtained from the USAMRIID collection. All viruses were propagated in Vero cells with the exception of CHIKV, which was grown in BHK-21 cells. Virus-containing supernatant was clarified by centrifugation at 12,000g for 30 min prior to storage at −80 °C. All virus stock titers were determined by plaque assay on Vero E6 cells as previously described. 15
Virus Infections
Filovirus or arenavirus infections were performed under BSL-4 laboratory conditions. RVFV ZH501, VEEV, and CHIKV infections were performed in a BSL-3 lab, and RVFV MP12 infections were performed under BSL-2 conditions. HeLa cells were infected with virus at the multiplicities of infection (MOIs) indicated in Table 1 in 100 µL of media. Inocula were removed after 1 h, unless stated otherwise, washed one time with 1× phosphate-buffered saline (PBS), and replaced with the same amount of fresh medium. Infection was allowed to proceed for a specific duration of time, as indicated for each experiment. At the end of the incubation time, virus-infected cells were fixed in 10% neutral buffered Formalin (Sigma, St. Louis, MO) for a minimum of 24 h for BSL-3/4 viruses or 15 min for BSL-2 viruses.
Summary of optimal high-content image–based assay conditions for each virus tested.
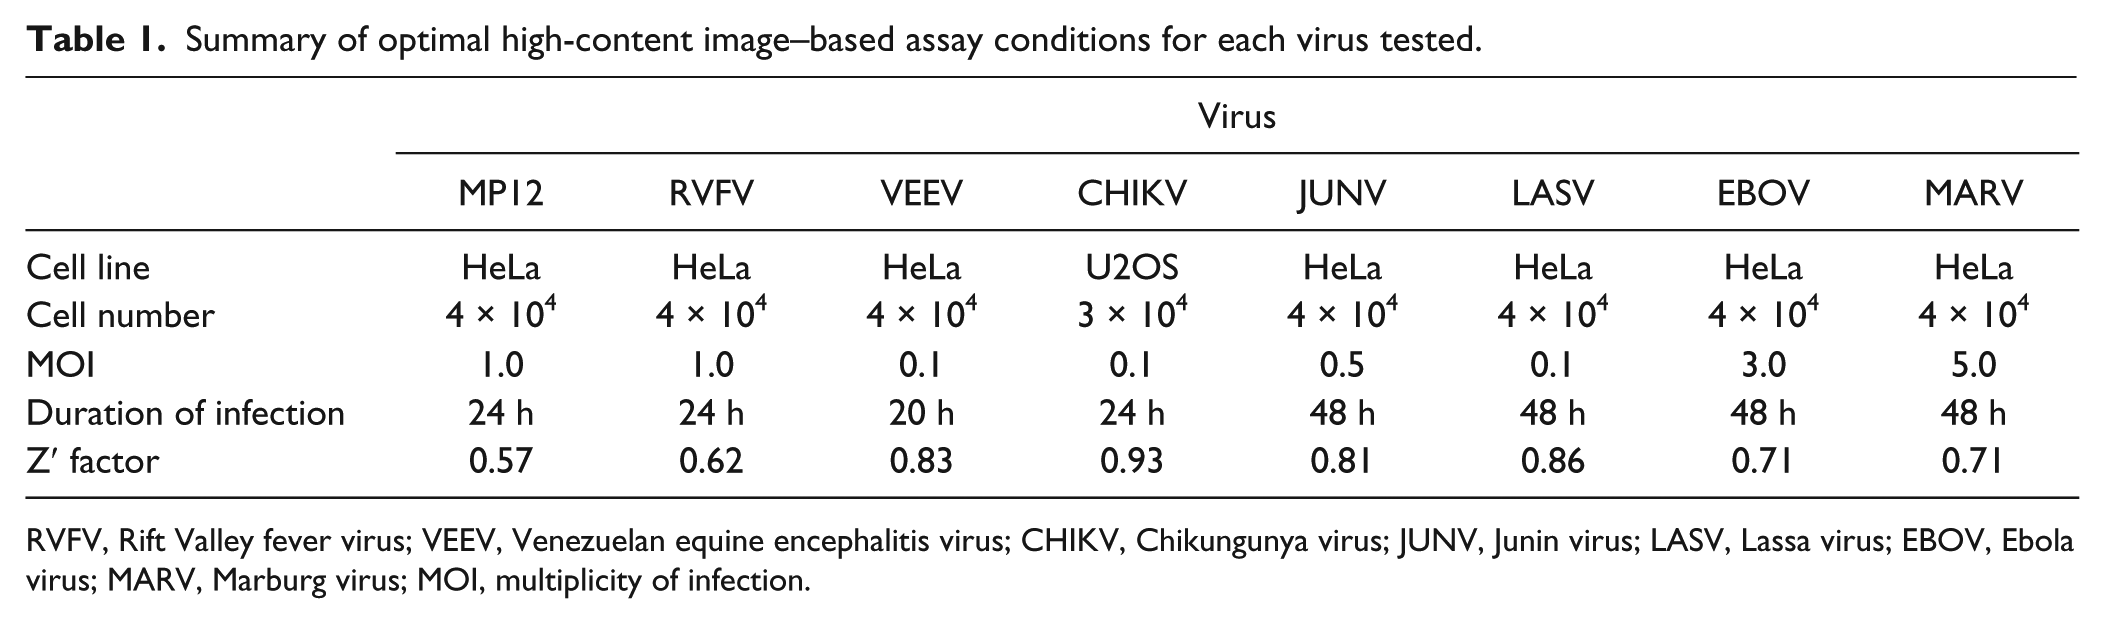
RVFV, Rift Valley fever virus; VEEV, Venezuelan equine encephalitis virus; CHIKV, Chikungunya virus; JUNV, Junin virus; LASV, Lassa virus; EBOV, Ebola virus; MARV, Marburg virus; MOI, multiplicity of infection.
Compound Library and Reference Reagents
A focused signal transduction pathway inhibitor library (ChemDiv, San Diego, CA), comprising 2843 compounds in a 96-well plate format, was used in primary and secondary screening assays. These compounds were compiled by ChemDiv based on computational prediction programs to find compounds that mimicked ligand binding regions of the receptor proteins, kinases, or transcription factors mainly regulating Wnt and Hedgehog (Hh) pathway. These compounds were not verified experimentally to target Wnt or Hh at the time this work was initiated. The compounds in the library were assigned an eight-digit code (by ChemDiv) in which the first four digits represented a unique chemical scaffold, whereas the following four digits represented a unique analog within the primary scaffold. For subsequent screening and kinetics studies, compounds were reordered (ChemDiv) at least three different times and tested independently to ensure consistency across batches. Ribavirin (Sigma-Aldrich) was used as a reference compound. All compounds from the ChemDiv pathway inhibitor library and ribavirin were prepared in 100% DMSO (Sigma-Aldrich) at 10 mM stock solution and stored at −20 °C.
Immunofluorescence Detection of Virus-Infected Cells
An IFA was used to visualize virus-infected cells. Several antibodies were tested with each virus, and the antibodies that gave the highest signal-to-noise ratio in the IFA were used for screening purposes. The various steps of the IFA were similar for all viruses, with the exception of LASV, which had to be subjected to additional antigen unmasking steps. Briefly, formalin-fixed cells were either untreated or, when necessary, permeabilized (to stain for intracellular expression of RVFV Gn or N proteins) with 0.1% (v/v) Triton-X 100 in PBS for 15 min at room temperature. LASV-infected cells were subjected to additional antigen unmasking by treating formalin-fixed cells with 300 mM sodium hydroxide (NaOH) in 100 µL volume per well of a 96-well plate for 20 min. Subsequent steps were similar for all viruses. Cells were washed three times with PBS, blocked in 3% bovine serum albumin/PBS, and treated with the corresponding primary antibody at 37 °C for 1 h followed by three additional washes with 1× PBS and secondary antibody treatment. The mouse monoclonal antibodies 4D4, R3-1D8-1-1a, 1A4A-1, 2D21-1, 6D8-1, MBG II 9G4-1, L52-161-6, and Y-GD01-AG02 were used to detect RVFV glycoprotein (GP), RVFV nucleocapsid (N), VEEV envelope 2 (E2) protein, CHIKV E2, EBOV glycoprotein, MARV GP, LASV GP, and JUNV GP, respectively. All antibodies to viral antigens were purified from the hybridoma stocks at USAMRIID. Cell nuclei and cytoplasm were labeled with Hoechst 33342 (Life Technologies) and HCS CellMask Red or Deep Red (Life Technologies), respectively, at a 1:10,000 dilution. Alexa 488-conjugated goat anti-mouse secondary antibody, Alexa 568-conjugated goat anti-rabbit antibody, or Alexa 647-conjugated goat anti-rabbit (1:1000; Life Technologies) were used to visualize primary antibodies.
Image Analysis
High-content quantitative imaging data were acquired and analyzed on an Opera confocal reader (model 3842 [Quadruple Excitation High Sensitivity] or model 5025; PerkinElmer, Waltham, MA) at two exposures using a 10× air objective. Analyses of the images were accomplished within the Opera or Columbus environment using standard Acapella scripts.
HCI-Based Assay Validation and Data Normalization
The percentage of cells expressing viral antigen was determine by HCI-based analysis. Using this image-based approach, infection with each virus was optimized for cell type, cell number, MOI, and duration of infection to achieve a 60% to 80% infection rate in the 96-well plate format. Once the assay conditions were optimized, the statistical reliability of the virus infection was evaluated by calculating the Z′ factor using the formula 1 – [(3σp + 3σn)/|µp – µn|)], where µp, σp, and µn, σn are the mean (µ) and standard deviations (σ) of both positive (p) and negative (n) controls. 16 With the exception of RVFV MP12 infection, the percentages of mock-infected and virus-infected HeLa cells were used as negative and positive controls, respectively. For RVFV MP12 infections, ribavirin-treated virus-infected cells were used as negative controls. Half of the wells (45 wells) each of a 96-well plate were used as positive or negative controls to determine the Z′ factor, and TIBCO Spotfire 4.5.0 (TIBCO Software, Palo Alto, CA) was used to generate the scatter plot distribution.
Primary Screening of the ChemDiv Signal Transduction Pathway Inhibitor Library
The ChemDiv signal transduction pathway inhibitor library was screened against RVFV strain MP12 at 20 µM in 0.5% (v/v) DMSO. Screening was performed in triplicate wells of a 96-well plate. HeLa cells were treated with compound for 2 h prior to virus infection. After virus infection at the indicated MOI ( Table 1 ), cells were washed with PBS 1, and media containing the compound were added back to the cells and remained for the duration of the infection (24 h). For subsequent screening of viruses other than MP12, to avoid multiple wash steps and liquid handling in the BSL-3/4 laboratory, virus was not removed after the 1 h infection period. To determine the compounds’ antiviral activity, the percentages of infected cells were normalized with mock-infected and virus-infected cells, which were considered as 100%, and the values obtained were subtracted from 100 to determine the percentage infection inhibition. The same formula was used for all percentage infection inhibition calculations unless specified differently. For primary screening, Z′ factor ≥0.4 was used to validate the results of the assay plates. Data were plotted in Excel to generate a heat map using “color scales” in the conditional format menu. The hit (i.e., a compound that demonstrates inhibition of virus infection) selection criteria for the primary screening was set at ≥60% inhibition of RVFV infection.
Concentration-Response Curve Analysis
Concentration-response curve (CRC) analysis was applied to determine the potency of the hit compound’s antiviral activity. Briefly, cells were seeded at a concentration of 2 × 10⁴ cells per well in a 96-well plate, and compounds were tested in a 10-point dose-response curve (twofold serial dilution from 200 µM) assay. The assay was performed in the same manner as the primary screening assay described above. Hit compounds and ribavirin were added to cells 2 h or 16 h (or overnight), respectively, prior to the start of virus infection. Each concentration of hit compound or ribavirin was tested in triplicate. Data generated from the image analysis were plotted and analyzed using the nonlinear regression formula log (inhibitor) vs. response – variable slope (four parameters) in GraphPad Prism 6 and is representative of two independent experiments. The EC50, defined as the effective concentration resulting in a 50% inhibition of RVFV infection, was used to evaluate compound activity. Compound toxicity was determined by normalizing the cell number of compound treated + virus-infected cells with mock treated (0.5% DMSO) + virus-infected cells, which were considered as 100%. The CC50 value, defined as the compound concentration resulting in a 50% reduction in cell viability (based on normalized data) compared with mock infection, was used to evaluate cell toxicity. The relative effectiveness of the compound is defined in terms of its selectivity index (SI), a value that indicates the relationship between the compound’s effective and toxic concentrations, and is calculated as SI = CC50/EC50 and is representative of two independent experiments. It is therefore desirable for a compound to have a high SI value, indicating maximum antiviral activity and minimal cell toxicity.
ATP-Based Cytotoxicity Assay
As an alternative method to access the cytotoxicity of the hit compounds, ATP levels within cells were quantified as a measure of the cell’s metabolic activity. Briefly, HeLa cells treated with hit compounds or ribavirin for 24 h were washed, and equal volumes of fresh media and CellTiter-Glo Reagent (Promega, Madison, WI) were added in a 100 µL total volume reaction. The reaction produces a luminescent signal with an intensity that is directly proportional to the amount of ATP activity in the well. Light units measured from the compound- and ribavirin-treated cells were normalized with DMSO-treated cells to determine the relative light units. The AA50 value, defined as the compound concentration resulting in a 50% reduction in ATP activity, was calculated by CRC analysis.
ToA Assay
HeLa cells (2 × 10⁴ cells per well in a 96-well plate) were either mock-infected or treated with compound 2 h prior to infection (pre), concurrent with virus infection (0 h), or at various time points postinfection as indicated in the experiment. Cells were infected with RVFV strain MP12 at an MOI of 10 for 1 h at 4 °C. After the 1 h incubation, cells were washed one time with 1× PBS to remove unattached virus and incubated at 37 °C with complete media for the duration of the experiment. After 13 h, cells were fixed in 10% formalin and immunostained to detect viral G protein expression. Experiments were performed in triplicate, and the average (±standard deviation) of three independent experiments is shown.
Results
HCI-Based Assay Development and Validation
Several critical factors were taken into consideration in developing a statistically reliable and robust image-based high-throughput screening (HTS) assay. These factors included cell type, antibody selection, staining methodology, cell seeding densities, MOI, and duration of infection. Overall, the goal was to achieve an IFA assay with a Z′ factor ≥0.5, an average infection rate of ~60% to 80% with the lowest MOI possible, and a duration of infection time that permitted multiple rounds of virus replication ( Table 1 ). The latter condition facilitated screening of compounds targeting different stages of the viruses’ life cycle. Thus, an infection rate of ~60% to 80% allowed for screening of both inhibitors and activators of virus infection simultaneously.
Vero cells were permissive to all of the viruses in our study and therefore were used to optimize the IFA conditions. A panel of antibodies against several viral antigens was tested, and the antibodies that gave the most optimal signal-to-noise ratio in infected Vero cells were selected and subsequently confirmed in human cells ( Table 1 ). Next, we sought a human cell line that was permissive to virus infection and suitable for image analysis. We tested several human cell lines including HeLa, 293T, HepG2, MCF10A, and U2-OS cells (data not shown). HeLa cells were considered the optimal cell line for assay development as they were permissive to most of the viruses tested and displayed uniformity of virus infection ( Fig. 1A ). Furthermore, HeLa cells possess a functional interferon response (unlike Vero cells), which allowed for identification of compounds that exert their antiviral activity by regulating the interferon pathway. However, for CHIKV, U2-OS cells were preferred as the virus replicated faster in this cell line and the spread of virus was more uniform, which further simplified image analysis ( Fig. 1A ). After testing various cell-seeding densities of HeLa and U2-OS cells, the seeding density of 4 × 10⁴ (HeLa) and 3 × 10⁴ (U2-OS) cells per well were selected. These were determined to be the optimal seeding densities that allowed for a sufficiently high number of cells with enough spatial resolution of images that allows proper cytoplasmic and nuclei segmentation of the cells in the population. A summary of optimal assay conditions is listed in Table 1 . Once the optimal conditions were established, the statistical robustness of the infection assay was determined.
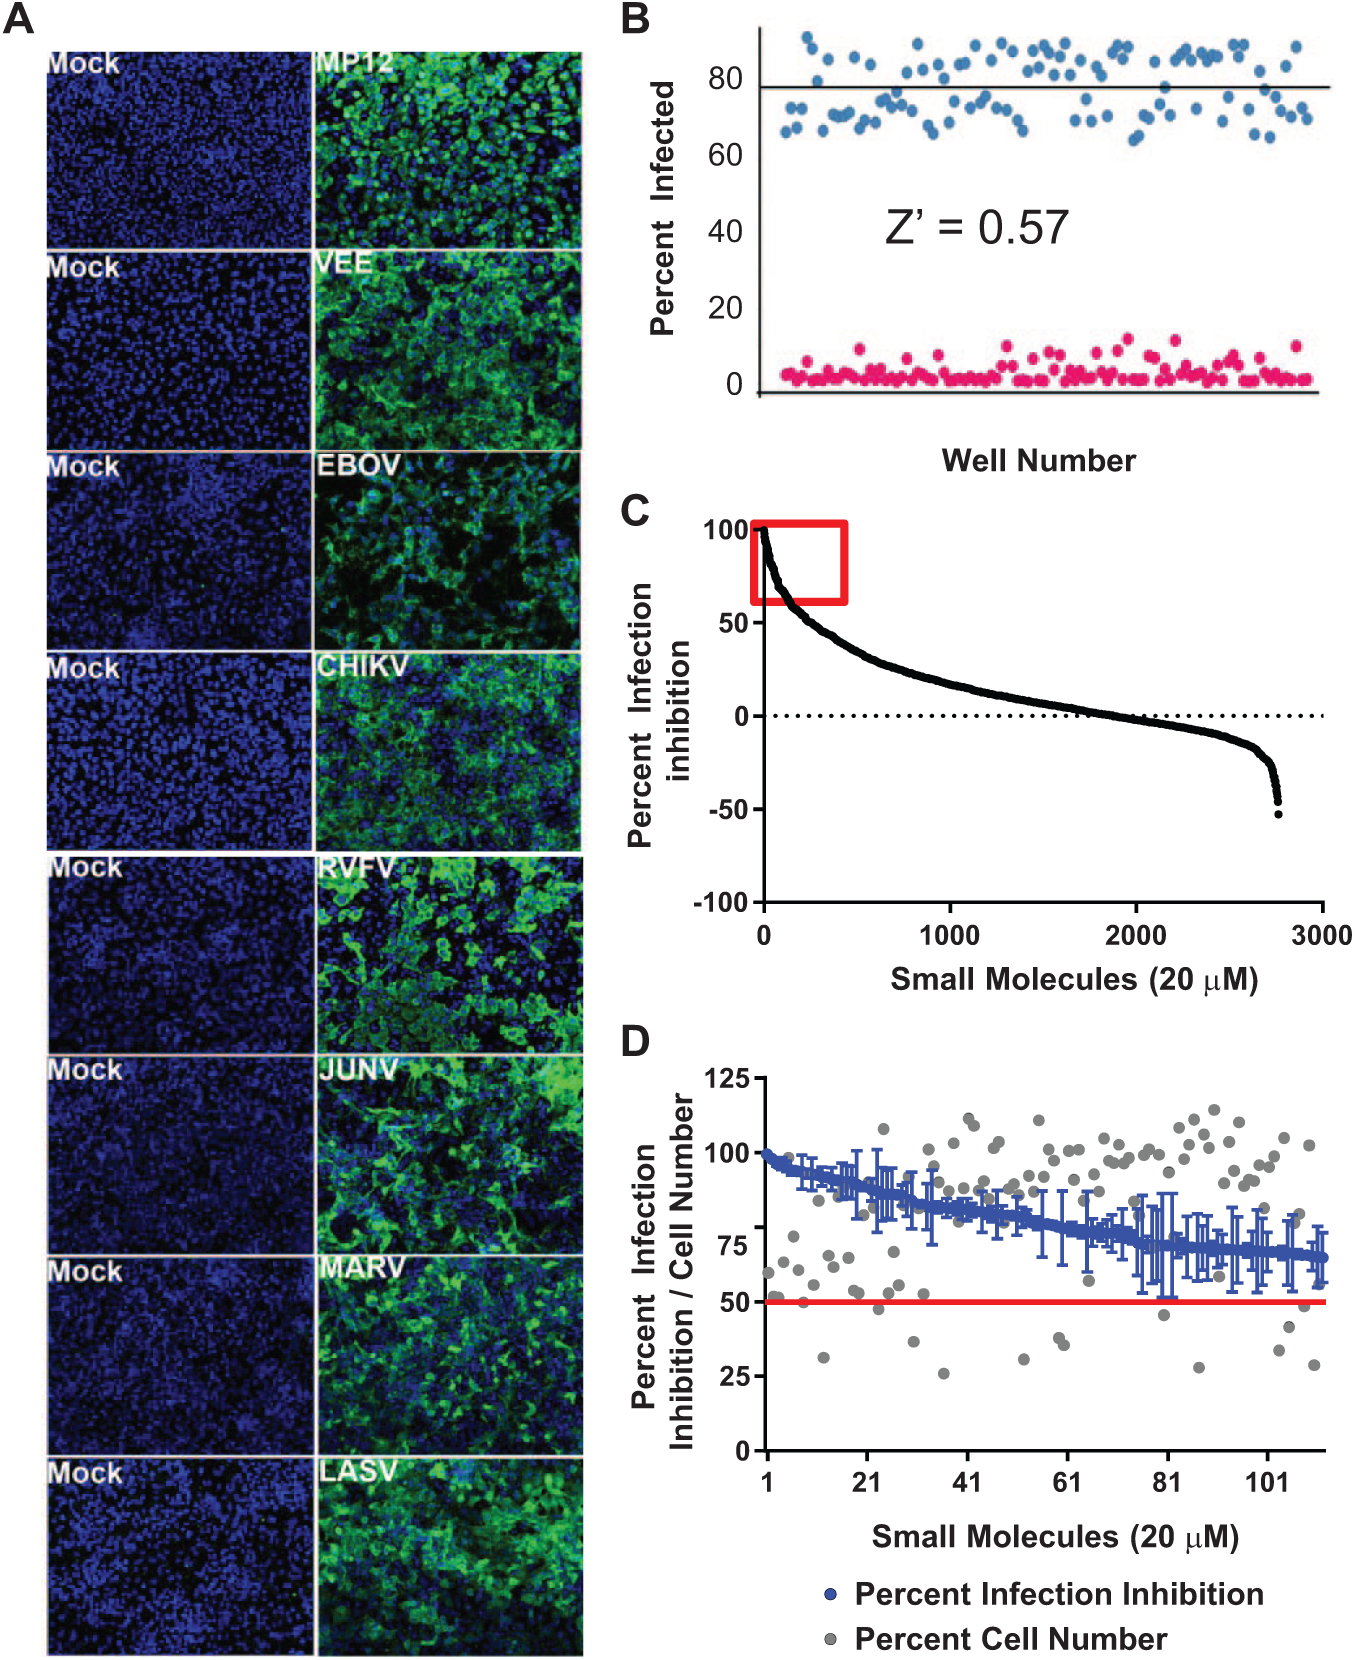
Assay development and optimization of the high-content image–based Rift Valley fever virus (RVFV) assay. (A) Immunofluorescence assay of mock-infected or virus-infected HeLa cells (U2-OS cells were used for Chikungunya virus) stained with antibodies specific for each virus. Nuclei are stained blue using Hoechst 33352 stain. (
The Z′ factor was evaluated to test the robustness of the assay in the 96-well plate format using the conditions described in Table 1 . Figure 1B shows a representation of the Z′ factor validation determination for RVFV strain MP12 infection in HeLa cells. Cells in half of a 96-well plate (45 wells) were mock-infected (negative control), whereas cells in the other half were virus-infected (positive control). In the case of RVFV MP12 (here on referred to as MP12) infections, instead of mock infection, cells were treated with ribavirin followed by virus infection. Ribavirin is a known inhibitor of RVFV infection and was used in MP12 infections to test its applicability as a negative control in the HTS assay. The Z′ factor was calculated using average and standard deviations of the percentage infection of the positive and negative controls, as described in the Materials and Methods section. 16 The experiment was performed in triplicate on three separate days, and for MP-12, the calculated Z′ factor was 0.57 ( Fig. 1B ). The calculated Z′ factors of the other viruses are shown in Table 1 and ranged from 0.62 to 0.93. A Z′ factor ≥0.5 indicates a statistically reliable separation between positive and negative controls.
Primary Screening of the ChemDiv Signal Transduction Pathway Inhibitor Library
RVFV MP-12 was used for primary screening of the 2843 compounds from the ChemDiv signal transduction pathway inhibitor library. Because of the ability to perform experiments under BSL-2 conditions, it is preferred for screening large-compound libraries. The library was screened at 20 µM concentration against MP-12 (MOI = 1, 24 h), and the primary hits were selected based on the criteria ≥60% inhibition and ≥50% cell number compared with positive controls with few exceptions. To increase the scaffold diversity, a few compounds (14 of 120) with unique scaffold but that showed <50% cell viability were still considered as hits as long they exhibited ≥60% inhibition. Figure 1C shows the distribution of the compounds in the library plotted as a function of their antiviral activity against MP-12. The distribution has a sigmoid curve shape with 120 compounds exhibiting ≥60% inhibition (red box). Figure 1D shows the distribution of the 120 compounds chosen for secondary screening. In this figure, the blue dots represent the percentage infection inhibition, whereas the gray dots represent the percentage cell number as a measure of the compounds’ cytotoxicity. Only 117 of 120 hit compounds were available from ChemDiv for subsequent secondary screening purposes.
Secondary and Tertiary Screening of Hit Compounds to Evaluate the Broad-Spectrum Antiviral Activity
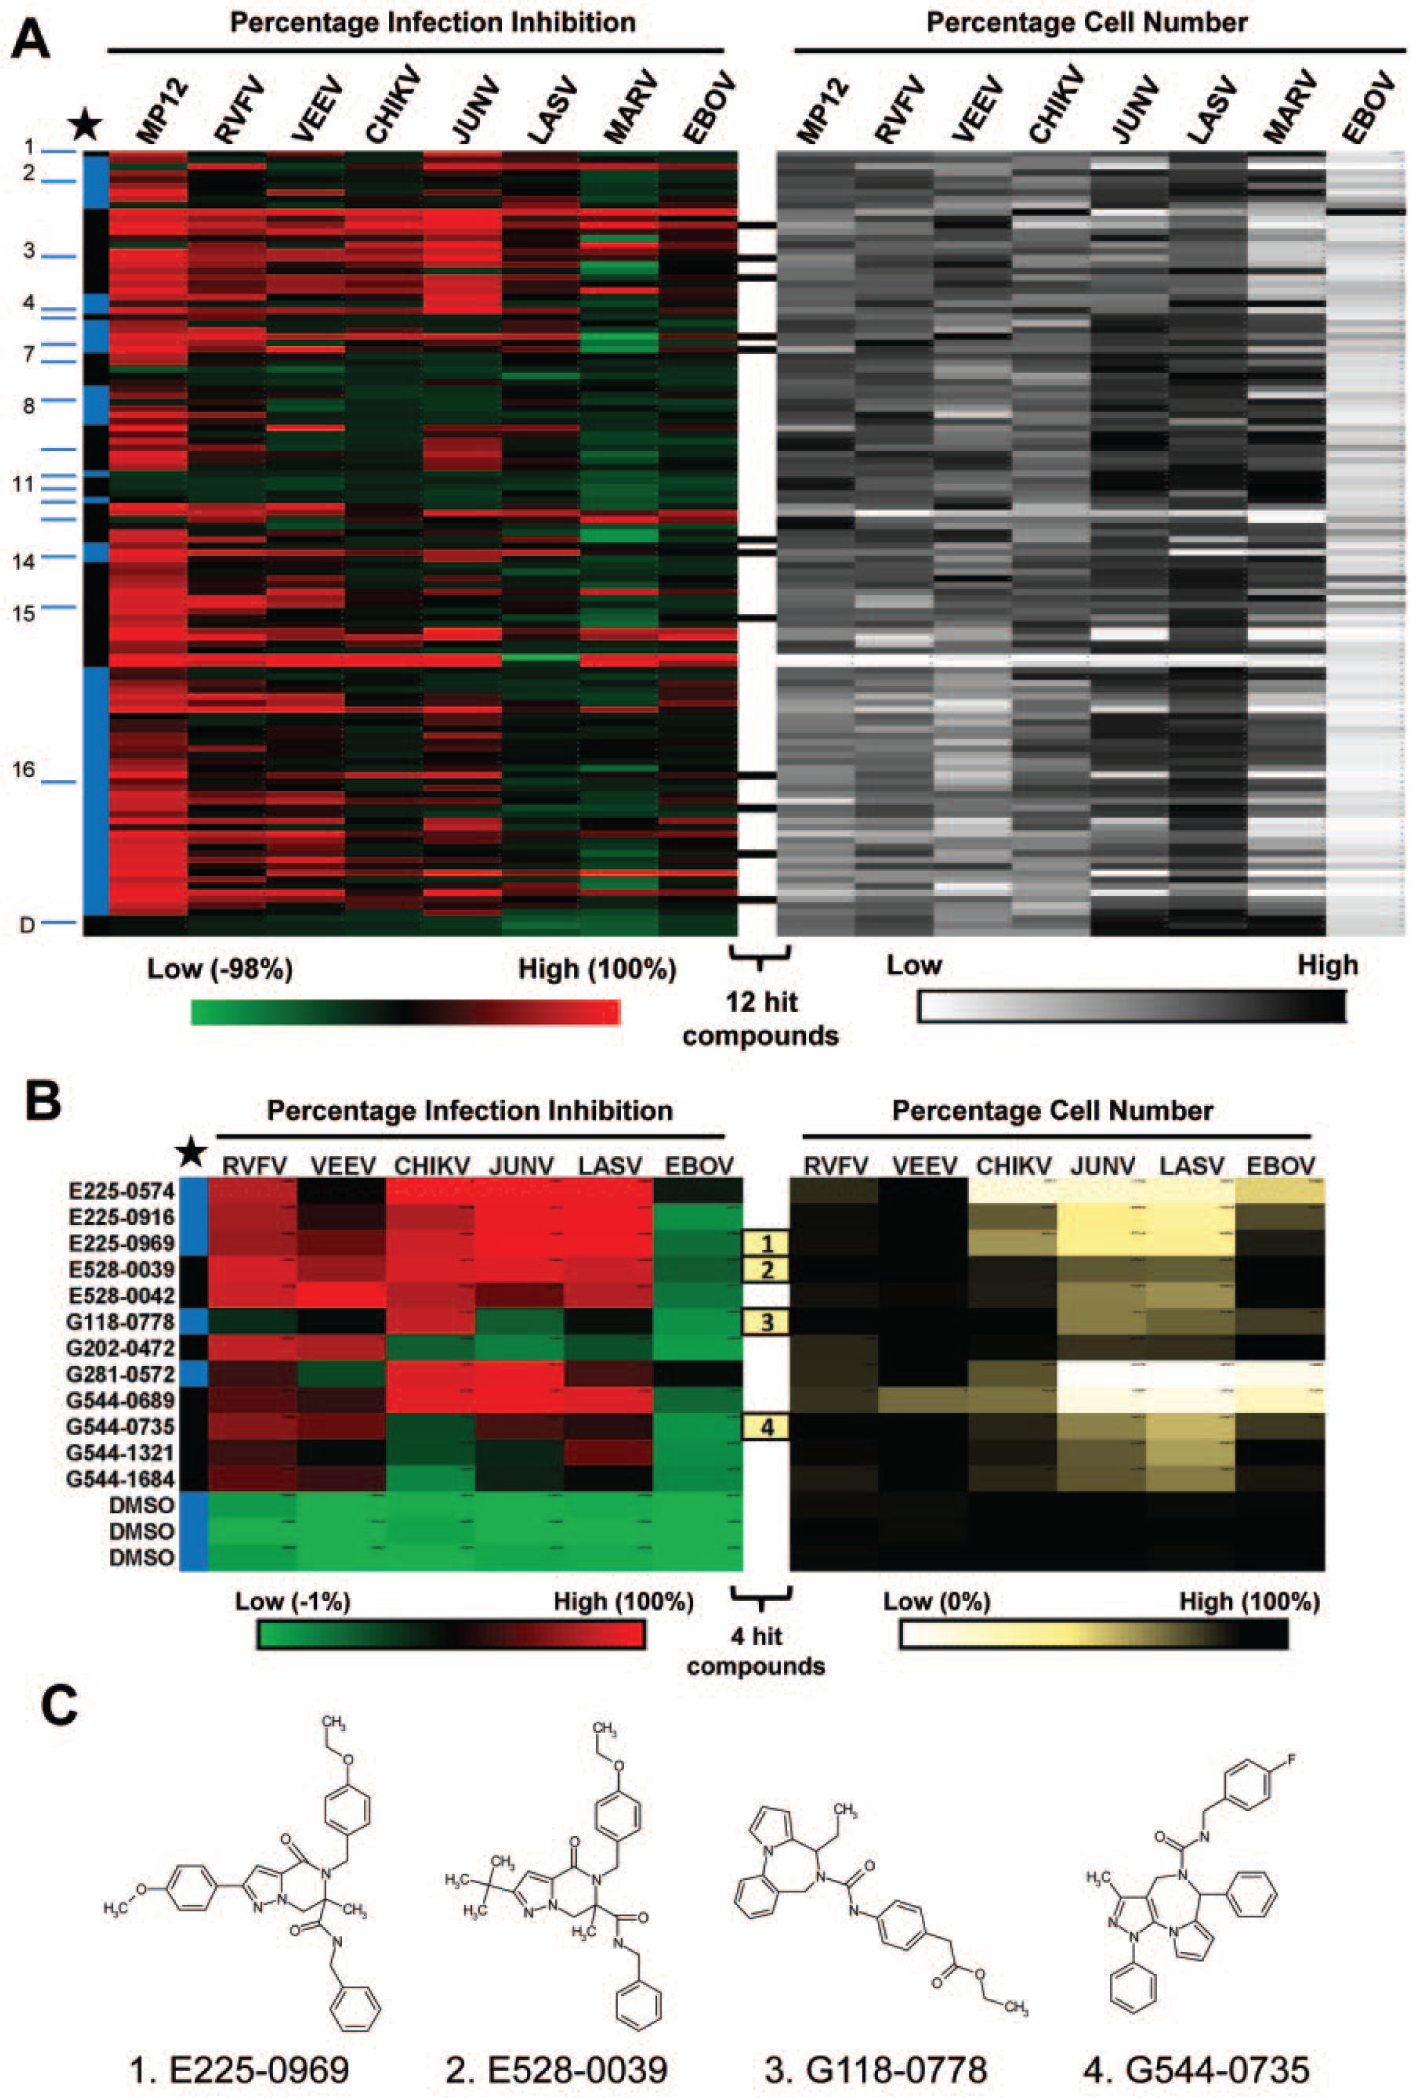
To determine if the 117 primary hits had broad-spectrum activity against other highly pathogenic RNA viruses, they were subjected to secondary screening against VEEV, CHIKV, JUNV, LASV, MARV, EBOV, and the virulent RVFV ZH501 strain, in addition to MP-12. Figure 2A shows a heat map of the percentage virus infection inhibition and percentage cell viability. Compounds were classified into 16 groups, each representing a unique scaffold and marked by alternating numbered blue and black bars. Some scaffolds were highly represented in the library; for example, group 16 represented 38 analogs of the total 117 hits. As can be seen in the heat map, most of the compounds had varying degrees of activity across multiple RNA viruses tested. None of the compounds had antiviral activity against the filoviruses (EBOV and MARV) without compromising cell viability. Twelve compounds ( Fig. 2A , black bars) that inhibited at least two of the viruses by greater than 60% and with low cytotoxic effects were reordered from ChemDiv and further validated in tertiary screening ( Fig. 2B ).
Secondary and tertiary screening of primary hit compounds against multiple RNA viruses. (
Because none of the compounds were active against the filoviruses, we chose to eliminate MARV but retained EBOV as a virus negative control in the tertiary screen. Figure 2B shows a heat map of percentage infection inhibition and cell number generated from the tertiary screening. Compound numbers are listed on the left and are grouped according to their primary chemical structure (four-digit prefix and alternating black and blue bars). As expected, none of the compounds showed antiviral activity against EBOV but were active, albeit to a different extent, against RVFV, VEEV, CHIKV, JUNV, and LASV. Four of the hit compounds ( Fig. 2B , yellow bars numbered 1–4) showing broad-spectrum activity and low cytotoxicity, and each representing a unique scaffold were selected to determine their EC50, CC50, SI, and mechanism of action against RVFV. These compounds were E225-0969, E528-0039, G118-0778, and G544-0735, and their chemical structures are shown in Figure 2C .
Antiviral Efficacy of the Hit Compounds
Antiviral activities of the four hit compounds against RVFV, CHIKV, VEEV, JUNV, and LASV were determined by CRC analysis in HeLa cells. The EC50, CC50, and SI were determined for the four compounds and the reference compound ribavirin, a known inhibitor of many RNA viruses. None of the compounds were toxic to HeLa cells at the maximum concentration tested (200 µM), and thus all compounds tested had an SI of greater than 1, indicating that the virus inhibitory effects were apparent before the cytotoxic effects appeared. Table 2 summarizes the data. G118-0778 had the highest effective concentration with an EC50 = 36.4 µM, 18.89 µM, and 62.1 µM for RVFV, VEEV, and CHIKV, respectively. The same compound had no antiviral activity at the maximum concentration tested (200 µM) for JUNV or LASV. On the other hand, E225-0969 had the lowest effective concentration (EC50 = 1.9–8.92 µM). Significantly, this compound was 13-, 4-, and 43-fold more active against RVFV, VEEV, and CHIKV, respectively, than was ribavirin ( Table 2 ). In fact, all four hit compounds were more active than ribavirin against RVFV, VEEV, and CHIKV. The highest SI (>106.2) was for E225-0969 against CHIKV.
Summary of EC50, CC50, and SI for the four hit compounds for RVFV, CHIKV, VEEV, and LASV.
Three replicates of each concentration were used in a 10-point concentration-response curve, and the data are representative of two independent experiments. SI, selectivity index; RVFV, Rift Valley fever virus; CHIKV, Chikungunya virus; VEEV, Venezuelan equine encephalitis virus; LASV, Lassa virus; JUNV, Junin virus; ND, not determined.
SI is determined by the formula CC50/EC50.
Determined using the maximum concentration of compound tested (200 µM).
Cytotoxicity Using ATP Activity-Based Assay
As an alternative to cell number–based measurement of the compounds’ cytotoxicity, a luciferase reporter assay that quantifies the ATP levels in cells was used. A CRC was generated, and compound concentration at 50% ATP activity was determined (AA50) using the ATP-based assay ( Fig. 3 , blue) and plotted along with the relative cell number ( Fig. 3 , red). Although there was a concentration-dependent reduction in cell number for all four hit compounds and ribavirin, the concentration of compound required to reduce the cell numbers by 50% (i.e., CC50) was >200 µM for all of the compounds. On the other hand, when using the ATP activity-based assay, the AA50 was 32.9, 52.2, 111.2, and 121.2 for G544-0735, E225-0969, G118-0778, and ribavirin, respectively. For E528-0039, the AA50 was >200 µM, similar to the CC50. With the exception of G544-0735, AA50 values of the remaining three hit compounds and ribavirin were higher to their EC50 values against all the viruses that these compounds were effective. On the contrary AA50 values of G544-0735 was higher to EC50 values with RVFV and VEEV but lower to EC50 values with JUNV, LASV, and CHIKV.
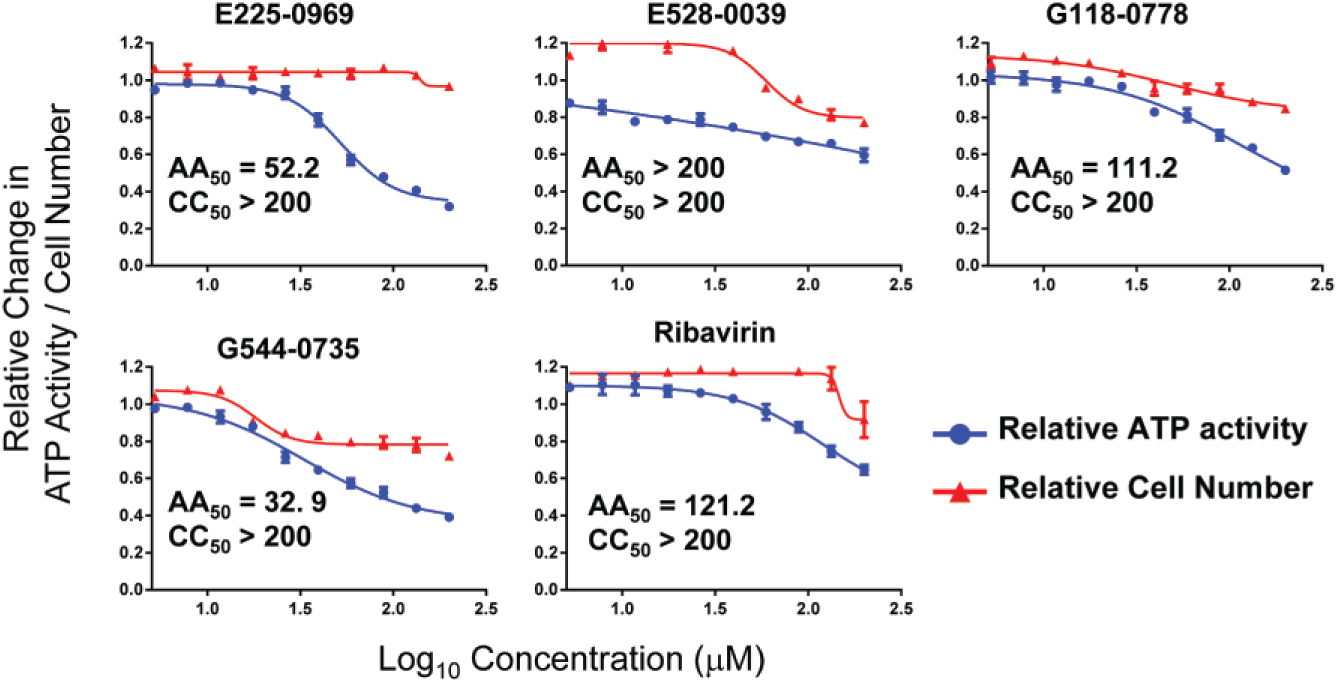
Concentration-response curve analysis for cell viability of the four hit compounds and ribavirin. The cell viability of HeLa cells upon treatment with increasing concentrations of the four hit compounds was determined both by monitoring cell number (red) and by measuring ATP levels (blue). Data were normalized to DMSO-treated cells, and the concentration of compound at which 50% of inhibition was achieved at maximum concentration was determined and designated AA50 and CC50 for ATP activity and cell number, respectively. AA50 and/or CC50 values of compounds showing <25% inhibition at their maximum concentration (200 µM) were listed as >200 µM.
Hit Compounds Target Viral Entry and/or Replication but Not Egress
The compound-induced changes in the kinetics of early and late viral gene expression during one life cycle of the virus was examined to shed light into the compounds’ effect on a specific stage of the virus life cycle. A single life cycle of RVFV, which includes virus entry, replication, and egress, spans approximately 10 to 12 h in HeLa cells. 15 The sequential expression of the early nucleocapsid (N protein), late glycoprotein (Gn), and cell surface–exposed Gn (referred to as S-Gn), which is indicative of virus egress, was determined at 6, 8, 10, or 12 h post–virus infection (PI) by IFA. The images were then subjected to HCI to determine the percentage of cells expressing N, Gn, or S-Gn at a given time point. As shown in Figure 4A , N protein expression was observed in a majority (~60%) of the infected cells by 6 h PI and reached the peak by 8 h. Gn and S-Gn expression was first apparent at 6 h and 8 h and peaked by 10 h and 12 h, respectively. Then, the kinetics of viral N, Gn, and S-Gn expression in the presence of compound was examined. The percentage of cells expressing N, Gn, or S-Gn upon compound treatment was normalized with mock-treated and infected cells, which was considered as 100% ( Fig. 4B ). Treatment with all compounds significantly reduced the expression of S-Gn by 60% to 100%, indicative of the reduction of infectious virus getting to the cell surface. However, treatment with E225-0969 and E528-0039 reduced expression of N and Gn by 50%, suggesting that these compounds exhibited their effects earlier in the virus life cycle. In contrast, treatment with G118-0778 and G544-0735 had only a minor effect (~10% reduction) on N expression ( Fig. 4B ).
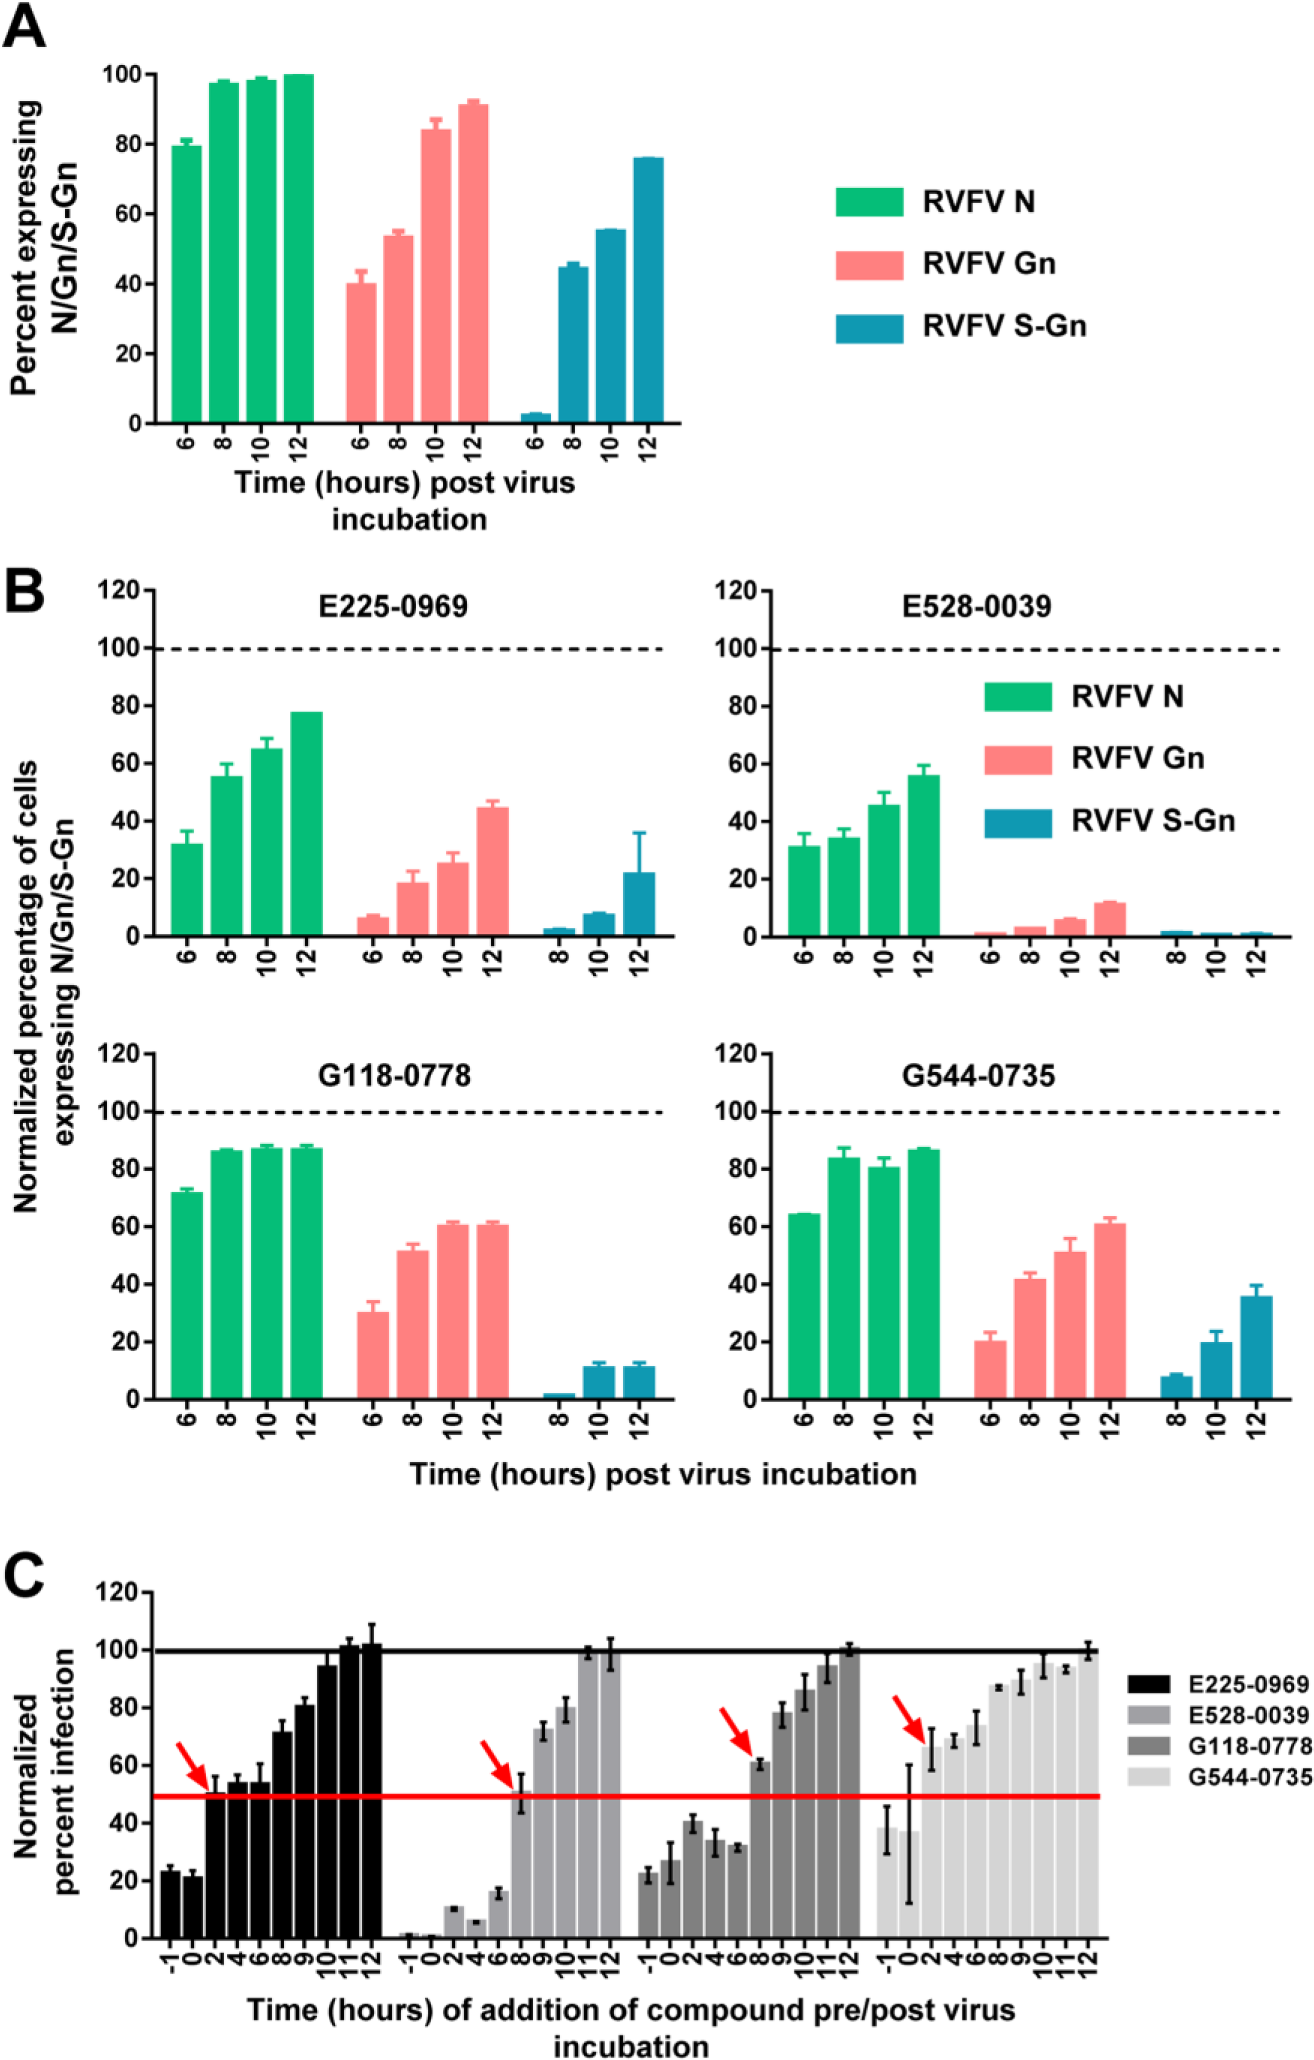
Hit compounds target virus replication and/or virus egress but not virus entry. (
To determine which stage of the virus life cycle the compounds had their maximal antiviral activity, compounds were added to HeLa cells at 1 h prior to infection (–1 h), at the time of infection (0 h), or at 2, 4, 6, 8, 9, 10, 11, or 12 h PI, and the percentage of infected cells was evaluated at 13 h PI using IFA for S-Gn expression, which is indicative of virus egress. More than 50% of infection was rescued when E225-0969 or G544-0735 was added at 2 h PI ( Fig. 4C , marked with red arrows), which indicated that compounds targeted viral entry because most of the virus entry (~80%) happens within 1 h of virus incubation with cells. In contrast, E528-0039 and G118-0778 targeted virus replication, because >50% rescue of infection occurred when compounds were added at 8 h PI, by which time maximal viral genome RNA replication and transcription is accomplished. 15 Collectively, these data suggested that the four hit compounds most likely target viral entry and/or replication but not virus egress.
Discussion
This study describes the development and application of HCS to identify novel compounds with broad-spectrum antiviral activity against several highly pathogenic RNA viruses. Previously, we and others have described HCS assays with RVFV 8 and EBOV and MARV17,18 to screen a few hundred molecules with known targets. In the present study, HCS was further developed and extended to test for novel compounds with broad-spectrum activity against multiple highly pathogenic RNA viruses. Although a robust HCI-based assay was developed for all of these viruses ( Table 1 ), primary screening efforts were limited to the vaccine strain (MP-12) of RVFV ( Fig. 1 ). This was primarily due to the increased time, effort, and costs involved with liquid handling while working with the other viruses under BSL-3/4 laboratory conditions. Vaccine strains of RVFV, VEEV, CHIKV, or JUNV could all serve the purpose, but RVFV MP12 was chosen mostly because of the availability of in-house–developed antibody reagents, which were of great value in subsequent studies to probe the compounds’ mode of action.
The 117 primary hit compounds were further analyzed by HCA (using the conditions described in Table 1 ) for their potential broad-spectrum antiviral activity against all the viruses studied ( Fig. 2A ). The majority (~88% with >40% infection inhibition) of the hits validated with MP12 and also inhibited the virulent strain of RVFV upon secondary screening. Some compounds were active against two or more viruses, albeit with different efficiencies. Surprisingly, none of the 117 primary hits were active against the filoviruses (EBOV and MARV). It is possible that filovirus infection is not regulated by the cellular process targeted by these compounds. Additional research in this area is warranted, as it may elucidate novel drug targets specific for this group of viruses.
From the secondary screen, 12 compounds were selected and retested against the same viruses ( Fig. 2B-C ) from which four compounds, E225-0969, E528-0039, G118-0778, and G544-0735, showing broad-spectrum activity, low cytotoxicity, and each representing a unique scaffold, were selected for further study. As described in Table 2 , the EC50, CC50, and SI (SI value = CC50/EC50) of these four compounds against RVFV, VEEV, CHIKV, JUNV, and LASV were determined and compared with ribavirin, a broad-spectrum antiviral agent with activity against multiple RNA and DNA viruses 19 (reviewed in De Clercq 20 ). As reported, ribavirin was not toxic in HeLa cells even at the maximum concentration tested (200 µM) and had varying degrees of antiviral activity against the viruses. 21 Ribavirin was most potent against the arenaviruses JUNV and LASV, with EC50 = 10.2 µM and 9.5 µM, respectively, whereas it had intermediary effects on VEEV, RVFV, and CHIKV with EC50 = 32.8 µM, 60.6 µM, and 81.3 µM, respectively. These results are consistent with those previously published for ribavirin.8,21–23
All four compounds were more effective than ribavirin with RVFV, VEEV, and CHIKV infections. E225-0969 was most effective (EC50 =4.7–8.9 µM) of all the compounds and more effective than ribavirin with all viruses. In addition, all four compounds, similar to ribavirin, showed a dose-dependent decrease in cell numbers, but cell viability was >80% at the highest concentration of the compound tested (i.e., 200 µM). The luciferase assay used for measuring ATP levels is a more sensitive assay for cell toxicity than measuring changes in cell numbers. However, decreases in ATP levels did not correspond to a decrease in cell numbers for all compounds. Therefore, it is possible that some compounds (e.g., E225-0969) regulate cellular process that influence ATP levels in the cell, although these changes were not toxic enough to alter cell growth properties and reduce cell numbers. Furthermore, HCI was applied to determine any gross changes in cell morphological features such as average size of the cell and nucleus; cytoskeletal organization; the number, area, and distribution of early, middle, and late endosomes; number and area of Golgi bodies per cell; and the distribution of endoplasmic reticulum and mitochondria using the methods described previously.15,17,18,24 No significant differences were noted either visually or by HCI-based analysis of any of these features (data not shown). Cell cycle analysis of compound-treated cells also did not show any significant changes in cell cycle profiles (data not shown). Taken together, these data suggest all four compounds are potential drug candidates and should be further evaluated.
Additional insights into the compounds’ mode of action were gained by using ToA studies. E225-0969 and G544-0735 appeared to target viral entry, whereas E528-0039 and G118-0778 appeared to target viral replication. Overall, our studies demonstrate the applicability of HCA analysis as an effective technology to identify novel compounds with potential broad-spectrum antiviral activities. These studies also laid the groundwork to extend our efforts from 96-well to 384-well plate format to apply automation to screen larger small-molecule libraries against these important, highly pathogenic RNA viruses.
Footnotes
Acknowledgements
We thank Xiaoli Chi, Katy Limpert, and Robert Besch for their technical assistance in screening.
Declaration of Conflicting Interests
The authors declared no potential conflicts of interest with respect to the research, authorship, and/or publication of this article.
Funding
The authors disclosed receipt of the following financial support for the research, authorship, and/or publication of this article: This study was supported by funding from the Defense Threat Reduction Agency (DTRA), Joint Science and Technology Office for Chem Bio Defense (JSTO-CBM.THRV.01.10.RD.19), to S.B. Research by R.M. was supported in part by an appointment to the Faculty Research Participation Program at the U.S. Army Research and Materiel Command administered by the Oak Ridge Institute for Science and Education through an interagency agreement between the U.S. Department of Energy and the U.S. Army Medical Research and Material Command. Opinions, interpretations, conclusions, and recommendations are those of the authors and are not necessarily endorsed by the U.S. Army or the U.S. government.