
Abstract
Formation of the phosphorylated protein γ-H2AX is a well-established marker of DNA strand breakage induced by DNA-damaging compounds. Many of these genotoxic compounds also inhibit cell division, leading to arrest at specific points in the cell cycle. Detection of γ-H2AX in combination with cell cycle arrest may therefore be useful for estimating the genotoxicity of experimental compounds. In this study, we examined γ-H2AX formation and cell cycle arrest using high-content screening (HCS) as a method for determining genotoxicity. HepG2 cells were treated with a panel of compounds and then stained with Hoechst 33342 and anti-γ-H2AX, anti-phospho-histone H3, and anti-tubulin antibodies. In total, 19 genotoxic and 7 nongenotoxic compounds were tested in this study. γ-H2AX production was observed within 1 h posttreatment for the majority of Ames-positive compounds, topoisomerase inhibitors, and DNA polymerase inhibitors. Cell cycle arrest in either the S or G2 phase was detected for all DNA-damaging compounds 24 h posttreatment, whereas tubulin-targeting compounds were shown to induce cell cycle arrest in the mitotic phase. Together, these results show that HCS is a simple, rapid, and effective tool for estimating the genotoxicity of compounds through detection of γ-H2AX production and cell cycle arrest.
Introduction
During drug development, compounds are routinely screened for genotoxicity as a means of predicting carcinogenicity in human cells. Any chemical exhibiting genotoxic effects in vitro requires additional in vitro studies to clarify the mechanisms of action. Further genotoxicity in vivo studies are also recommended to assess the risk of carcinogenicity in humans. 1
Several assays are routinely used to test genotoxicity in vitro, including the Ames assay, mouse lymphoma assay, micronucleus assay, and chromosome aberration assay. Although these current regulatory in vitro genotoxicity assays are low throughput and time-consuming, high-throughput assays based on new technologies have been developed recently. For instance, the In-Cell Western technique for detecting γ-H2AX was developed to screen genotoxicity with high sensitivity and specificity. 2 However, only genotoxic compounds that induce DNA strand breaks can be detected using this method.
To clarify the mechanisms of genotoxicity, kinetochore staining 3 and DNA adductome analysis 4 are used. Kinetochore staining is used to distinguish between structural aberrations of chromosomes and aneuploidy. DNA adductome analysis detects DNA adducts and reveals whether genotoxic effects are direct or indirect. However, as each assay is low throughput and comes with specific limitations, a combination of assays is necessary to determine the mechanisms of genotoxicity.
H2AX is one of the core histone proteins found in the nucleosome. The phosphorylated form of this protein, γ-H2AX, is produced as a result of DNA double-strand breaks. 5 As DNA-damaging compounds, including reactive oxygen species, DNA-interacting agents, and DNA topoisomerase inhibitors, have been shown to induce γ-H2AX formation, 6 the phosphorylation status of this protein has emerged as an important marker of genotoxicity.
In contrast to γ-H2AX, cell cycle arrest has been shown to be induced by a much wider range of factors, including radiation, exogenous DNA-damaging compounds, and anti-microtubule compounds. Radiation and DNA-damaging agents induce arrest in the S and G2 phases,7,8 whereas anti-microtubule agents induce cell cycle arrest in mitosis. 9 Detection of cell cycle status is therefore useful for determining the mechanism of genotoxicity.
In this study, we examined the use of γ-H2AX formation and cell cycle arrest in HepG2 cells for estimating genotoxicity and mechanisms of genotoxicity in the high-content screening (HCS) method. We were able to identify the mechanism of action of several known genotoxic compounds, including DNA-damaging agents and mitotic inhibitors. This method may therefore offer a reliable, high-throughput approach for assessing the genotoxicity and estimating the mechanisms of genotoxicity of experimental compounds.
We used HepG2 cells in this study. Routinely used in vitro genotoxicity studies are highly sensitive but occasionally give false-positives. One reason that these assays give false-positives is that the cells used lack functional p53. Therefore, we used HepG2 cells with functional p53 to obtain accurate results.
Materials and Methods
Chemicals and Reagents
Actinomycin D, aphidicolin, colcemide, cycloheximide, erythromycin etoposide, famotidine, kanamycin sulfate, lidocaine, ouabain octahydrate, and saccharin sodium salt hydrate were purchased from Sigma-Aldrich (St. Louis, MO). Caffeine, camptothecin, cytarabine, hydralazine hydrochloride, hydroxyurea, menadione, methylnitronitrosoguanidine (MNNG), paclitaxel, and sodium chloride were purchased from Wako Pure Chemical Industries, Ltd. (Osaka, Japan). Naloxone hydrochloride was purchased from Enzo Life Sciences (Farmingdale, NY). Alpha-methyl-L-dopa was purchased from TCI (Tokyo, Japan). Lovastatin was purchased from Tocris Bioscience (Bristol, UK). Ethylenediaminetetraacetate (EDTA) was purchased from Dojindo Laboratories (Kumamoto, Japan). Ofloxacin was purchased from LKT Laboratories (St. Paul, MN). Paroxetine maleate salt was purchased from Mitsubishi Tanabe Pharma (Osaka, Japan).
Minimum essential medium (MEM), fetal bovine serum, nonessential amino acid solution, 1 mmol/L sodium pyruvate, penicillin-streptomycin, 0.25% trypsin-1 mmol/L EDTA, and Hank’s balanced salt solution (HBSS) were purchased from Life Technologies (Camarillo, CA). The CellCiphr Panel 1 kit was purchased from Cellumen Inc. (now Cyprotex Inc., Watertown, MA). CellCiphr Panel 1 was a kit developed for estimation of hepatotoxicity using the HCS system. A hepatotoxicity assay was purchased from EMD Millipore (Billerica, MA). CellCiphr Panel 1 and the Millipore hepatotoxicity assay are the same product.
Cell Preparation and Culture
HepG2 cells, a human hepatocellular carcinoma cell line, were purchased from the American Tissue Culture Collection (ATCC, Manassas, VA) and cultured in standard MEM supplemented with 10% fetal bovine serum, nonessential amino acid solution, sodium pyruvate, and penicillin-streptomycin. Cells were maintained at 37 °C in a humidified 5% CO2 incubator. HepG2 cells were trypsinized using 0.25% trypsin-1 mmol/L EDTA and seeded at a density of either 4200 or 2400 cells/well (25 µL/well) for 1- and 24-h treatment assays, respectively, in rat collagen–coated 384-well microplates. Cells were incubated for 24 h prior to treatment.
All chemical compounds were suspended in either DMSO or pure water, as appropriate, to give a 100× final, maximum concentration stock solution, and doubling dilution series were made for each compound. Immediately before use, the stock solutions were diluted with culture medium and added to each well (25 µL/well) at the indicated final concentrations. Camptothecin and anisomycin were used as positive controls of plate 1. Paclitaxel and carbonyl cyanide 3-chlorophenylhydrazone were used as positive controls of plate 2. Two wells were used per compound/concentration, and 20 wells were used for a vehicle control. Sixteen compounds/10 concentrations were thus used simultaneously.
Fixation and Staining
This was performed as described by the manufacturer. Briefly, following treatment, 50 µL of 400 nmol/L MitoTracker Red diluted in culture medium was added to plate 2 and incubated for 30 min. Both plates were then treated with 3.6% formaldehyde in HBSS containing 1 µg/mL Hoechst 33342 and incubated for 30 min at room temperature. Cells were then washed with HBSS, permeabilized by treatment with 20 µL/well of 0.5% (v/v) Triton X-100 in HBSS for 5 min at room temperature, and washed again with HBSS.
Following permeabilization, a primary antibody cocktail was added to each plate and incubated for 1 h at room temperature. Cells were then washed with HBSS, treated for 1 h with secondary antibody cocktail, and washed again in HBSS. The primary antibody cocktail for plate 1 contained 1 µg/mL Hoechst 33342 and anti-phospho-histone H2AX, anti-phospho-c-Jun, and anti-p53 antibodies. The primary antibody cocktail for plate 2 contained Hoechst 33342 and anti-phospho-histone H3 and anti-β-tubulin antibodies. The secondary antibody cocktail for plate 1 contained FITC-anti-mouse IgG, Cy3-anti-rabbit IgG, and Cy5-anti-sheep IgG. The secondary antibody cocktail for plate 2 contained FITC-anti-rabbit IgG and Cy5-anti-mouse-IgG.
All antibodies were included in a kit at 200× final concentrations. Immediately before use, the antibodies were diluted 200-fold in HBSS to generate the antibody cocktails. Because this kit was intended for detection of hepatotoxicity, MitoTracker Red, anti-phospho-c-Jun, and anti-p53 antibodies were also included. Although we visualized MitoTracker Red, c-Jun, and p53 simultaneously using an ArrayScan VTI HSC reader (Thermo Fisher Scientific Inc., Waltham, MA), these parameters were not used for analysis of γ-H2AX or the cell cycle.
Automated Fluorescence Imaging
Cells were visualized using an ArrayScan VTI HSC reader (Thermo Fisher Scientific Inc.). X93 filter sets were used. An X93-Hoechst filter was used to detect Hoechst 33342, an X93-FITC filter was used to detect anti-γ-H2AX and anti-phospho-histone H3 antibodies, and an X93-Cy5 filter was used to detect anti-tubulin antibody. A 10× objective lens was used to assess the cell cycle (Hoechst 33342), and a 20× high NA objective lens was used to visualize anti-γ-H2AX, anti-phospho-histone H3, and anti-tubulin staining. HCS data were analyzed using the Cellomics algorithms “cell cycle” and “compartmental analysis.” “Cell cycle” is an algorithm for separating 2N from 4N cells based on the fluorescence intensity of Hoechst 33342 and calculation of the 2N/4N ratio. The nuclear area was determined by calculating the Hoechst 33342–stained area. Compartmental analysis is an algorithm for calculating the fluorescence intensity of an antibody in the nucleus or cytoplasm. Typically, we acquired six images per well. γ-H2AX, phospho-histone H3, and tubulin were presented as the average fluorescence intensities of the nuclear area. Cell cycle was presented as the 2N/4N ratio.
Data Analysis
The informatics system used for data analysis was originally developed by Mathematical Systems Inc. (Tokyo, Japan). This system can plot graphs, calculate the minimum effective concentration (MEC), and generate heat maps automatically. A kernel-smoothing method was used for calculating the MEC, defined as the lowest concentration detectable above that of the vehicle control (mean ± two standard deviations of 20 vehicle wells). MECs were not calculated for wells with >70% dead cells. The acceptance criterion for the assay was a coefficient of variation of each parameter in vehicle controls of less than 20%.
Sensitivity of γ-H2AX was defined as the number of γ-H2AX–positive compounds divided by the number of genotoxic compounds that induced DNA strand breaks ( Table 1 ). Specificity of γ-H2AX was defined as the number of γ-H2AX–negative compounds divided by the number of compounds that did not induce DNA strand breaks ( Table 1 ).
Test Compounds and Summary of the Results of In Vitro Genotoxicity Assays.
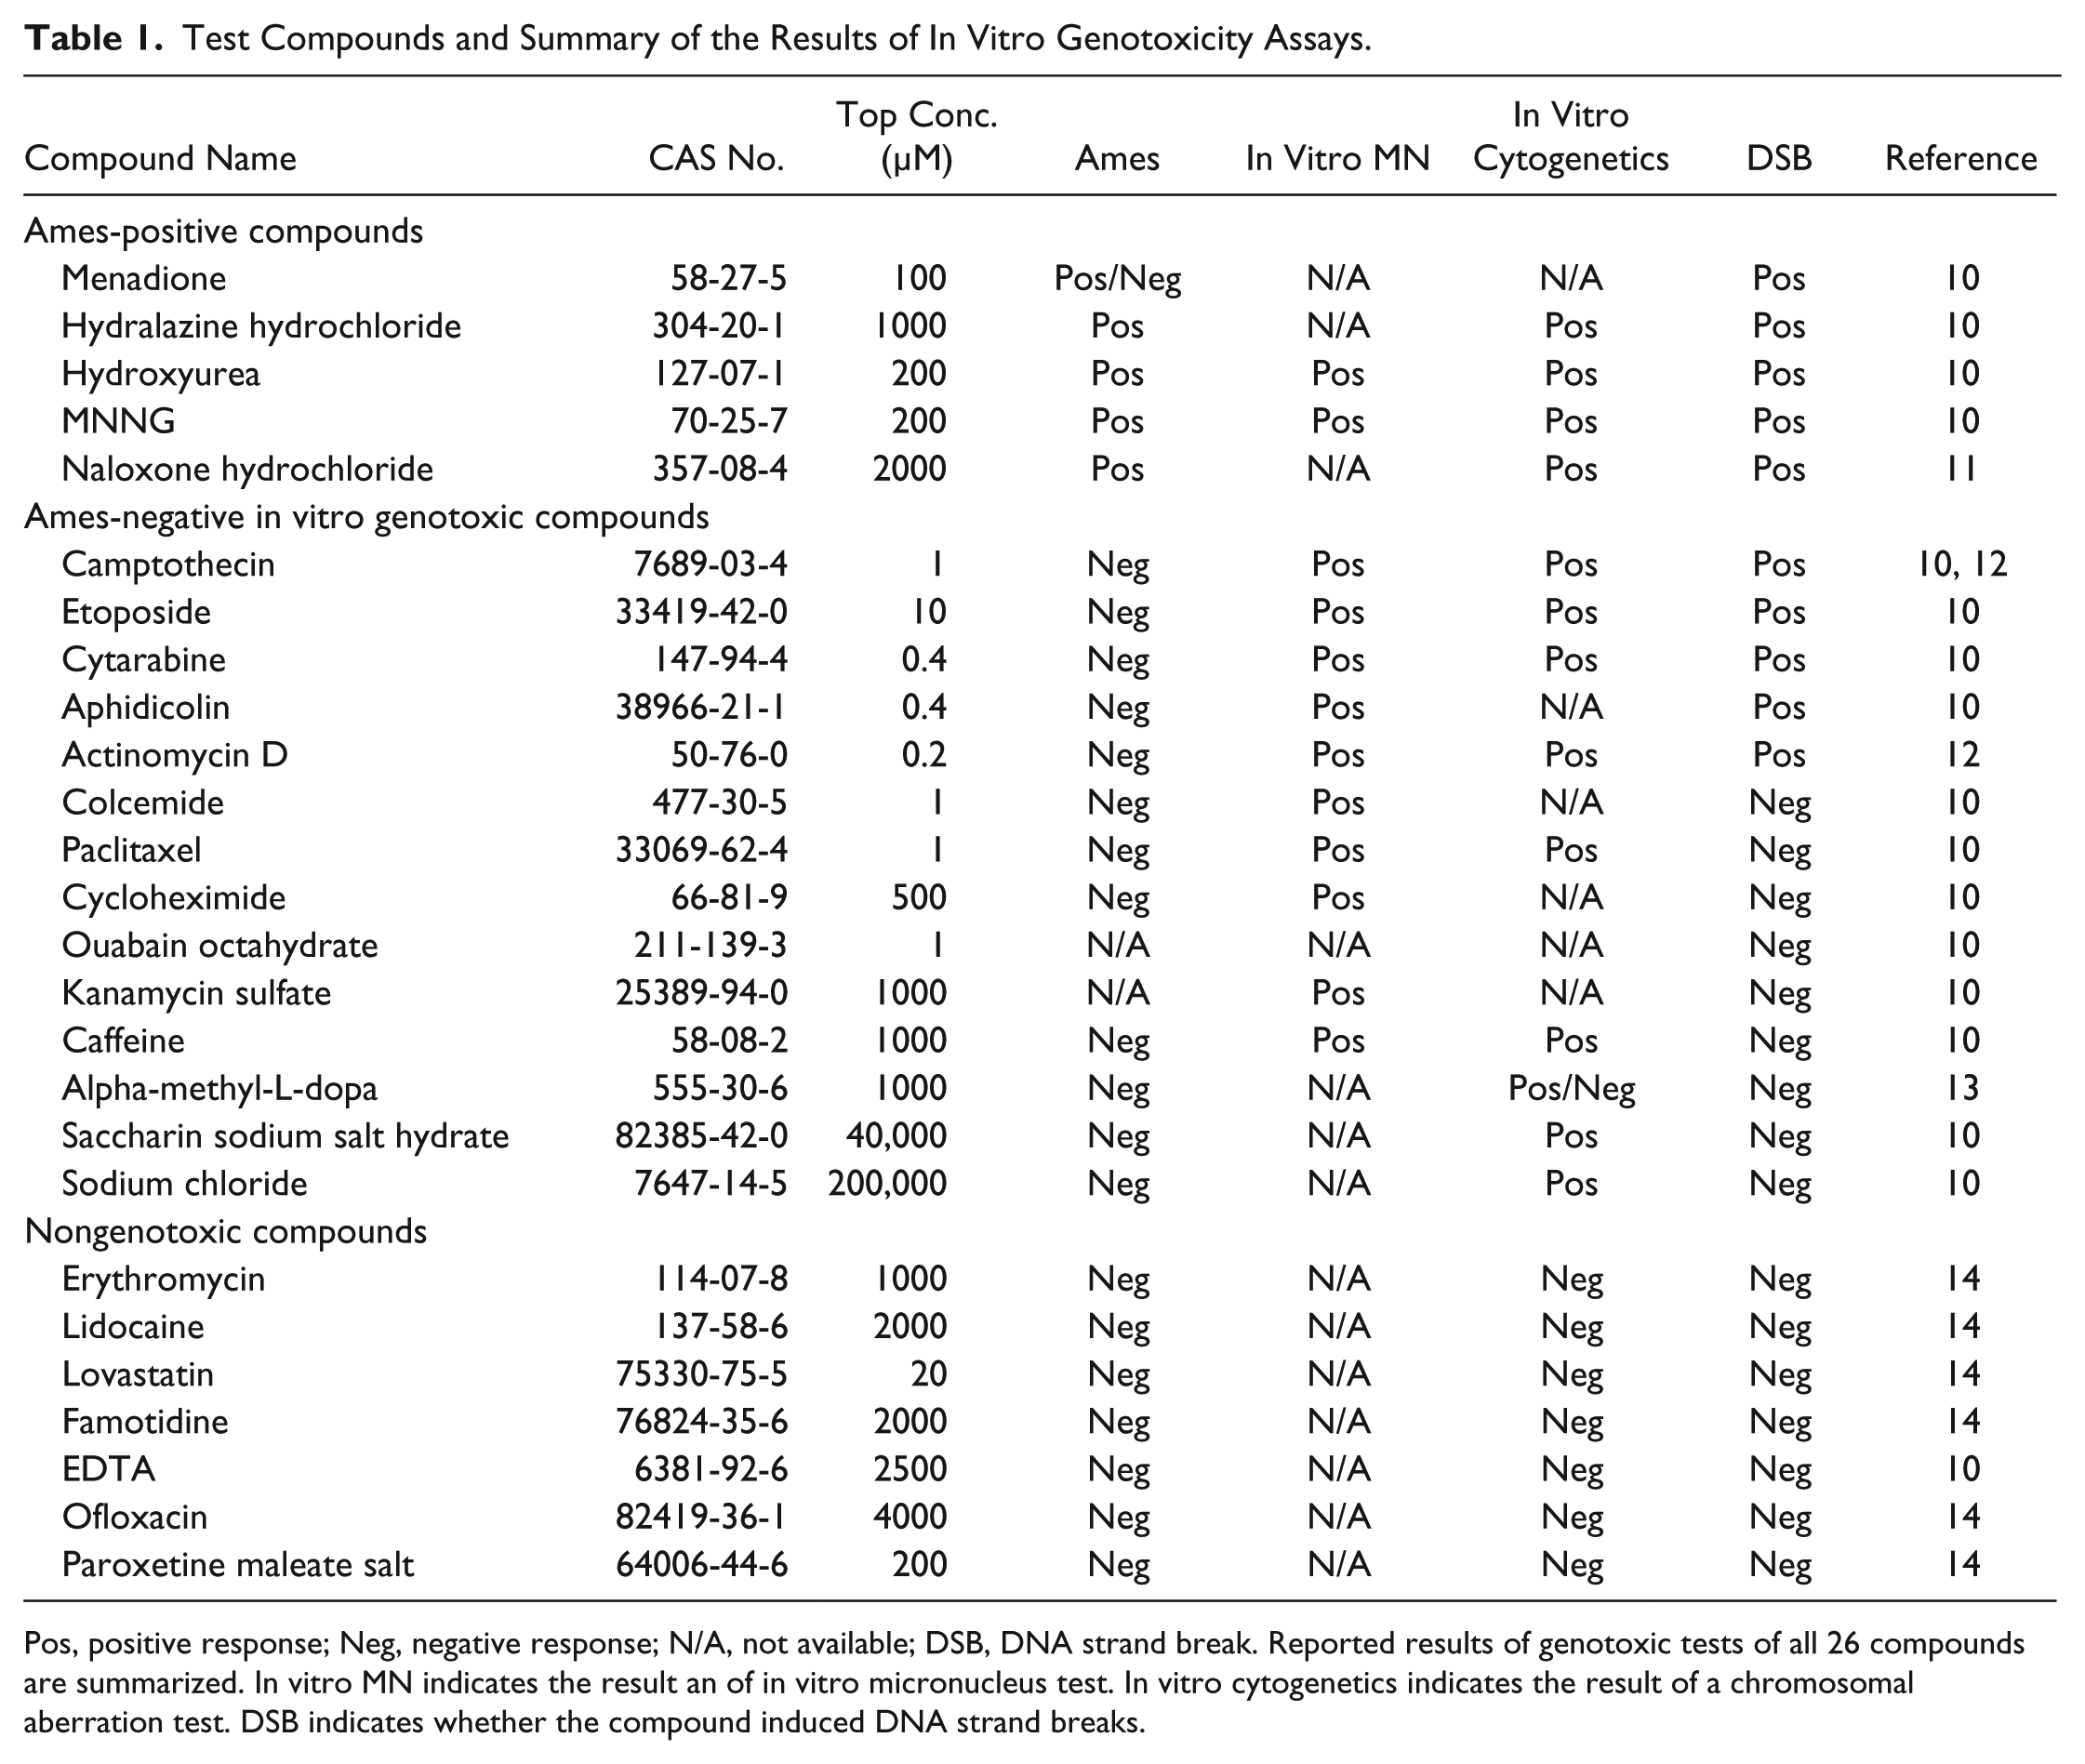
Pos, positive response; Neg, negative response; N/A, not available; DSB, DNA strand break. Reported results of genotoxic tests of all 26 compounds are summarized. In vitro MN indicates the result an of in vitro micronucleus test. In vitro cytogenetics indicates the result of a chromosomal aberration test. DSB indicates whether the compound induced DNA strand breaks.
The Z′ factor values for γ-H2AX, cell cycle, phospho-histone H3, and tubulin were ~0.7 (positive control: camptothecin), ~0.5 (positive control: paclitaxel), ~0.6 (positive control: paclitaxel), and ~0.3 (positive control: paclitaxel), respectively.
Results and Discussion
γ-H2AX Detection
To evaluate the usefulness of γ-H2AX as a marker for DNA damage, HepG2 cells were treated with 1 µmol/L camptothecin for 1 h ( Fig. 1D , F ). The nuclear regions of cells treated with camptothecin ( Fig. 1E ), compared with DMSO controls ( Fig. 1B ), exhibited more intense staining following anti-γ-H2AX antibody incubation. The average nuclear fluorescence intensities of anti-γ-H2AX were calculated for each concentration and plotted on a graph ( Fig. 1G ). A concentration-dependent increase in γ-H2AX formation was observed in cells treated with camptothecin.
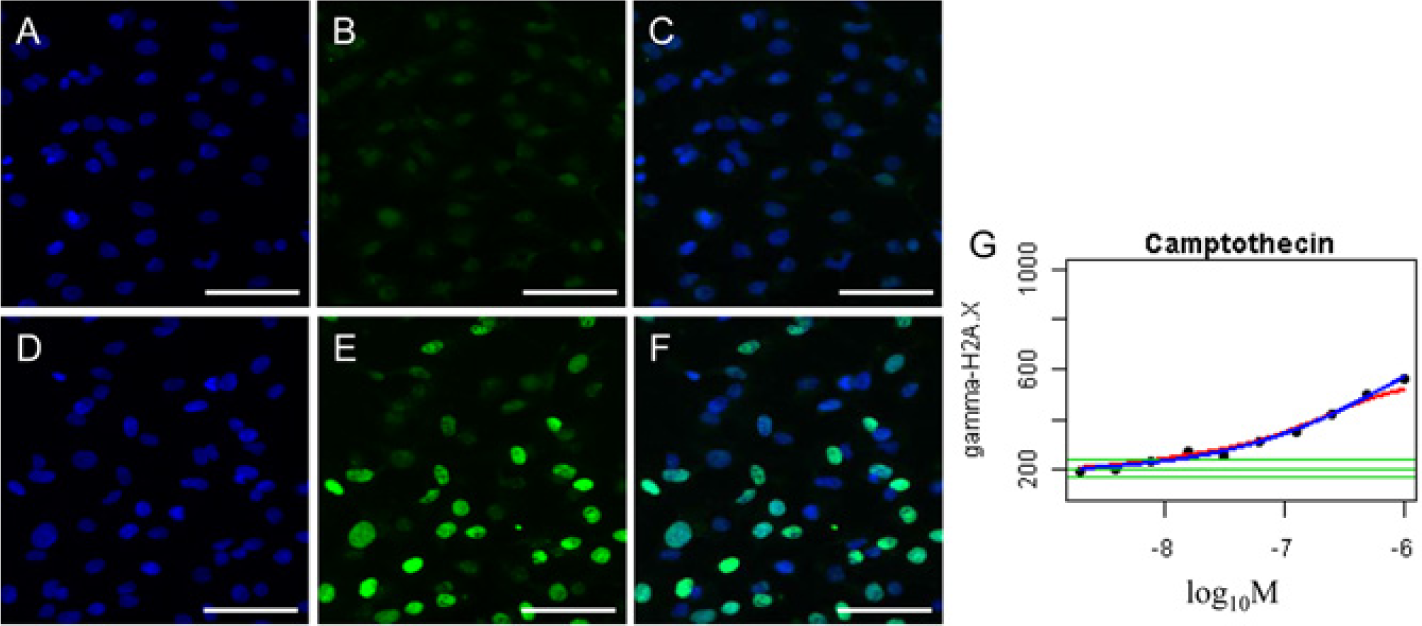
Representative images and graphs for high-content screening (HCS) detection of γ-H2AX. HepG2 cells exposed to 1 µmol/L camptothecin (
One-Hour Treatment Is Sufficient for Detecting DNA-Damaging Agents
A total of 19 genotoxic compounds previously reported to induce genotoxicity in vitro and 7 control compounds were tested using the γ-H2AX assay ( Table 1 ).10–14 Ames-positive compounds, topoisomerase inhibitors (camptothecin, etoposide), cytarabine, aphidicolin, and actinomycin D are all known to induce DNA double-strand breaks and γ-H2AX production.15–19 Other compounds, even though genotoxic in vitro, are not known to induce double-strand breaks and therefore should not induce γ-H2AX production.
Menadione, hydralazine hydrochloride, hydroxyurea, MNNG, camptothecin, etoposide, cytarabine, aphidicolin, cycloheximide, and methyldopa all induced γ-H2AX at 1 h, whereas other genotoxic compounds, such as naloxone and actinomycin D, had no effect on γ-H2AX ( Fig. 2A ). Therefore, the sensitivity of the assay at 1 h is 80% (8/10) and the specificity is 87.5% (14/16).
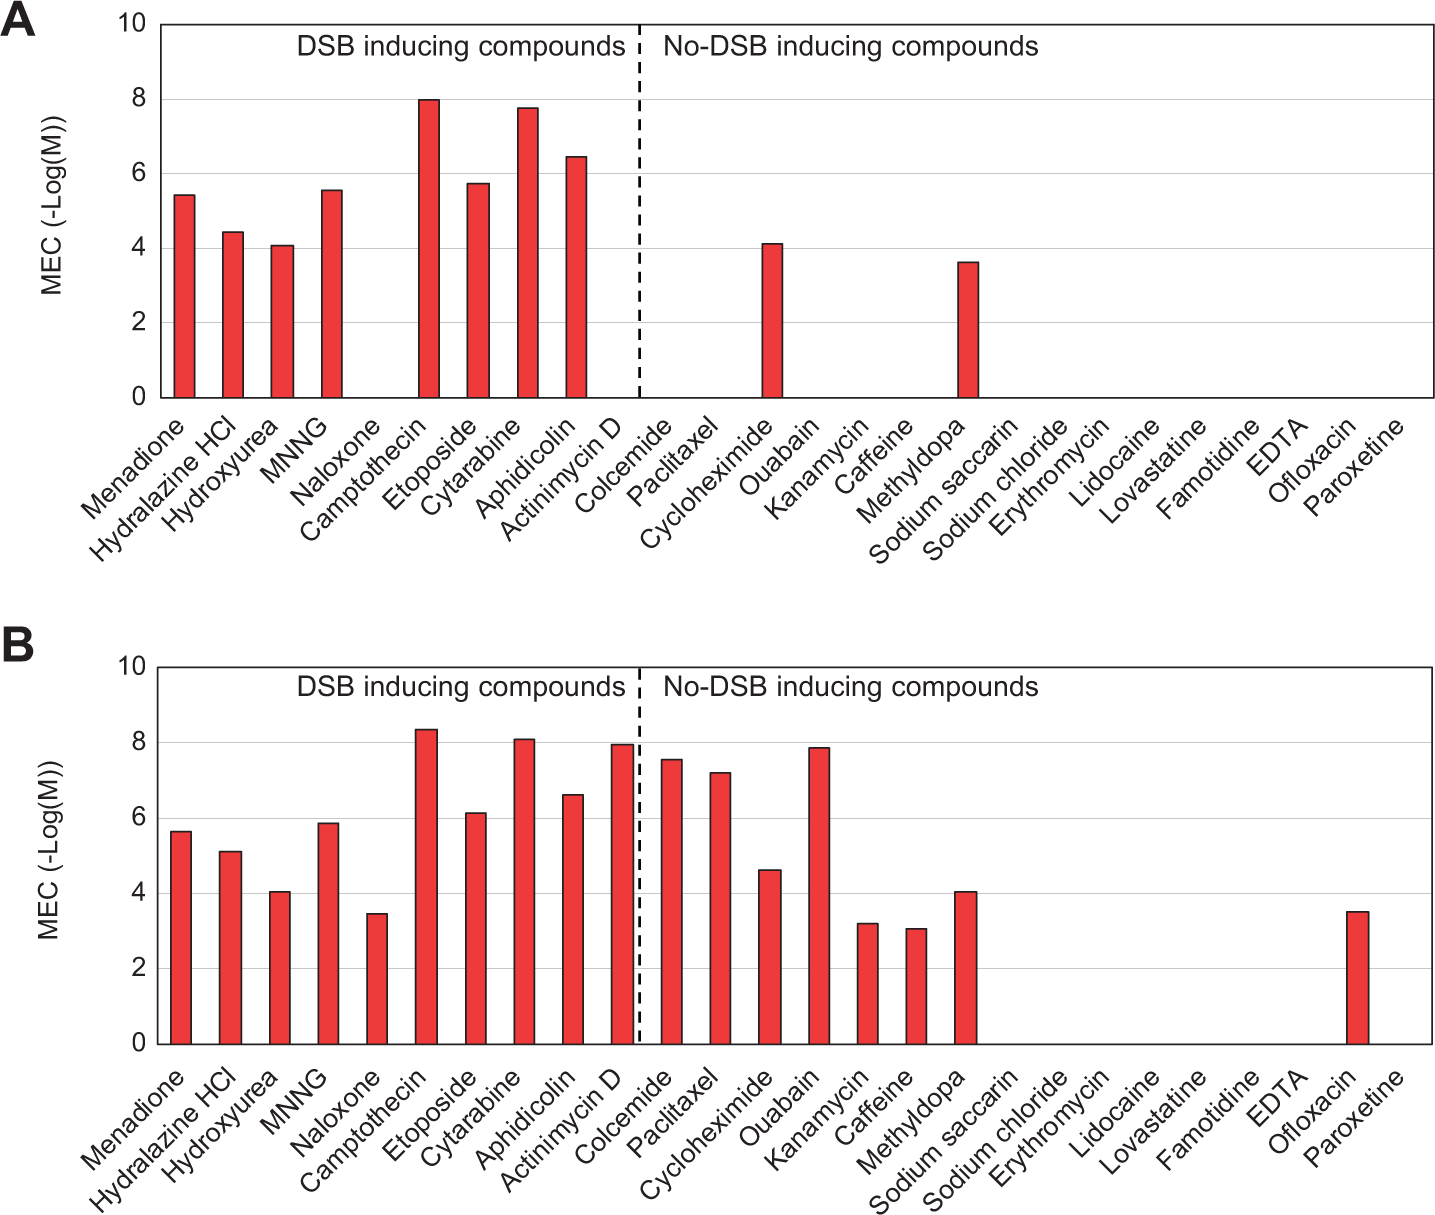
Minimum effective concentrations (MEC) of test compounds. HepG2 cells were exposed to the compounds for 1 h (
By 24 h, 18 compounds, comprising 17 genotoxic and 1 nongenotoxic compound (ofloxacin), induced γ-H2AX production ( Fig. 2B ), and this was the case even for several genotoxic compounds, such as colcemide, which do not induce DNA damage. The sensitivity of the assay at 24 h is therefore 100% (10/10); however, the specificity is only 50% (8/16). The high false-positive rate at this time point is likely due to increased apoptosis, because DNA degradation as a consequence of apoptosis is known to induce γ-H2AX. 20 From these results, we conclude that 1-h treatment is more appropriate for detecting DNA-damaging compounds with high sensitivity and specificity.
Detection of Cell Cycle Responses to Determine the Mechanisms of Genotoxicity
Next, we used HCS to detect cell cycle arrest. Genotoxic agents such as DNA-damaging and tubulin-targeting compounds induce cell cycle arrest through discrete mechanisms. Because DNA-damaging compounds inhibit DNA replication, they generally induce cell cycle arrest in either the S or G2 phase. Alternatively, tubulin-targeting compounds inhibit mitosis, leading to cell cycle arrest in the mitotic phase. Detection of the cell cycle phase is therefore a useful method for predicting the mechanism of action of genotoxic compounds.
Table 2 shows summarized results for the γ-H2AX and cell cycle assays. Cells were treated with each of the test compounds for 24 h prior to staining. The HCS system is able to differentiate between cell cycle arrest in the G1, S, or G2 phase from mitotic arrest. To distinguish cell cycle arrest in the G1 phase from S, G2, or mitosis, we used Hoechst 33342 to calculate the 2N/4N ratio. Because histone H3 was phosphorylated in the nucleus in the mitotic phase, we calculated the nuclear intensity of anti-phospho-histone H3 antibody staining to distinguish cell cycle arrest in the S or G2 phase from mitotic arrest. When the 2N/4N ratio increased, it was judged as cell cycle arrest in the G1 phase. When the 2N/4N ratio decreased and anti-phospho-histone H3 staining did not change or decreased, it was judged as cell cycle arrest in the S or G2 phase. When the 2N/4N ratio decreased and anti-phospho-histone H3 staining increased, it was judged as cell cycle arrest in the mitotic phase. We also used an anti-tubulin antibody to detect the nuclear area of tubulin and attempted to detect spindle body aberration to distinguish cell cycle arrest in the S or G2 phase arrest from mitotic arrest. However, anti-tubulin antibody staining was nonspecific, and we concluded that the anti-tubulin antibody was unsuitable for detection of cell cycle arrest.
Detection of Cell Cycle Responses to Determine the Mechanisms of Genotoxicity.
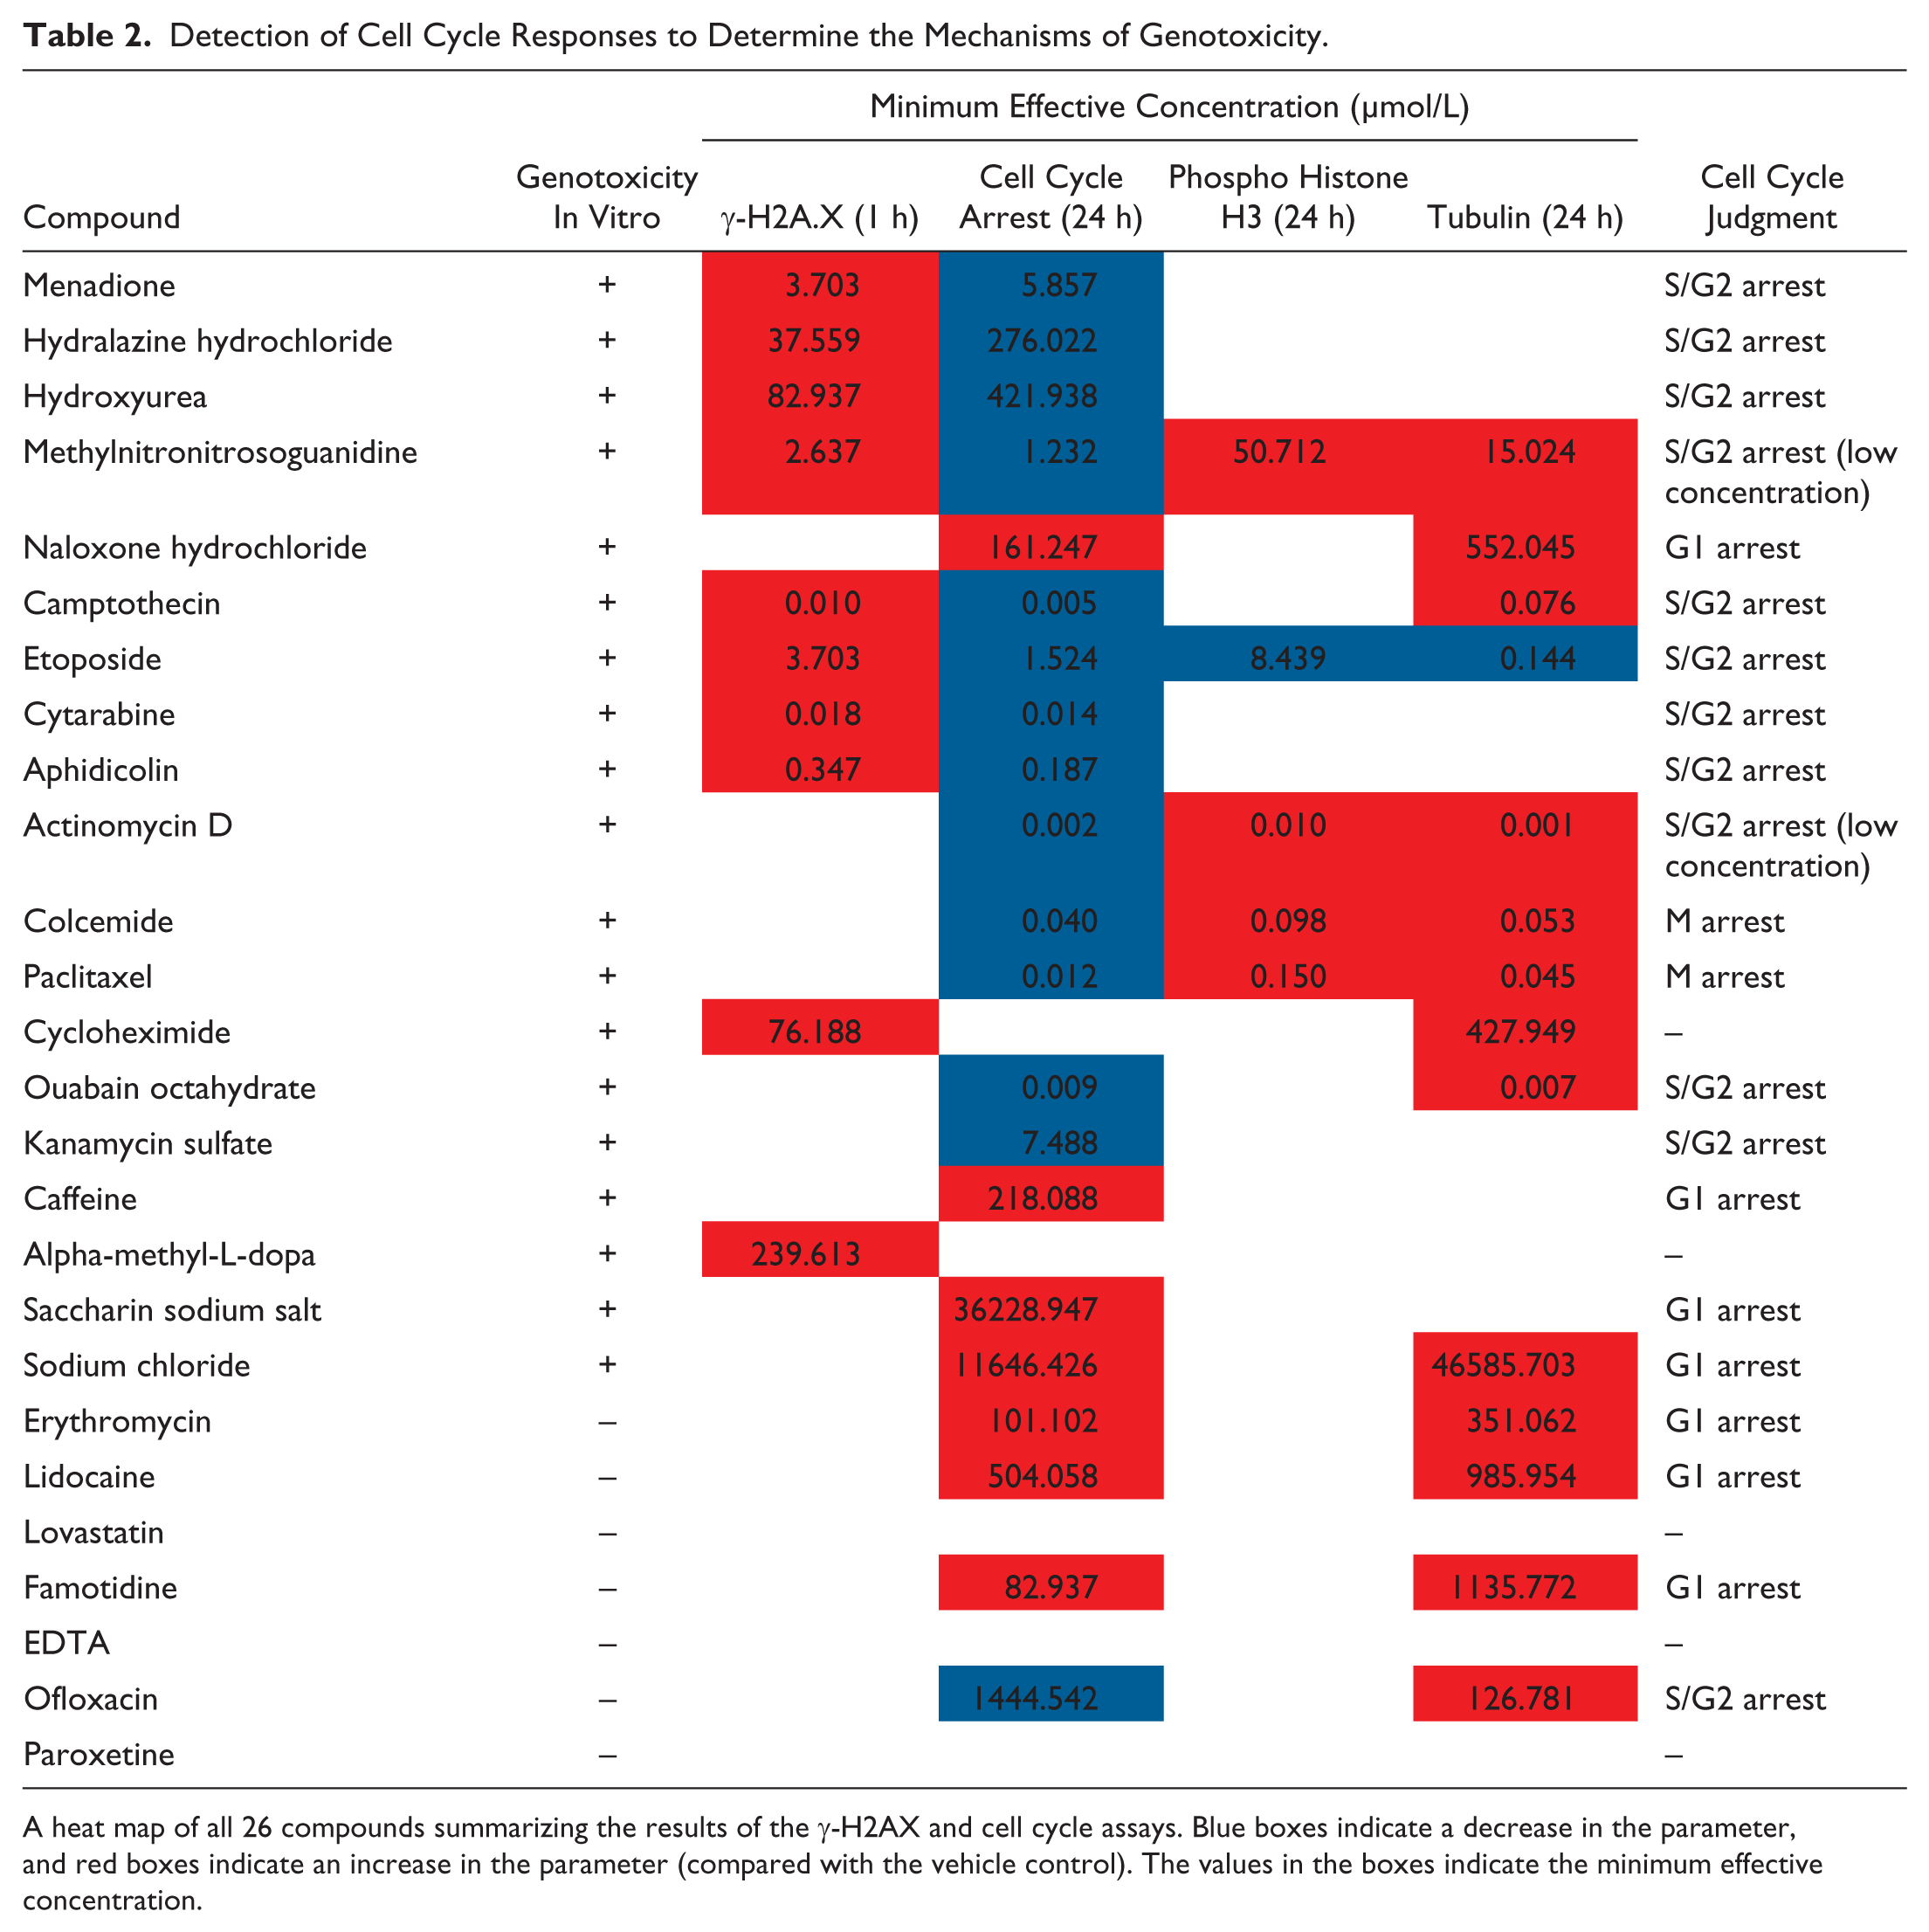
A heat map of all 26 compounds summarizing the results of the γ-H2AX and cell cycle assays. Blue boxes indicate a decrease in the parameter, and red boxes indicate an increase in the parameter (compared with the vehicle control). The values in the boxes indicate the minimum effective concentration.
Representative images of cells exposed to colcemide or cytarabine are shown in
Figure 3
. The 2N/4N ratio of cells exposed to both compounds decreased at high concentrations (
Fig. 3I
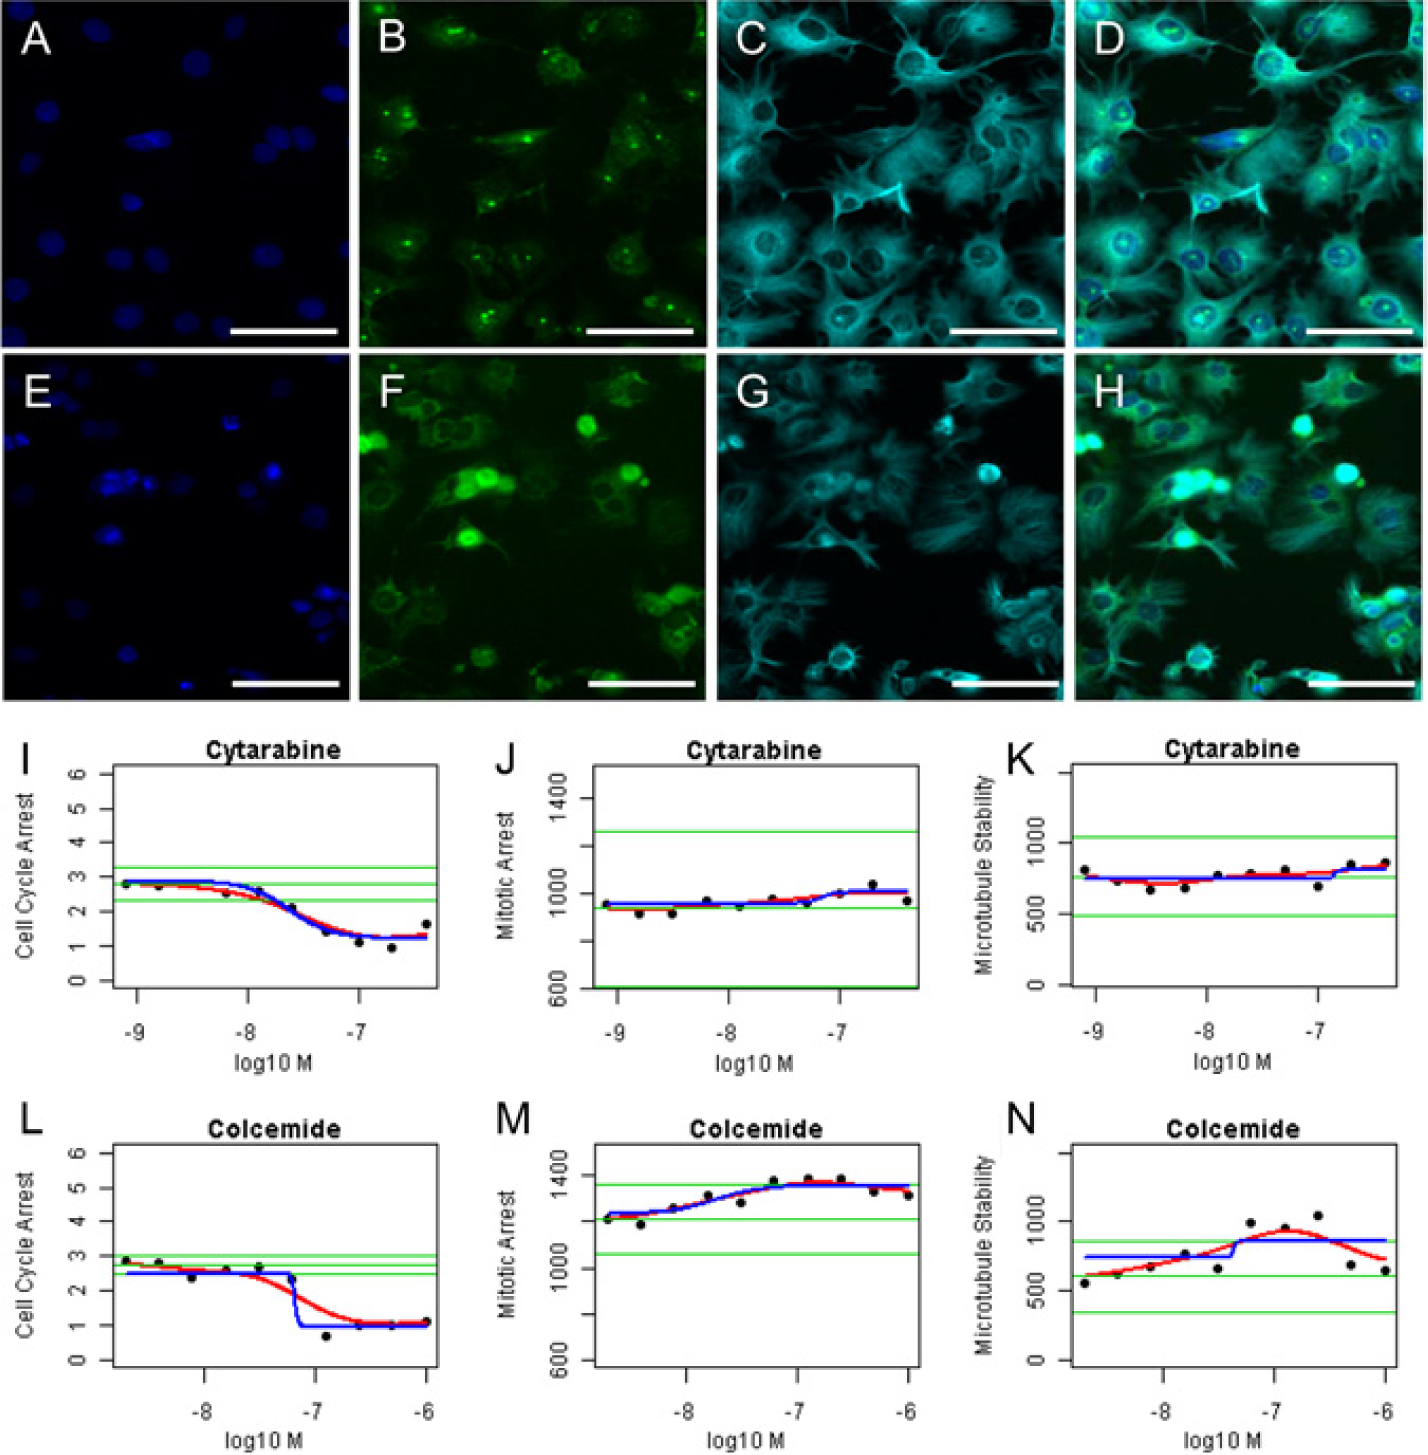
Representative images and graphs of high-content screening (HCS) for cell cycle arrest induced by each of the test compounds. HepG2 cells exposed to cytarabine at 0.1 µmol/L (
With the exception of naloxone, all Ames-positive compounds induced cell cycle arrest in the S and G2 phases, consistent with known mechanisms of action of these compounds.23–26 As naloxone treatment did not induce γ-H2AX production at 1 h and also failed to induce cell cycle arrest in the S and G2 phases at 24 h, it is thought that this compound likely induces genotoxicity through mechanisms different than those of other Ames-positive compounds.
For the Ames-negative compounds, camptothecin, etoposide, cytarabine, aphidicolin, actinomycin D, ouabain octahydrate, and kanamycin sulfate all induced arrest in the S and G2 phases. Colcemide and paclitaxel induced arrest in the mitotic phase, whereas caffeine, sodium saccharin, and sodium chloride induced arrest in the G1 phase. Cycloheximide and alpha methyl-L-dopa treatments did not affect the cell cycle status.
Camptothecin, a well-known topoisomerase I inhibitor, and etoposide, a topoisomerase II inhibitor, are known to induce arrest in the S and G2 phases,27,28 consistent with the results described here. Both cytrabine and aphidicolin induce arrest in the S phase, albeit through different mechanisms of action. Cytarabine acts as a cytosine analog and interferes with DNA synthesis, 29 whereas aphidicolin inhibits DNA polymerase alpha, leading to cell cycle arrest. 30 Actinomycin D binds to DNA and inhibits transcription and replication, leading to arrest in G2. 31 Ouabain, an inhibitor of Na+/K+-ATPase, does not damage DNA directly, but it also induced arrest in the S and G2 phases at 24 h. 32 Despite these divergent mechanisms of action, our method was able to accurately identify the phase of the cell cycle at which each of these compounds induced arrest.
Kanamycin is not known to induce arrest in the S and G2 phases. As it is unlikely that an aminoglycoside bactericidal antibiotic such as kanamycin causes DNA damage, the mechanism of action associated with cell cycle arrest remains to be determined.
Colcemide binds to tubulin dimers and inhibits tubulin polymerization and formation of mitotic spindle bodies, leading to accumulation in a prometaphase-like state, 33 consistent with the arrest in the mitotic phase observed in our experiment. Paclitaxel is known to block cells in the G2/M phase of the cell cycle via direct binding to tubulin structures. 34 Our results indicate preferential arrest in the mitotic phase; based on the known mechanism of action of this compound, we suggest that the HCS method identifies G2/M transitional cells preferentially in the mitotic phase.
Caffeine suppresses cell cycle progression at the G0/G1 phase of growth. Cell cycle arrest in the G1 phase is also induced via the action of osmotic stress agents, such as saccharin sodium salt and sodium chloride, 35 consistent with the results described here.
Among the non-genotoxic compounds, erythromycin, lidocaine, and famotidine induced G1 phase arrest, whereas only ofloxacin induced S and G2 phase arrest. Lovastatin and paroxetine maleate salt did not affect the cell cycle status. Cell cycle arrest in the G1 phase is induced when cells detect a situation that is unsuitable for proceeding to replication. Therefore, erythromycin, lidocaine, and famotidine must affect cells in some manner. However, the mechanisms by which erythromycin, lidocaine, and famotidine induce arrest in the G1 phase are unclear. As ofloxacin is a bacterial DNA gyrase inhibitor, the high concentrations of ofloxacin used in this experiment may have inhibited human topoisomerase II, thereby inducing arrest in the S and G2 phases.
In conclusion, our study successfully distinguished compounds that induce DNA strand breaks directly from those causing DNA strand breaks as a consequence of apoptosis, through the detection of γ-H2AX 1 h posttreatment, allowing for rapid assessment of genotoxicity. Moreover, our method was able to distinguish between compounds causing cell cycle arrest in the S and G2 phases from those causing arrest in the mitotic phase, providing insight into the potential mechanisms of genotoxicity. Using this method for primary screening, genotoxicity can be estimated more rapidly compared with time-consuming standard in vitro genotoxicity assays. In addition, we can simultaneously determine whether compounds attack DNA or mitosis. The results facilitate investigation of the mechanisms of genotoxicity and identification of compounds that should be the first to proceed to the next genotoxicity assay.
Footnotes
Declaration of Conflicting Interests
The authors declared no potential conflicts of interest with respect to the research, authorship, and/or publication of this article.
Funding
The authors disclosed receipt of the following financial support for the research, authorship, and/or publication of this article: The study was supported by Mitsubishi Tanabe Pharma Corporation and by intramural research grants (23-5) for Neurological and Psychiatric Disorders of NCNP and for Comprehensive Research on Disability Health and Welfare awarded to S.I. by the Ministry of Health, Labor and Welfare, Japan.