
Abstract
A novel, ultrahigh-throughput, fluorescence anisotropy–based assay was developed and used to screen a 1.4-million-sample library for compounds that compete with adenosine triphosphate (ATP) for binding to Escherichia coli tRNAIle lysidine synthetase (TilS), an essential, conserved, ATP-dependent, tRNA-modifying enzyme of bacterial pathogens. TilS modifies a cytidine base in the anticodon loop of Ile2 tRNA by attaching lysine, thereby altering codon recognition of the CAU anticodon from AUG (methionine) to AUA (isoleucine). A scintillation proximity assay for the incorporation of lysine into Ile2 tRNA was used to eliminate false positives in the initial screen resulting from detection artifacts as well as compounds competitive with the fluorescent label instead of ATP, and to measure inhibitor potencies against E. coli and Pseudomonas aeruginosa TilS isozymes. The tRNAIle substrate for P. aeruginosa TilS was identified for the first time to enable these measurements. ATP-competitive binding of inhibitors was confirmed by one-dimensional ligand-observe nuclear magnetic resonance. A preliminary structure–activity relationship is shown for two inhibitor series.
Introduction
When translating mRNA, almost all eubacteria decode the AUA codon for isoleucine (Ile) using an Ile tRNA with a chemically modified CAU anticodon containing lysidine as the wobble base. Lysidine consists of cytidine (C) attached to lysine, allowing the modified base to pair with the adenine (A) base of the AUA codon of mRNA instead of guanine (G). This posttranscriptional modification of the tRNA is catalyzed by the adenosine triphosphate (ATP)-dependent enzyme tRNAIle lysidine synthetase (TilS).1–3 In the absence of TilS activity, tRNAIle(CAU) is charged with methionine (Met) by Met tRNA synthetase and inserts Met at AUG codons. Without a tRNA available for translation of AUA codons with Ile, cell growth is prevented. Thus, TilS is an essential enzyme, consistent with the results of gene essentiality screens.4–6
The essentiality of TilS, its high degree of conservation among pathogenic bacteria, and its absence from human nuclear and mitochondrial genomes make the enzyme an attractive target for the discovery of novel antibacterial drugs. The only potentially druglike ligands of TilS that have been reported to date are lysine analogs that are alternative substrates for TilS and result in Ile tRNAs that are alternate substrates for Ile tRNA synthetase. 7 The X-ray crystal structure of Aquifex aeolicus TilS with ATP bound (see ref. 8 ; based on PDB 2E89) shows that the nucleotide is buried in a deep pocket that could be a suitable binding site for potential ATP-competitive inhibitors ( Fig. 1 ).
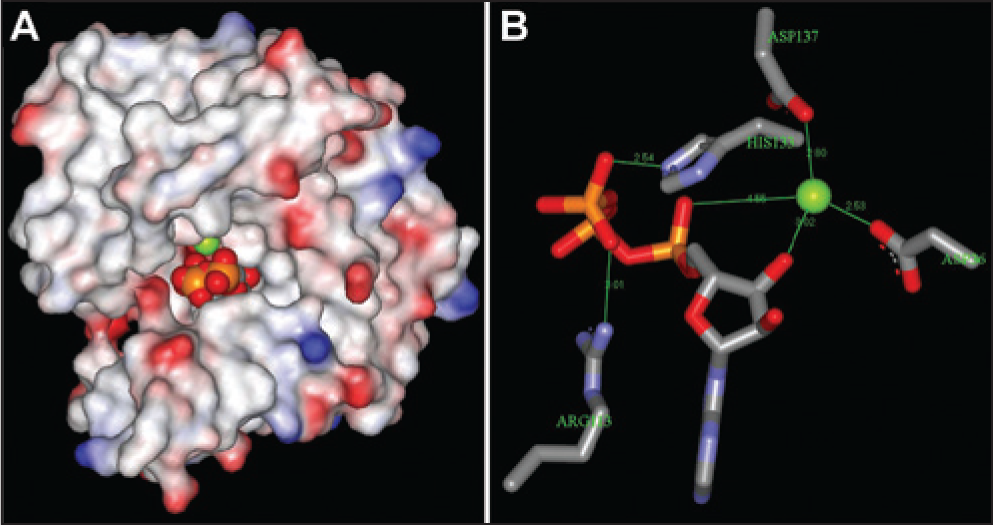
X-ray crystal structure of Aquifex aeolicus tRNAIle lysidine synthetase (TilS) with Mg2+ and adenosine triphosphate (ATP) bound, based on PDB 2E89. (
Although ATP is an abundant substrate in the cytoplasm of bacterial cells, drug discovery experience has shown that ATP-competitive inhibitors can be obtained with sufficient potency to inhibit a cytoplasmic target even when its Km(ATP) is much lower than the millimolar cytoplasmic ATP concentration. For example, Eakin et al. 9 and Sherer et al. 10 identified a series of ATP-competitive inhibitors of bacterial DNA gyrase (pyrrolamides) using fragment-based lead generation. A compound developed from this series (compound 4 in ref. 9 and compound 2 in ref. 10 ) inhibited the ATPase activity of Escherichia coli and Staphylococcus aureus gyrase with IC50’s of 25 and 20 nM, respectively, and had minimum inhibitory concentrations against an efflux-defective tolC mutant of E. coli and a wild-type strain of S. aureus of 0.25 and 8 µg/ml, respectively. The Km(ATP) of E. coli gyrase in the presence of DNA was reported to be 450 µM. 11 The Km(ATP) of S. aureus gyrase in the presence of DNA was measured at 200 µM. 12 Spontaneous resistance mutations were found in the gyrB gene of S. aureus coding for the GyrB subunit in residues within the ATP binding site, confirming the mode of action in this species to be competition with ATP. X-ray crystal structures were solved of closely related compounds bound in the ATP binding site of S. aureus GyrB. Thus, the relatively high intracellular concentration of ATP could be overcome as a barrier to cell growth inhibition by an ATP-competitive enzyme inhibitor by sufficiently high target affinity.
A focus on identifying ATP-competitive inhibitors of TilS requires consideration of possible off-target effects caused by inhibition of human enzymes. There are no mammalian homologs of TilS. The ATP binding site of TilS, however, belongs to the N-type ATP pyrophosphatase family that includes GMP synthetase, NAD+ synthetase, asparagine synthetase, argininosuccinate synthetase, and ATP sulfurylase. The conserved features of the nucleotide binding sites include the PP motif SGGXDS and a second conserved motif, PLxxxx(R/K), both of which are involved in binding to the ATP phosphates.8,13 Assuring selectivity of TilS inhibitors versus these related enzymes would rely on interactions with the parts of the binding site that are not conserved among family members.
We developed a simple, ultrahigh-throughput-compatible screen to identify ATP-competitive TilS inhibitors. The fluorescence anisotropy–based screen uses an ATP analog bearing a fluorescent label on the solvent-exposed γ-phosphate. A collection of 1,400,000 compound samples was screened in a 1536-well format. Compounds identified as inhibitors based on reduced fluorescence anisotropy were further tested for inhibition of TilS-catalyzed tRNAIle(CAU) lysidinylation. Two series of novel inhibitors of TilS isozymes from the Gram-negative pathogens E. coli and Pseudomonas aeruginosa were identified.
Materials and Methods
Chemicals and Reagents
Adenosine 5′-O-(3-thiotriphosphate) BODIPY FL thioester® (BODIPY-ATPγS) was from Life Technologies/Molecular Probes (Carlsbad, CA). γ-[6-Aminohexyl]-adenosine-5′-triphosphate, labeled with 5/6-TAMRA (TAMRA-ATP), was obtained from Jena Bioscience GmbH (Jena, Germany).
Synthetic tRNAs were prepared by TriLink BioTechnologies (San Diego, CA). The sequence of the E. coli TilS tRNA substrate was 5′-phosphate-GGCCCCUUAGCUCAGUGGUUAGAGCAGGCGACUCAUAAUCGCUUGGUCGCUGGUUCAAGUCCAGCAGGGGCCACCA-3′. The sequences of the two P. aeruginosa tRNAs having a CAU anticodon were 5′-GGCUACAUAGCUCAGUCGGUUAGAGCGCAGCAUU
Cloning and purification of TilS isozymes are described in the
Fluorescence Anisotropy Measurements
Unless stated otherwise, BODIPY-ATPγS fluorescence anisotropy measurements were made in 30 µl in buffer consisting of 50 mM HEPES–NaOH (pH 7.0), 2 mM dithiothreitol, 1 mM MgCl2, 0.005% Triton X-100, and 5 nM BODIPY-ATPγS. Anisotropy measurements were made in black polystyrene 384-well plates (Thermo Fisher Scientific, Hudson, NH) with a Pherastar plate reader (BMG Labtech, Cary, NC) using 485 nm excitation and 520 nm emission and equipped with polarizing filters. For testing compound potencies, compound samples were tested on a range of twofold serial dilutions from 200 µM to 0.39 µM in the presence of 2% DMSO.
High-Throughput Screening (HTS) with Fluorescence Anisotropy
For HTS, TAMRA-ATP was used instead of BODIPY-ATPγS to minimize interference from compound autofluorescence by using a longer excitation wavelength. The Kd of TAMRA-ATP with E. coli TilS was 106 ± 6 nM. Compound samples dissolved in DMSO were dispensed acoustically using an Echo® instrument (Labcyte, Inc., Sunnyvale, CA) into untreated black polystyrene 1536-well assay plates (Greiner Bio-One, Monroe, NC). For the majority of the samples, 40 nl of 2 mM solutions was dispensed for a final assay concentration of 10.6 µM. For high-concentration screening (HCS) of low-molecular-weight compounds (“fragments”), 14 75 nl of 100 mM stock solutions was dispensed for a final assay concentration of 1 mM. For the fragment samples, a replicate plate was used for artifact correction measurements (see below). Artifact correction plates were not used for the rest of the screen for economy of materials and time. Control plates were also prepared in which either DMSO alone was added (no inhibition = MAX) or 0.5 µl of 4.8 mM ATP–NaOH (pH 7.0) was added (100% inhibition = MIN). To each well was added 7.5 µl of a solution containing 110 nM E. coli TilS and 5 nM TAMRA-ATP in 50 mM HEPES–NaOH (pH 7.0), 2 mM dithiothreitol, 1 mM MgCl2, and 0.005% Triton X-100 using a Bioraptr dispenser (Beckman Coulter Inc., Brea, CA). Plates were tapped to ensure that reagent filled the bottom of the wells and covered. Fluorescence anisotropy was measured after 30 min using a Pherastar plate reader equipped with 540 nm excitation, 590 nm emission, and polarizing filters.
Data analysis was completed using an in-house wavelet-based pattern correction algorithm to correct for any potential spatial patterns on plates and temporal patterns throughout the time of the run. 15 Z′ factors 16 were calculated following application of this pattern correction. The percentage effect for each compound was calculated based on the control data for each run (% inhibition = 100 × [1 − (test result − median MIN) / (median MAX − median MIN)]. Samples tested at 10 µM were considered to be active if they produced greater than 40% inhibition, produced inhibition greater than three interquartile ranges (IQRs) after wavelet-based pattern correction, or produced inhibition greater than 2.5 IQRs without wavelet-based pattern correction. Fragment samples tested at 1 mM were considered to be active if they produced greater than 40% inhibition.
For concentration response measurements to follow up hits identified originally at 10 µM, samples were tested at concentrations of 100, 50, 26, 13.6, 7, 6.25, 3.3, and 1.6 µM. To follow up fragment hits identified originally at 1 mM, samples were tested at concentrations of 2000, 1000, 500, 266, 133, 66, and 33 µM. The artifact correction procedure (see below) was used in every case.
Artifact Correction
An artifact correction procedure 17 was used for the fluorescence anisotropy assay to correct for compound autofluorescence or fluorescence quenching. Parallel and perpendicular fluorescence intensity measurements were corrected individually before being combined to calculate fluorescence anisotropy.
Scintillation Proximity Assay (SPA)
Assays were performed in 384-well white polystyrene assay plates. Unless stated otherwise, reactions with E. coli TilS were performed in 30 µl in buffer consisting of 50 mM Tris-HCl (pH 8.5), 15 mM NaHCO3, 5 mM MgCl2, 0.5 mM tris(2-carboxyethyl)phosphine hydrochloride (TCEP), 0.06% Brij-35, and 0.1 mg/ml bovine serum albumin (BSA) with 5 µM ATP, 160 nM E. coli tRNAIle(CAU), 200 nM [3H]-lysine (specific activity 91.6 Ci/mmol; PerkinElmer, Waltham, MA), and 8 nM E. coli TilS. Unless stated otherwise, reactions with P. aeruginosa TilS were performed in 30 µl in buffer consisting of 50 mM Tris-HCl (pH 8.5), 0.5 mM MgCl2, 0.5 mM TCEP, 0.06% Brij-35, and 0.1 mg/ml BSA with 5 µM ATP, 160 nM P. aeruginosa tRNAIle(CAU), 400 nM [3H]-lysine, and 30 nM P. aeruginosa TilS. Reactions also contained various concentrations of compound samples dissolved in DMSO for a final DMSO concentration of 2% by volume. Reactions were quenched with 15 µl/well of a 4.4 mg/ml suspension of polyvinyltoluidine–polyethyleneimine–wheat germ agglutinin SPA beads (PerkinElmer) in 262 mM sodium citrate (pH 2) and 150 mM NaCl. Plates were sealed with clear film (PerkinElmer), and signal due to radiolabeled lysine incorporation into tRNA was measured by scintillation counting with a TopCount plate reader (PerkinElmer) for 1 min/well after a minimum bead-settling time of 2 h.
For correction of scintillation quenching artifacts caused by compound samples, the enzyme was omitted and [3H]-tRNA was added instead of [3H]-lysine and tRNA. [3H]-tRNA was prepared by reacting 10 µM ATP, 320 nM E. coli tRNAIle(CAU), 400 nM [3H]-lysine, and 187 nM E. coli TilS for 2 h in the E. coli reaction buffer. [3H]-tRNA was used at a final dilution of 1:25. Data were rejected from wells in which the signal was suppressed by more than 50% by the presence of the compound sample.
IC50 Calculation
Percentage inhibition at each compound sample concentration in the SPA was calculated with the following equation:
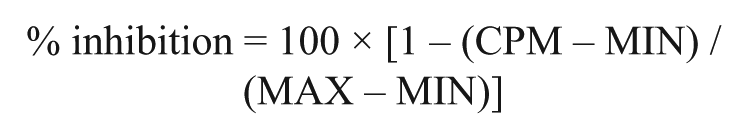
where CPM is the artifact-corrected counts per minute, MAX is the average counts per minute for the 32 wells on the same plate with no inhibitor, and MIN is the average counts per minute for the 32 wells on the same plate to which nonradioactive lysine had been added to a final concentration of 200 µM to give the same signal as would have been obtained if no enzyme had been present. MIN and MAX wells contained 2% DMSO by volume. The concentration of inhibitor giving IC50 was calculated by nonlinear least-squares regression to the following equation:
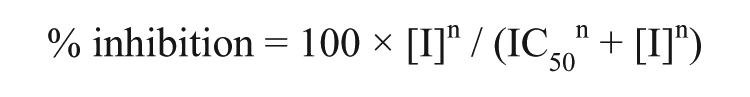
where [I] is the inhibitor concentration and n is the Hill slope.
One-Dimensional (1D) Ligand-Observe Nuclear Magnetic Resonance (NMR)
All NMR spectra were acquired at 298 K with a 600 MHz NMR instrument with a Bruker AVANCE III console (Bruker, Billerica, MA) and a triple-resonance cryogenic probe. A WaterLOGSY pulse sequence was used. 18 The first water-selective 180° Sinc pulse was 6 ms long, and a weak rectangular pulse field gradient was applied during the mixing time (1.8 s). A gradient recovery time of 2 ms was introduced after the mixing time. Water suppression was achieved by the excitation sculpting scheme. 19 The water-selective 180° Sinc shape pulse was 3 ms long. The data were collected with a sweep width of 9157 Hz, 0.45 s acquisition time, and 1.8 s for the relaxation delay. Sixty-four scans were recorded for each experiment, requiring 5 min per spectrum. The data were zero filled to 32,768 complex points and multiplied by an exponential function (line broadening 3 Hz) prior to Fourier transformation. For experiments with E. coli TilS, the buffer consisted of 50 mM Tris-HCl (pH 8.5), 15 mM NaHCO3, 5 mM MgCl2, 0.5 mM TCEP, and 5% [volume/volume (v/v)] D2O. For experiments with P. aeruginosa TilS, the buffer consisted of 50 mM Tris-HCl (pH 8.5), 0.5 mM MgCl2, 0.5 mM TCEP, and 5% (v/v) D2O. Protein concentrations were 20 µM. The ATP concentration was 200 µM. The compound concentrations were approximately 200 µM. Compounds were dissolved in d6-DMSO. In the WaterLOGSY experiment, reduction in the intensity of the aromatic proton peaks of ATP on compound addition indicates displacement of ATP from the protein by the compound.
Compound Purity Measurements
All chemicals were of high-performance liquid chromatography (HPLC) grade or higher and purchased from Sigma Aldrich (St. Louis, MO). Four µL of each 10 mM stock solution in DMSO was diluted to 120 µL with 1:1 methanol–water. An LC–ultraviolet (UV)–mass spectrometry (MS) method was used for purity measurements. All samples were analyzed on either of two LC–MS instruments controlled by MassLynx software v. 4.1 (all from Waters, Milford, MA). Each system consisted of an Acquity UPLC (ultraperformance liquid chromatography) System with a binary pump, autosampler, sample organizer, column compartment, and photodiode array detector. One system was coupled to a Quattro Micro mass spectrometer. The other system was coupled to an LCT Premier mass spectrometer. Each UPLC had an Acquity UPLC high-strength silica T3 column (2.1 × 30 mm, 1.8 µm particles size) maintained at 30 °C. The injection volume was 2 µL. Eluent A was water plus 0.1% formic acid. Eluent B was acetonitrile plus 0.1% formic acid. The flow rate was 1.1 mL/min. A gradient method ran from 5% to 95% solvent B during the course of 1.0 min, then re-equilibrated at 5% solvent B until 1.1 min. The mass spectrometer used to confirm sample identities was operated using electrospray ionization with positive and negative switching. Analysis was done in full-scan mode from 100 to 1000 Da. For the LCT Premier, the capillary voltages were 2.5 kV, cone voltage was 100 V, desolvation temperature was 400 °C, source temperature was 120 °C, cone gas flow was 50 L/min, and scan rate was 10,000 Da/sec. For the Quattro Micro, the capillary voltages were 3.5 kV, cone voltage was 35 V, desolvation temperature was 350 °C, source temperature was 130 °C, cone gas flow was 50 L/min, and scan rate was 5000 Da/sec. The sample purity was reported as a percentage of peak area based on the photodiode array detector, scanning from 210 to 400 nm with 1.2 nm resolution.
Results
BODIPY-ATPγS bound to E. coli and P. aeruginosa TilS isozymes with high affinity as measured by the increase in fluorescence anisotropy ( Fig. 2 ). The apparent Kd’s were 60 ± 6 nM and 27 ± 6 nM (best-fit value ± standard error of fit) for E. coli and P. aeruginosa TilS, respectively. These values were overestimates, however, because the fluorescence of BODIPY-ATPγS was lower when bound than when unbound by 64 ± 2% for E. coli TilS and 29 ± 6% for P. aeruginosa TilS (average ± SD of triplicate measurements). Thus, using the formula

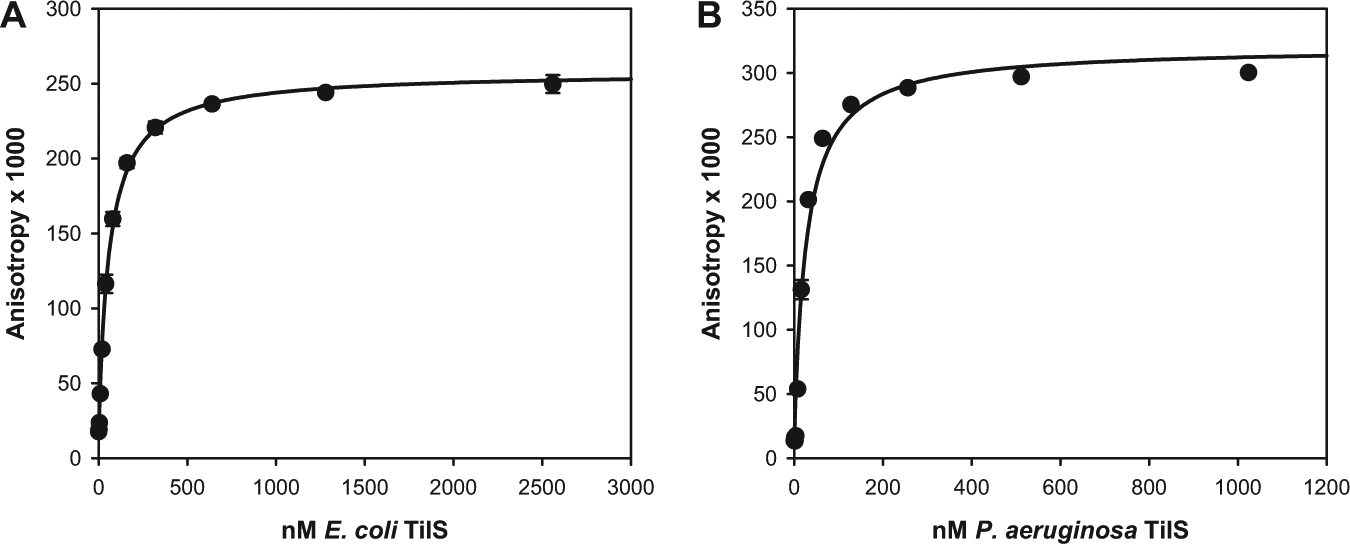
Binding of BODIPY-ATPγS to (
where Ibound/Ifree is the ratio of the fluorescence intensities of bound and free BODIPY-ATPγS, 20 the true Kd’s were approximately 60 nM × 0.36 = 22 nM for E. coli TilS and 27 nM × 0.71 = 19 nM for P. aeruginosa TilS.
The affinity of E. coli TilS for BODIPY-ATPγS was highly sensitive to the buffer conditions, especially the identity and concentration of salt (
ATP competed fully with BODIPY-ATPγS binding to both E. coli and P. aeruginosa TilS isozymes ( Fig. 3 ), consistent with BODIPY-ATPγS interacting predominantly with the ATP binding site. The IC50’s for the competition by ATP were 0.74 ± 0.03 µM and 4 ± 2 µM for E. coli and P. aeruginosa TilS isozymes, respectively. The BODIPY-ATPγS concentration in these assays was 5 nM, substantially lower than the Kd for both isozymes. Therefore, the ATP IC50’s are approximately equal to their Kd’s. Thus, the ATP binding site of TilS will be saturated with ATP during normal growth conditions of the bacteria when millimolar ATP concentrations are present in the cytoplasm.
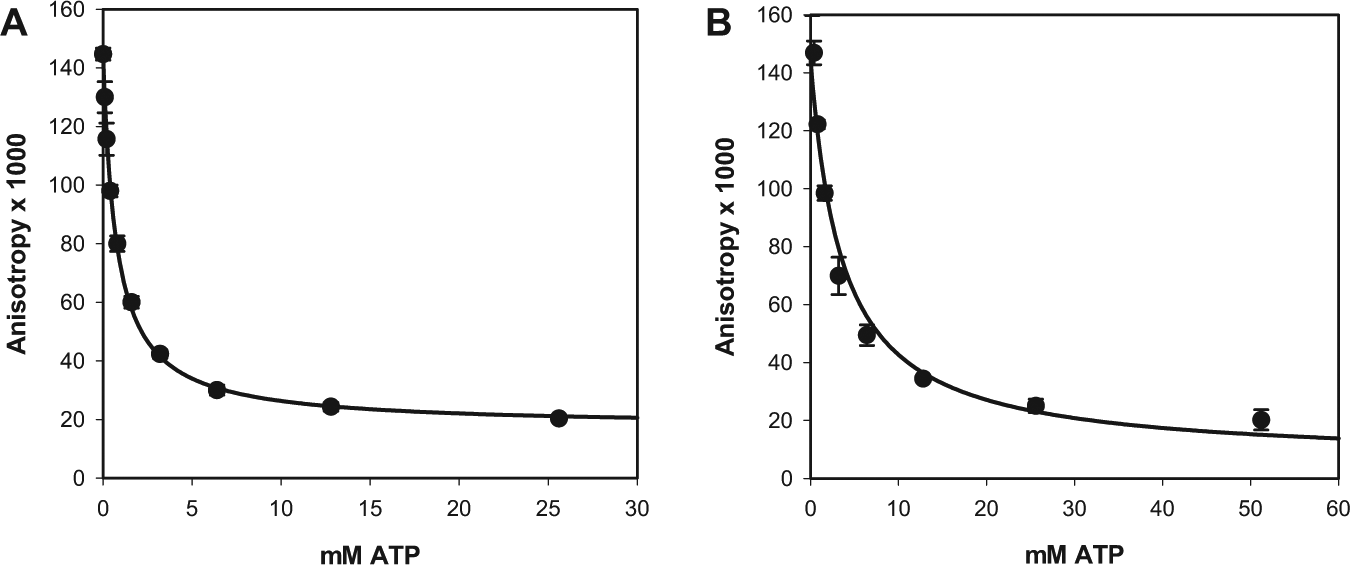
Competition by adenosine triphosphate (ATP) with BODIPY-ATPγS for binding to (
Adenosine and 5′-deoxyadenosine also competed with BODIPY-ATPγS for binding to E. coli TilS, with IC50’s of 102 ± 8 µM and 225 ± 13 µM, respectively (average and SD of duplicate measurements). This observation supported the expectation of identifying other, relatively low-molecular-weight, unphosphorylated, druglike competitive inhibitors of ATP binding to TilS using BODIPY-ATPγS fluorescence anisotropy as a screening assay.
The relatively large change in fluorescence anisotropy of BODIPY-ATPγS on binding to TilS {0.245 ± 0.005 for E. coli and 0.31 ± 0.02 for P. aeruginosa TilS [(nonlinear least-squares regression best fit ± standard error of fit)]} and the high affinity of the interaction ( Fig. 2 ) suggest that the BODIPY FL moiety interacts with the protein, presumably in the vestibule outside the ATP binding pocket ( Fig. 1 ). It was therefore a concern that a BODIPY-ATPγS fluorescence anisotropy–based screen would identify active samples that competed with or bound to the BODIPY FL moiety rather than with ATP without necessarily inhibiting the catalytic activity of the enzyme. To deal with this issue, we prepared to use the previously published SPA for the TilS-catalyzed lysidinylation of tRNA 7 to follow up the active samples from the fluorescence anisotropy–based screen.
The buffer conditions for the SPA were optimized individually for E. coli and P. aeruginosa TilS, using E. coli tRNAIle(CAU) as the substrate (
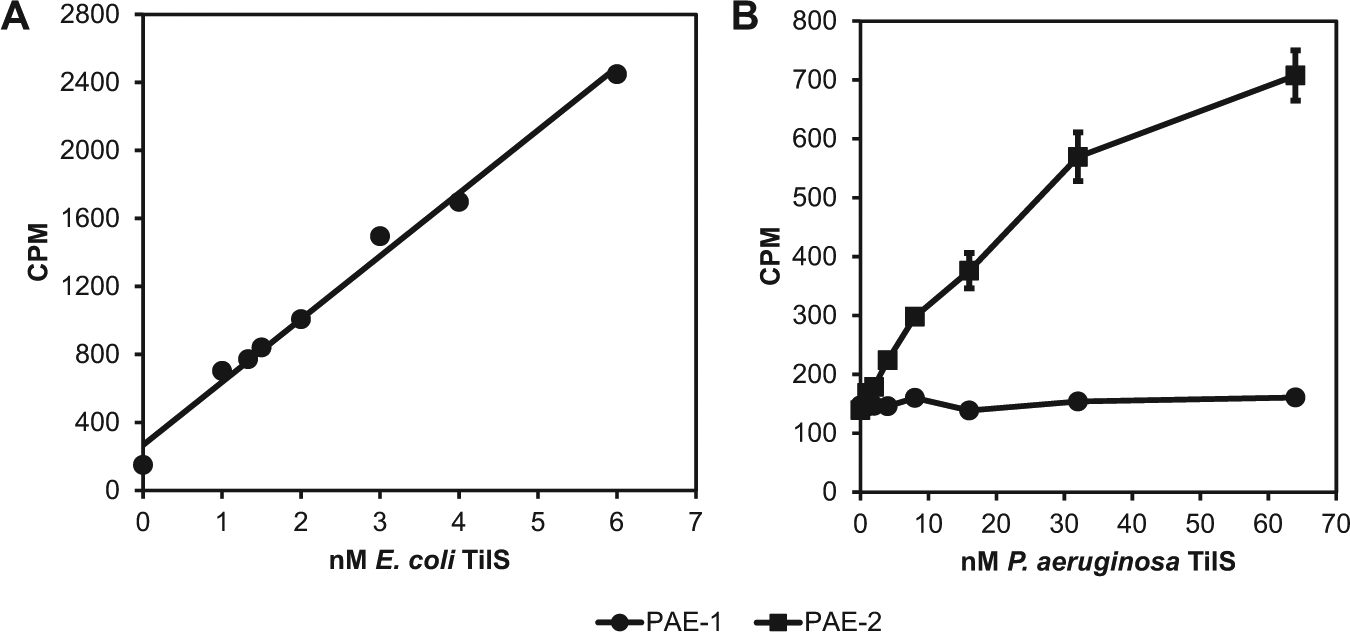
(A) Scintillation proximity assay (SPA) for lysidinylation of Escherichia coli tRNAIle(CAU) as a function of E. coli tRNAIle lysidine synthetase (TilS) concentration. CPM, counts per minute. Each data point is a single measurement. (B) SPA for lysidinylation of PAE-1 and PAE-2 tRNAs as a function of Pseudomonas aeruginosa TilS concentration. Data points and error bars represent the average and standard deviation of triplicate measurements.
To determine which of the two CAU anticodon–containing P. aeruginosa tRNAs is the TilS substrate, we tested both tRNAs as substrates in the P. aeruginosa TilS SPA. Because they were prepared by chemical synthesis, the tRNAs lacked all posttranscriptional modifications. Figure 4B shows that only PAE-2 was a substrate for P. aeruginosa TilS. We conclude that PAE-1 is the P. aeruginosa tRNAMet(CAU) and PAE-2 is the tRNAIle(CAU).
HTS and Concentration Response with TAMRA-ATP
The HTS in 1536-well plates used 22 batch runs. The average of the Z′ factors of the runs was 0.55 (SD = 0.06). The hit rate for 1,394,764 compound samples screened at 10 µM without artifact correction was 1.7%. The hit rate for 16,580 fragments screened at 1 mM with artifact correction was 10.8%. Data rejection was not used in the fragment screen for samples in which the interference caused more than a 50% decrease or twofold increase in the expected signal, which likely resulted in some false positives.
Concentration response measurements were made on a subset of 6034 samples from the set of compounds active at 10 µM and 1507 samples from the set of fragments active at 1 mM, with artifact correction in both cases. Thirty-three percent of the former set was considered to be active, with IC50 < 100 µM, whereas 5.1% of the latter set was considered to be active, with IC50 < 2 mM.
Hit Evaluation
In the first round of evaluation of active samples from HTS, 1554 chemically diverse active samples were selected for detailed investigation based on their IC50’s with E. coli TilS in the fluorescence anisotropy assay with TAMRA-ATP being < 50 µM. Samples were first tested for inhibition of BODIPY-ATPγS binding to both E. coli and P. aeruginosa TilS isozymes. Samples were selected for further investigation if they had IC50’s < 50 µM versus both isozymes, had Hill slopes of the IC50 curves < 2 (the ideal value being 1), and were shown by LC–MS to have a minimum of 80% purity based on UV absorbance detection and the expected mass. For samples with IC50’s < 1.56 µM, the Hill slope < 2 requirement was waived because the concentrations tested did not extend sufficiently below this concentration for the Hill slope to be measured precisely. (The lowest concentration tested was 0.39 µM in a set of twofold serial dilutions.) Out of the 1554 samples entering this test cascade, 425 advanced to testing with the E. coli SPA to eliminate false positives due to inadequately corrected interference. In addition, 103 out of 270 active samples from a high-concentration screen (HCS) of a fragment library progressed through the test cascade to the E. coli SPA. The largest single source of attrition of samples prior to the SPA was failure to satisfy the LC–MS quality control requirements.
Only 18 out of 425 samples from HTS and 11 out of 103 samples from HCS met the IC50 < 50 µM and Hill slope < 2 criteria in the E. coli SPA. A likely explanation for this high level of attrition is that the majority of the compound samples inhibited binding to the protein of the TAMRA or BODIPY FL fluorophore rather than ATP, as discussed above.
Twenty-eight of the 29 samples were tested for binding to E. coli TilS and competition with ATP using 1D ligand-observe NMR techniques, and 13 of them showed evidence for both binding and ATP competition. Thus, 13 out of 1554 HTS and HCS actives (0.84%) were found to have the intended mode of inhibition for which the screen was designed.
Considering this high attrition, a more efficient strategy was used for hit evaluation of another 2992 HTS and HCS samples consisting of active samples from the screen and near-neighbor analogs of them. The process began with measurements of percentage inhibition by each compound at a single concentration of 200 µM for HTS actives or 2 mM for HCS actives in the E. coli SPA. Because the artifact correction technique rejected data from wells in which the signal was quenched by more than 50%, a high proportion (42%) of the samples was unevaluable. Of the remaining samples, 233 had 50–125% inhibition (>100% inhibition was allowed to account for the error of measurement). The E. coli SPA IC50’s and LC–MS purities of these and some additional samples were subsequently measured. Only 27 samples out of 449 tested had IC50 < 50 µM and Hill slope < 2, and nine of these failed LC–MS quality control. Thus, at most 1.0% of the evaluable samples tested in the second round of hit evaluation met the desired criteria.
1D WaterLOGSY NMR experiments were performed on repurified samples of a pair of structurally similar compounds from the second round of hit evaluation to test them for binding to E. coli and P. aeruginosa TilS isozymes and the ability to compete with ATP (compounds 1 and 6 in Table 1 ). These compounds were selected based on their superior inhibitory potency in the E. coli SPA. Both compounds bound to both isozymes and displaced ATP. The result for compound 6 is shown in Figure 5 .
Inhibition of Escherichia coli and Pseudomonas aeruginosa tRNAIle lysidine synthetase (TilS) isozymes by analogs of compounds identified by the high-throughput screen for adenosine triphosphate–competitive inhibitors of TilS.
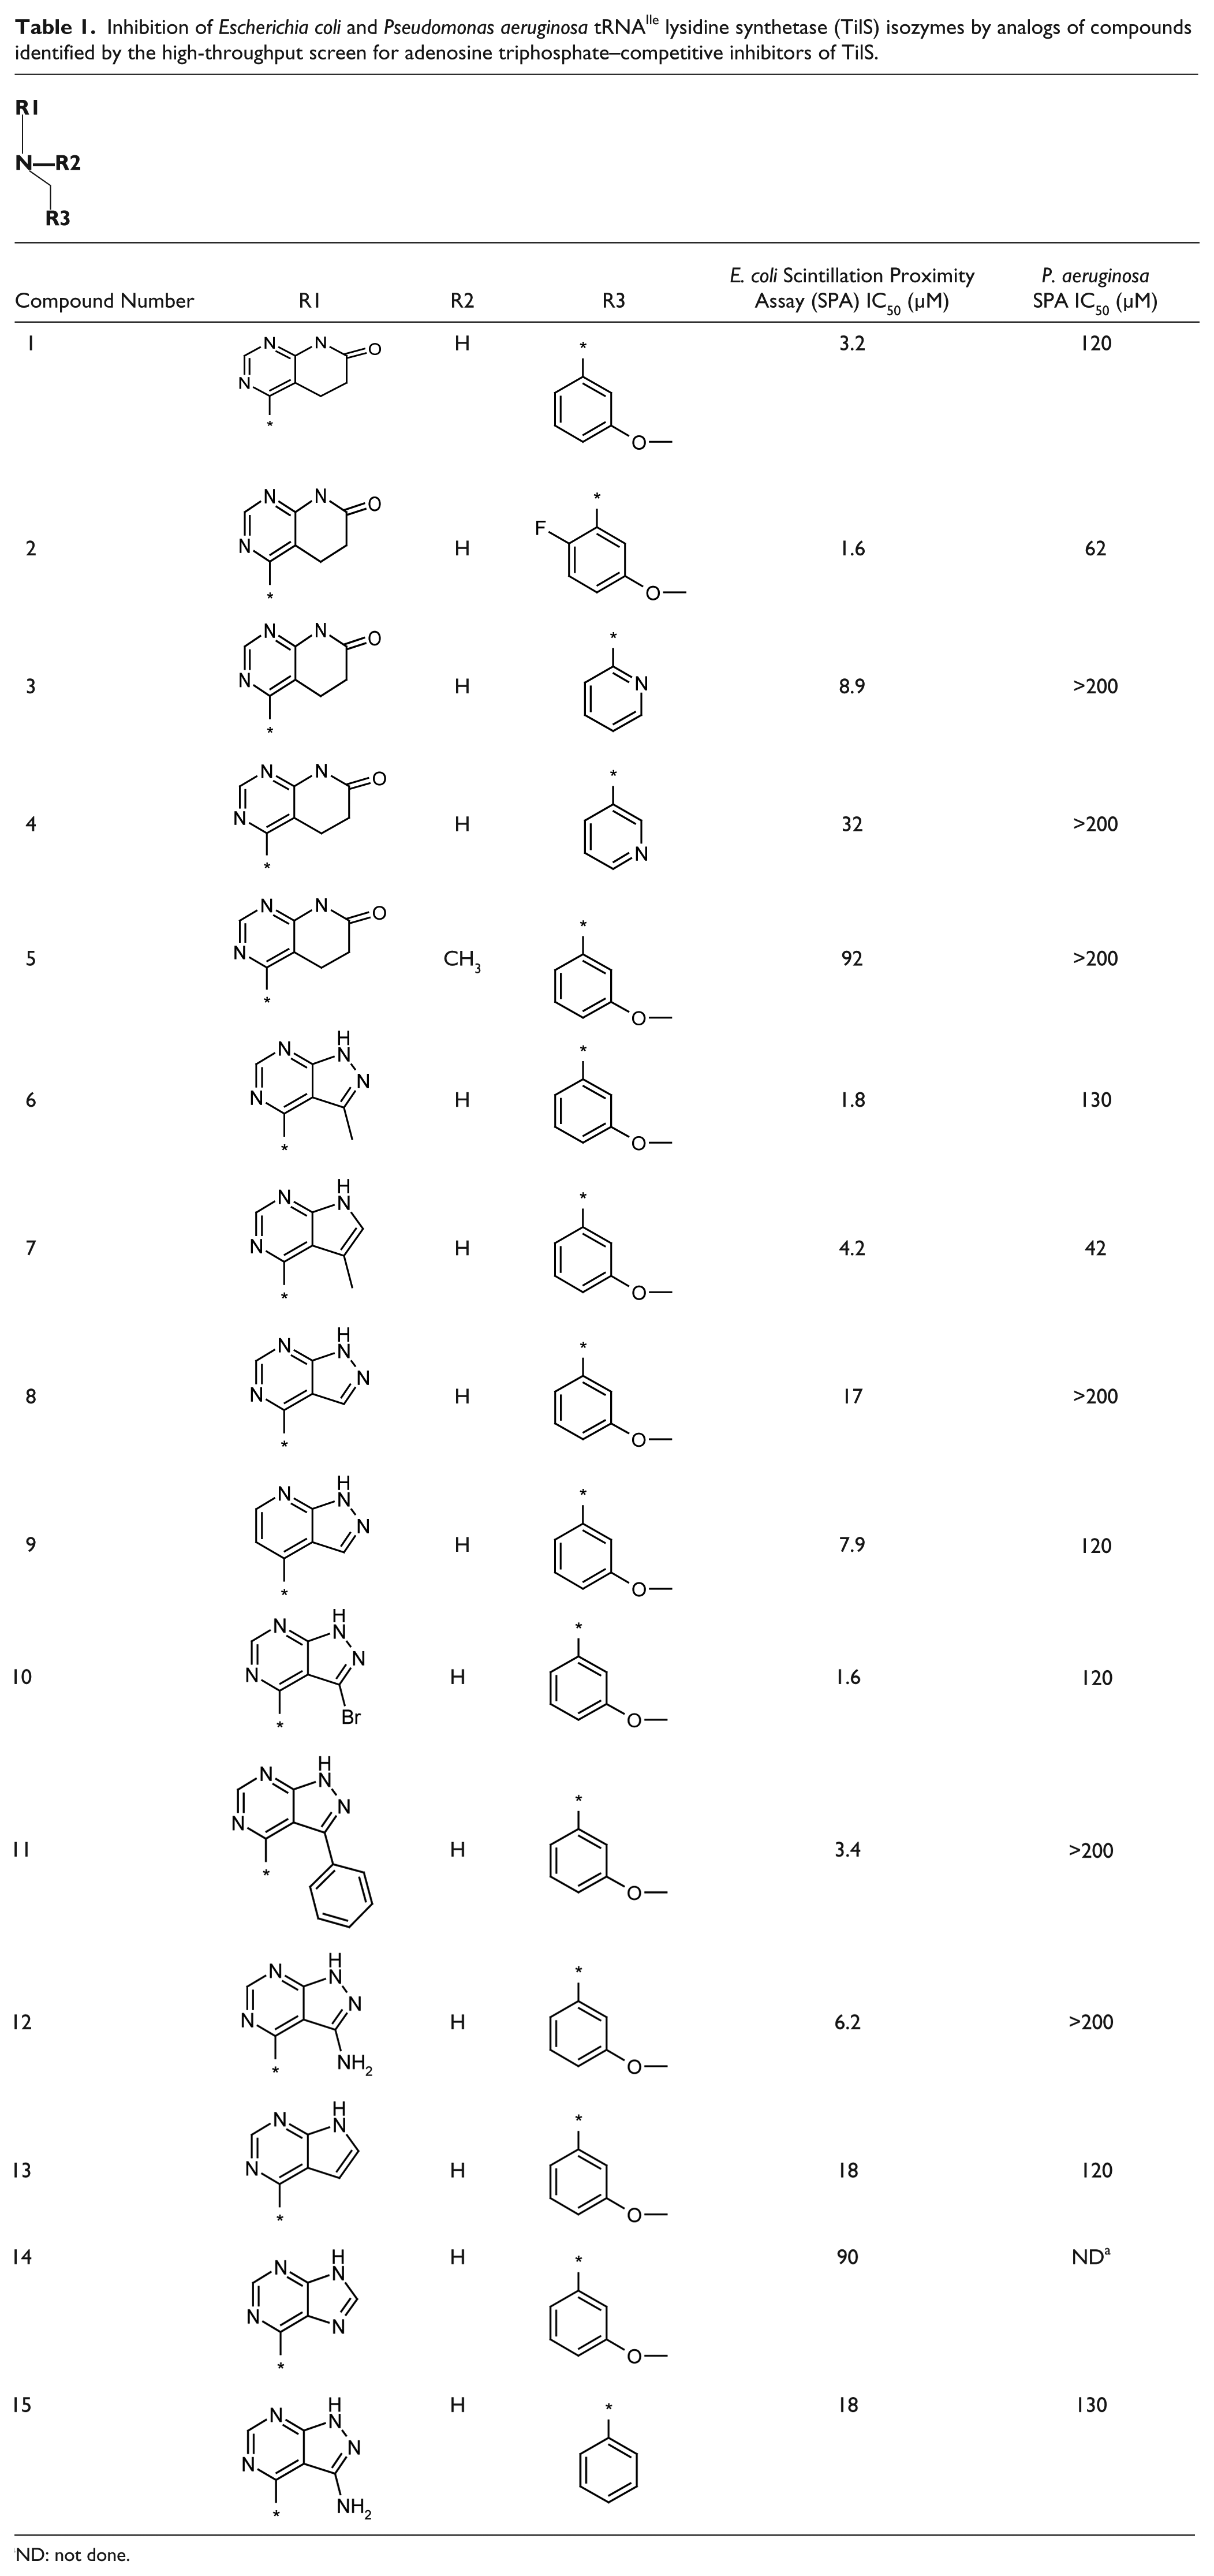
ND: not done.
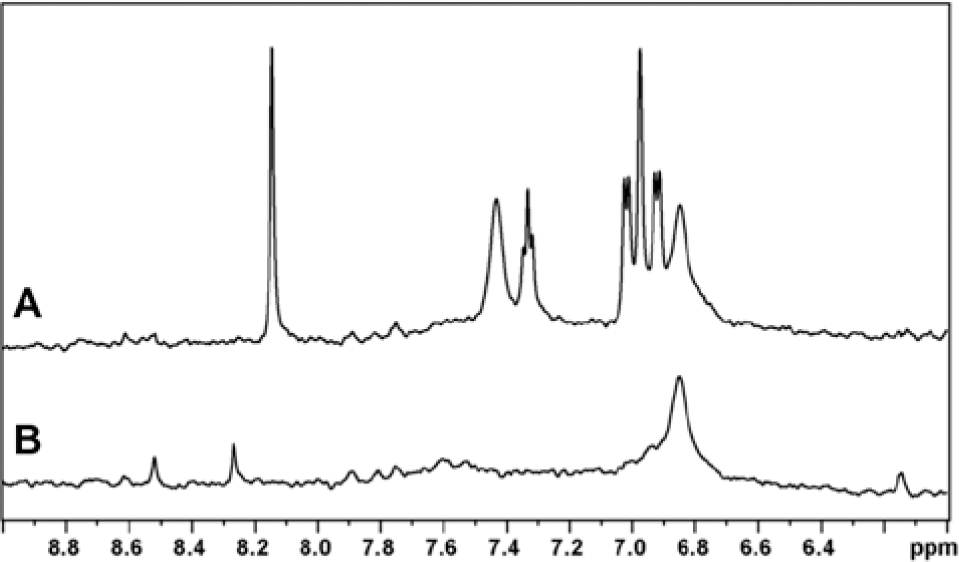
WaterLOGSY nuclear magnetic resonance experiment demonstrating displacement of adenosine triphosphate (ATP) from Escherichia coli tRNAIle lysidine synthetase (TilS) by compound 6. (
The structure–activity relationship of this series of compounds was further investigated by synthesizing analogs ( Table 1 ). Compounds 1 and 6, with two different R1 substituents but the same R2 and R3 substituents, were identified by the HTS. Compounds 1 and 6 had similar potencies for inhibition of the complete TilS reaction. Replacement of the proton at R2 with a methyl group (compare compounds 1 and 5) greatly reduced the potency of inhibition. Several variations in the R1 and R3 substituents resulted in changes in inhibitory potency. These compounds generally showed more potent inhibition of E. coli TilS than of P. aeruginosa TilS. Compound 7 had the highest inhibitory potency for P. aeruginosa TilS.
Discussion
The fluorescence anisotropy–based assay for ATP-competitive inhibitors of TilS using ATP labeled with a fluorophore on the γ-phosphate enabled the use of ultrahigh-throughput screening of ~1,400,000 compound samples individually in 1536-well plates, which would not have been feasible using a SPA or other radiometric assay. A radiometric enzymatic assay or biophysical assay of compound binding could be used for a smaller screen, such as of a fragment library containing hundreds to a few thousand compounds. Unlike the fluorescence anisotropy assay, these screening approaches would have the capability of identifying compounds with other modes of inhibition besides ATP competition. Nevertheless, the deep ATP binding pocket in TilS was attractive as a potential inhibitor binding site, and the fluorescence anisotropy assay was a convenient, high-throughput means to screen for novel ligands that bind there.
In the fluorescence anisotropy assay, interference by compound autofluorescence was mitigated by using a fluorophore with long-wavelength excitation. This assay was nevertheless prone to a high rate of false positives, many of which may have resulted from the competition of compounds with the fluorophore located outside of the ATP binding site instead of with ATP, as well as from sample deterioration leading to the accumulation of nonspecific inhibitors. Despite this drawback, the availability of a high-throughput orthogonal SPA and of high-throughput LC–MS-based sample quality control made it possible to eliminate quickly the false positives and identify true ATP-competitive inhibitors. Their ATP-competitive binding was confirmed by ligand-observe NMR. The compound series shown here is the first reported druglike series of ATP-competitive inhibitors of TilS (i.e., compounds that are not ATP analogs). The compounds inhibited the screening isozyme of E. coli with greater potency than the P. aeruginosa isozyme.
Nakanishi et al. 21 showed that E. coli TilS modifies tRNAIle2 prior to its maturation by removal of a 3′-trailer sequence so that all mature tRNAIle2 is lysidinylated. This is consistent with our observation that chemically synthesized tRNAIle2 lacking posttranscriptional base modifications is a substrate for TilS. This was also true for P. aeruginosa TilS.
Although TilS is an essential enzyme in many pathogenic bacterial species, the effect of inhibiting its activity with a compound on the growth of the bacteria may be somewhat delayed until the existing pool of lysidinylated tRNAIle(CAU) becomes depleted through either degradation or dilution among daughter cells. Such behavior was observed for compounds that inhibit bacterial 4′-phosphopantetheine adenylyltransferase (CoaD), an enzyme in the pathway for biosynthesis of coenzyme A. 22 This assumes that (1) the available pool of lysidinylated tRNAIle(CAU) in untreated cells is more than sufficient for decoding AUA codons during translation, and (2) the normal rate of turnover of lysidinylated tRNAIle(CAU) is low relative to the rate of cell division. If either or both of these assumptions were false, translation of mRNA could be halted almost immediately on exposure of cells to a sufficiently potent drug that inhibits TilS activity due to an insufficient supply of lysidinylated tRNAIle(CAU). A potent TilS inhibitor with antibacterial activity would be useful for investigating this facet of TilS function in vivo.
The inhibitors disclosed in this article did not show antibacterial activity even in efflux pump–deficient E. coli (tolC) and P. aeruginosa (MexABCDXY) strains, probably due to insufficient potency and/or insufficient cell penetration. Outer membrane permeability barrier–defective strains were not tested. Nevertheless, these compounds could form the basis for the development of more potent and permeable compounds able to inhibit bacterial growth through TilS inhibition.
Footnotes
Acknowledgements
We would like to thank Laurie Hajec for preparing the TilS expression vectors; Thomas Sinton, Paul Helmsley, and Karen Taylor for their work on the high-throughput screening campaign; and Paul Fleming for medicinal chemistry input into compound selection for hit follow-up.
Declaration of Conflicting Interests
The authors declared no potential conflicts of interest with respect to the research, authorship, and/or publication of this article.
Funding
The authors received no financial support for the research, authorship, and/or publication of this article.
References
Supplementary Material
Please find the following supplemental material available below.
For Open Access articles published under a Creative Commons License, all supplemental material carries the same license as the article it is associated with.
For non-Open Access articles published, all supplemental material carries a non-exclusive license, and permission requests for re-use of supplemental material or any part of supplemental material shall be sent directly to the copyright owner as specified in the copyright notice associated with the article.