
Abstract
Separase is an endopeptidase that cleaves cohesin subunit Rad21, facilitating the repair of DNA damage during interphase and the resolution of sister chromatid cohesion at anaphase. Separase activity is negatively regulated by securin and Cdk1–cyclin B in vivo. Separase overexpression is reported in a broad range of human tumors, and its overexpression in mouse models results in tumorigenesis. To elucidate further the mechanism of separase function and to test if inhibition of overexpressed separase can be used as a strategy to inhibit tumor-cell proliferation, small-molecule inhibitors of separase enzyme are essential. Here, we report a high-throughput screening for separase inhibitors (Sepins). We developed a fluorogenic separase assay using rhodamine 110–conjugated Rad21 peptide as substrate and screened a small-molecule compound library. We identified a noncompetitive inhibitor of separase called Sepin-1 that inhibits separase enzymatic activity with a half maximal inhibitory concentration (IC50) of 14.8 µM. Sepin-1 can inhibit the growth of human cancer cell lines and breast cancer xenograft tumors in mice by inhibiting cell proliferation and inducing apoptosis. The sensitivity to Sepin-1 in most cases is positively correlated to the level of separase in both cancer cell lines and tumors.
Introduction
Separase is a cysteine protease evolutionarily conserved from yeast to human.1,2 Its primary function is to cleave the cohesin subunit Scc1–Mcd1–Rad21 at the onset of anaphase, resulting in the dissolution of cohesin rings and the independent segregation of sister chromatids into two daughter cells. 3 Recent studies indicate that separase is overexpressed and mislocalized in a number of human tumors, including breast, prostate, and osteosarcoma.4,5 Separase protein is significantly overexpressed in more than 60% of human breast tumors compared to the matched normal breast tissue. 5 In addition, the conditional overexpression of separase in mammary epithelial cells and in the mammary glands of transgenic mice is sufficient to induce precocious separation of sister chromatids, aneuploidy, and tumorigenesis.5,6 These data suggest that abnormal separase expression and mislocalization are drivers of aneuploidy and tumorigenesis. 7
Separase activity is tightly regulated during the cell cycle and is inactive when it binds to its inhibitory chaperone, securin. 8 It is also inhibited via phosphorylation at Ser1126 by cyclin B–Cdk1 kinase and binding to cyclin B. 9 With the progression of the cell cycle to the onset of anaphase, the anaphase-promoting complex–cyclosome polyubiquitinates mitotic cyclin and securin, which are rapidly degraded by the 26S proteasome. Once enzymatically activated, separase autocleaves, resulting in N-terminal and C-terminal fragments that still associate with each other. The main function of separase is to proteolytically cleave the cohesin subunit Rad21. Because separase is overexpressed in human tumors, and its overexpression results in chromosomal missegregation and aneuploidy, pharmacological inhibition of separase presents a novel strategy to target chromosomal missegregation-induced tumorigenesis. Pharmacologic modulation of separase activity remains elusive, however, due to a lack of small-molecular compound inhibitors. We report here the development of a fluorogenic separase assay that we used in a high-throughput screening (HTS) to identify separase inhibitors (Sepins). We have screened a chemical library with 14,400 small compounds and identified five compounds that inhibited separase activity. We have further characterized Sepin-1, a noncompetitive inhibitor of separase, which can inhibit the growth of cancer cell lines and mammary xenograft tumors in mice by inducing apoptosis.
Materials and Methods
Cell lines: The cell lines used included leukemia: HL-60, JM1, Jurkat, Molt-4, and Raji; breast cancer: HBL100, MCF7, MCF10F, MDA-MB-436, MDA-MB-231, SK-BR-3, and T47D; thyroid cancer: TT; neuroblastoma: CHP-212, IMR-32, KCNR, LAN-5, NGP, SHEP, SK-N-AS, SK-N-BE(2), and SH-SY5Y; brain tumor: CHLA-02-ATRT; lung cancer: A549; and colon cancer: HCT116. The cells were cultured according to the protocols recommended by the American Type Culture Collection.
Antibodies: The sources of the antibodies used in this article are as follows: actin monoclonal antibody (mAb) (Sigma, St. Louis, MO), poly (adenosine diphosphate [ADP]–ribose) polymerase (Parp) mAb (BD Bioscience, San Jose, CA), separase mAb (Abnova, Taiwan), caspase-3 polyclonal antibody (pAb) (Cell Signaling Technology, Danvers, MA), Ki67 pAb (Vector Labs, Burlingame, CA), and Rad21 pAb. 10
Purification and activation of separase: Epitope-tagged separase was expressed, purified, and activated as described previously. 11
Fluorogenic separase activity assay: The substrate used here is (Rad21)2–rhodamine 110 (Rh110), which has two Rad21 peptide molecules (Asp–Arg–Glu–Ile–Nle–Arg) conjugated to one molecule of Rh110 (CPC Scientific, Sunnyvale, CA). The assay was set up using 384-well low-volume black polystyrene plates (Corning Incorporate Life Science, Tewksbury, MA). Fifteen microliters of activated separase (~5 ng) were mixed with 5 µl of test compound. The cleavage buffer (CB) used to dilute reagents was 30 mM Hepes–KOH pH 7.7, 50 mM NaCl, 25 mM NaF, 25 mM KCl, 5 mM MgCl2, 1.5 mM adenosine triphosphate, and 1 mM ethylene glycol tetraacetic acid. The mixture was incubated at room temperature for 1 h, and then 5 µl of 0.2 mM substrate (Rad21)2–Rh110 was added. The positive control contained separase, substrate, and CB without the test compound. The negative control contained substrate and CB only. After the reaction mixture was incubation at 37°C for 3 h, and then the relative fluorescence intensity (RFI) was measured (without stopping the enzymatic activity) at λex = 490 nm/λem = 528 nm for Rh110 released from (Rad21)2–Rh110 using a SynergyTM 4 Multi-Mode Microplate Reader (BioTek Instruments Inc., Winooski, VT).
HTS: HTS was performed at the John S. Dunn Gulf Coast Consortium for Chemical Genomics at the University of Texas Medical School at Houston. The compound library used in HTS was the Maybridge HitFinderTM Collection, which contains 14,400 compounds. The compounds were stored in 180 96-well plates with 80 compounds per plate. The concentration of the stock solution of each compound was 10 mM in DMSO. Each compound was diluted to 500 µM in CB using a Biomek FX automation workstation (Beckman Coulter, Inc., Brea, CA) immediately before the assay was performed. HTS was performed on 384-well plates using a Biomek NX Automation Workstation (Beckman Coulter, Inc.) to dispense the compounds and separase enzyme. Three hundred and twenty compounds were assayed in every 384-well plate. In each assay well, 5 µl of 500 µM compound was mixed with 5 ng of separase in 15 µl CB. The reaction mixture was incubated at 25°C for 1 h. After 5 µl of substrate was added to the reaction mixture using Thermo Scientific Multidrop Combi Reagent Dispenser (Thermo Fisher Scientific, Waltham, MA), the plate was incubated at 37°C for 3 h. Each assay plate included 32 positive controls in which CB was used instead of the compounds, and 32 negative controls that did not have either compound or separase. Each compound was assayed in duplicate in two separate plates (A and B). The RFI was determined with a Tecan Infinite 200 Reader (Tecan Group Ltd, Switzerland). The quality of HTS was evaluated by the signal-to-background ratio (S:B), signal-to-noise ratio (S:N), and Z’, defined, respectively, as RFIpositive / RFInegative; (RFIpositive – RFInegative) / STDEVnegative; and Z’ = 1 − [(3 * STDEVpositive + 3 * STDEVnegative) / (RFIpositive − RFInegative)]. The percentage inhibition of separase enzyme activity by compounds was calculated as 100 * {1 − [(RFIcompound − RFInegative) / (RFIpositive − RFInegative)]}. The compounds that inhibited more than 50% of separase activity on both plates A and B were identified as hits.
In vitro cleavage of myc–Rad21 assay: The myc–Rad21 protein was prepared by using pCS2MT Rad21 plasmid 16 as the template and a TNT SP6 High-Yield Wheat Germ Protein Expression kit (Promega, Madison, WI). myc-Rad21 protein was mixed with separase with or without the presence of Sepin-1. The final concentration of Sepin-1 was 50 µM. The reaction mixture was incubated in a 37°C water bath for 1 h. The cleavage of myc–Rad21 was immunoblotted with Rad21 pAb.
Characterization of Sepin-1-mediated inhibition of separase activity in vitro: Different amount of Sepin-1 was mixed with activated separase for 30 min before substrate (Rad21)2–Rh110 was added. After 3 h incubation at 37°C, the fluorescence intensity of Rh110 was determined. Half maximal inhibitory concentration (IC50) was calculated using either the KaleidaGraph program (Synerge Software, Reading, PA) or a four-parameter logistic equation (four-parameter dose–response curve fit): Inhibition of Activity (%) = min + (max − min) / {1 + (log[M] / IC50)}Hill Slop, where min and max represent the minimal and maximal activity inhibition, respectively; Hill Slop is the slope of the curve at its midpoint. To identify the mode of Sepin-1 interacting with separase, different amounts of both Sepin-1 and (Rad21)2–Rh110 were used in the separase activity assay.
In vitro cytotoxicity assay: The inhibitory effect of Sepin-1 on cell growth was assayed using the 3-(4,5-dimethyl-thiazol-2yl)-2,5-diphenyl-tetrazolium bromide (MTT) colorimetric dye reduction method. 12 One hundred thirty-five microliters of exponentially growing cancer cells were plated at a density of 0.4–1.0 × 10⁵ cells per well in a 96-well microtiter plate. After 16 h, Sepin-1 at specified concentrations was added to each well. After 72 h of continuous drug exposure, 15 µl of 5 mg/ml MTT was added to each well, and the plates were incubated for 4 h at 37°C. Medium was replaced with 150 µl of DMSO to solubilize the formazan, and the optical density (OD) was measured at 550 nm using a microplate spectrophotometer (Anthos Analytical, Durham, NC). Cell viability was calculated by subtracting the background OD of media alone from the OD of test wells, then dividing by the OD of the control (untreated) wells. Replicates of three wells were used for each drug concentration. The IC50 was calculated using the KaleidaGraph program. The IC50 values are the average of two independent in vitro cytotoxicity experiments.
Toxicity of Sepin-1 in mice: To test the maximum tolerated dose (MTD) and no-observable-effect level (NOEL) of Sepin-1, we applied 200 µl Sepin-1 (diluted in PBS) one time at an acute dose range of 50 to 100 mg/kg body weight to 8–10-week-old C57B6 mice (~25 g) through intravenous tail vein injection (n = 3/group). Except for the MTD dose, after Sepin-1 injection, the mice were returned to the cage, and their reaction to the drug was monitored from one week to several months. Complete necropsy, blood chemistry, and pathology of the Sepin-1-injected mice were carried out by the Comparative Pathology Laboratory at the Baylor College of Medicine.
Growth inhibition of xenograft tumors: Patient-derived xenograft (PDX) lines MC1 (ER− PR− HER2−) 13 and BCM-5471 (ER− PR− HER2−) 14 were maintained as described 15 by serial transplantation into SCID Beige immunocompromised host mice whose endogenous mammary epithelium was removed surgically. 16
For treatment studies, MCF7 xenografts (ER+ PR+ HER2−) were generated by injection of 1 million cultured cells grown under standard in vitro conditions as previously described. 5 Donor tumors for PDX lines MC1 and BCM-5471 were divided into small fragments and retransplanted into the fat pad of recipient SCID Beige mice (five mice per group). When the tumors reached approximately ~200 mg, mice were treated with either vehicle or Sepin-1. Sepin-1 was injected at a dose of 10 mg/kg daily for 5 days a week for 3 weeks. Guided by our toxicity studies, we chose this dose for SCID beige mice with no apparent effect on body weight and general well-being. Vehicle-injected mice served as controls. The size of the xenografts was measured every 4 days using calipers, and tumor weight was estimated using the guidelines by the National Cancer Institute for xenograft evaluation (http://ncifrederick.cancer.gov/Lasp/Acuc/Frederick/Media/Documents/ACUC14.pdf). After 3 weeks of treatment, the tumors were harvested and fixed in 10% Buffed Formalin Phosphate (Fisher Scientific, Pittsburg, PA) overnight. The tumor tissues were washed with phosphate-buffered solution (PBS) for 3×30min; dehydrated for 1 h at 70%, 80%, 90%, and 100% two times; and immerged in xylene several times until the tissues became clear. The samples were embedded in wax and sectioned with 5 µm in thickness.
All mice were maintained in accordance with the National Institutes of Health Guide for the Care and Use of Laboratory Animals with approval from the Baylor College of Medicine Institutional Animal Care and Use Committee.
Immunofluorescence microscopy: Deparafinization of tumor tissue sections and immunostaining were performed using the protocol reported previously. 4
Immunoblotting: Preparation of protein samples and Western blot was performed as described previously.17,18
Results and Discussion
Development of Separase Activity Assay Using (Rad21)2-Rh110 as a Substrate
7-amido-4-methyl coumaric acid (AMC) is a commonly used dye in protease assays, and we previously reported a fluorogenic separase assay using AMC-labeled Rad21 peptide as the substrate. 11 One of the caveats of AMC-based protease assays is that the results from such assays can potentially be biased and misinterpreted due to the interference of label and compound autofluorescence at the excitation and emission wavelengths of 350 nm and 500 nm, respectively. 19 These interfering factors can be significantly reduced by using red-shift dyes, such as Rh110, which has been widely used in various protease assays.20–22
Rad21 peptide (Asp–Arg–Glu–Ile–Nle–Arg), which contains a separase-cleaving consensus motif (Glu–X–X–Arg), was conjugated to Rh110. Two Rad21 peptides were linked to one Rh110 molecule, forming a bisamide, and the product was named (Rad21)2–Rh110. Because the fluorophore is in the lactone state, (Rad21)2–Rh110 virtually has no autofluorescence. Once the amide bonds between the Rad21 peptide and Rh110 moiety are cleaved by separase, the Rh110 moiety in the Rad21–Rh110 switches its lactone state to a quinine state, which exhibits a significant increase of fluorescence intensity. The fluorescence intensity (relative fluorescence unit [RFU]) increases proportionally with the increase of the amount of free Rh110, measured at λex = 490 nm and λem = 528 nm ( Fig. 1A ). The standard curve of RFU versus Rh110 can be used to calculate the amount of Rh110 formed during the separase assay. We tested the relationship of the increasing concentrations of substrate and enzyme combinations. The amount of Rh110 released was linearly correlated with the increase of (Rad21)2–Rh110 concentration between 0 and 2 nmol/well ( Fig. 1B ). Similarly, the amount of Rh110 released was a linear function with the increase of separase concentration between 0 and 10 ng/well ( Fig. 1C ). In addition, the incubation temperature significantly affects the kinetics of separase. The release of Rh110 catalyzed by separase was much faster at 37°C than that at room temperature (25°C) ( Fig. 1D ). The amount of Rh110 released from (Rad21)2–Rh110 linearly increased between 0 and 3 h ( Fig. 1D ). Both di- and monosubstituted Rad21–Rh110 can be cleaved by separase. The fluorescence intensity of monosubstituted Rad21–Rh110 is about 10% of free Rh110. Taking the assay efficiency and the cost-effectiveness into consideration, we developed the separase assay using 5 ng (~21.7 fmol) of separase and 1 nmol of (Rad21)2–Rh110 in 25 µl reaction volume with 3 h incubation at 37°C. This assay condition was adapted for the HTS for separase inhibitors that is described in this article.
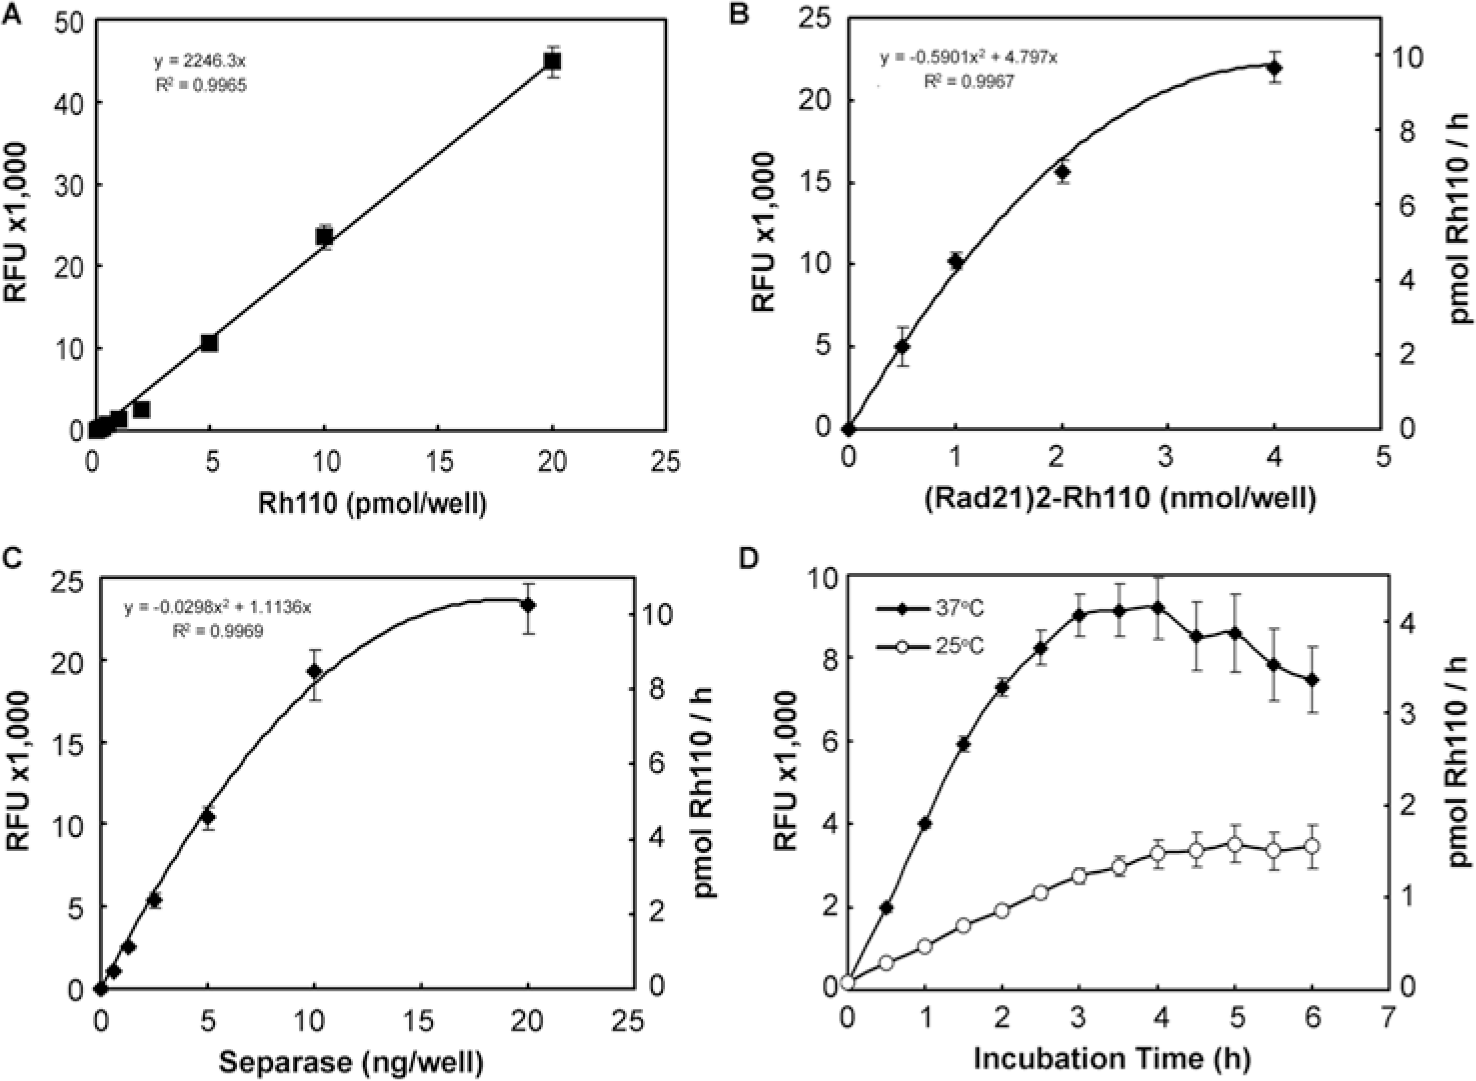
Development of a fluorogenic separase assay using (Rad21)2–rhodamine 110 (Rh110) as a substrate. (A) Rh110 standard curve. The fluorescence intensity expressed by the relative fluorescent units (RFUs) is linearly proportional to the amount of Rh110, which can be used to determine the amount of Rh110 formation in a separase assay. (B) The amount of free Rh110 released from (Rad21)2–Rh110 is a function of the substrate concentration. The amount of separase used in this experiment was 5 ng/well. (C) The amount of free Rh110 released from (Rad21)2–Rh110 was correlated to the amount of separase enzyme concentration. The amount of Rh110 used in this experiment was 1 nmol/well. pmol Rh110/h on the second y-axis in (B) and (C) was calculated using the standard curve shown in (A). (D) Optimization of incubation time for the fluorogenic separase assay. After separase and (Rad21)2–Rh110 were mixed, the reaction mixtures were incubated at 25°C or 37°C. The fluorescence intensity was determined every 30 min. Bar = mean of three samples ± standard deviation (SD).
Kinetics of Hydrolysis of (Rad21)2–Rh110 by Separase
To investigate the kinetics of (Rad21)2–Rh110 cleavage by separase, we incubated increasing concentrations of the substrate with 5 ng of separase for 3 h at 37°C. Plotting the rate of (Rad21)2–Rh110 cleavage by separase as determined by the formation of Rh110 versus the substrate concentration could be fit to the classic Michaelis–Menten hyperbola. The rate of Rh110 production at a lower concentration of the substrate was proportional to the concentration of substrate, whereas that at a higher concentration of substrate was approaching saturation ( Fig. 2A ). The Vmax (4.37 pmol Rh110/h, or 201 pmol Rh110/h/pmol separase) and Km (123 µM) were calculated using a Lineweaver–Burk plot ( Fig. 2B ).
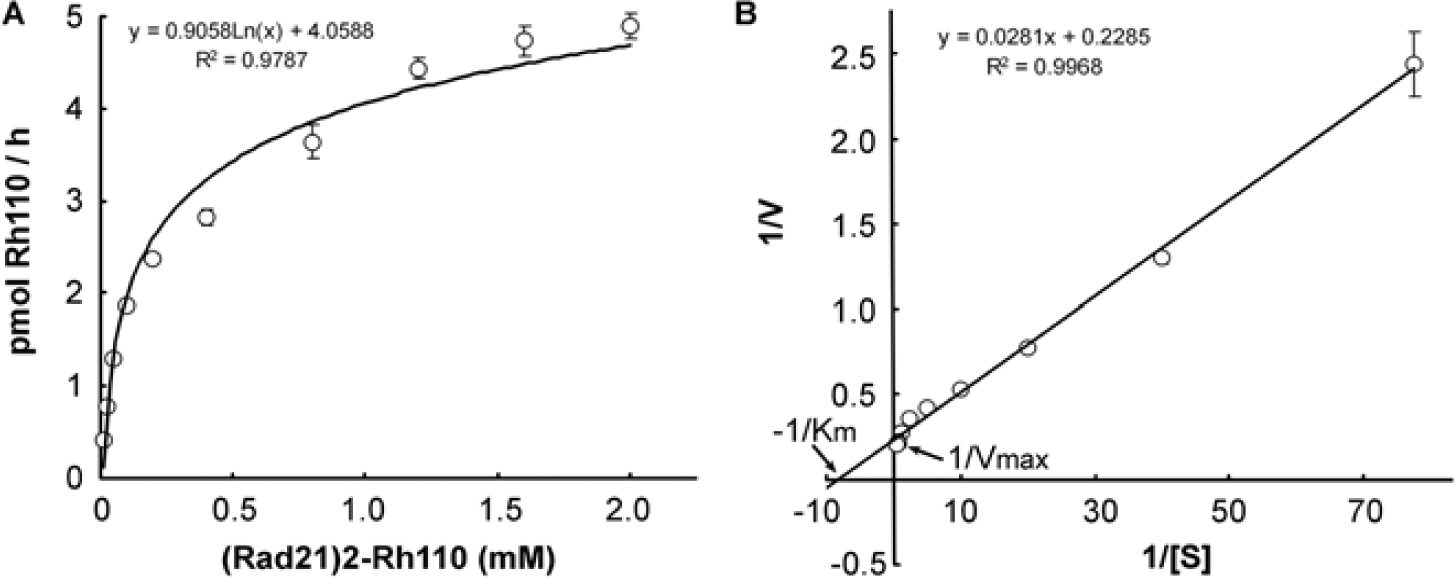
Kinetics of separase assay. The cleavage reaction was carried out in the presence of the increased concentration (0.015–2 mM) of (Rad21)2–Rh110 and 5 ng of separase. The total reaction volume was 25 µl. The plates were incubated at 37°C for 3 h before the fluorescence intensity was determined. The fluorescence intensity was converted to pmol of Rh110. Michaelis–Menten curves were plotted (A), and Vm and Km were calculated using the Lineweaver–Burt plot (B).
Optimization of the Assay Conditions
The stability of the enzyme and substrate at the working conditions is important because the process of distributing different components in HTS is complicated and time-consuming. To test the stability of the enzyme and substrate, we diluted separase enzyme and (Rad21)2–Rh110 to working concentration, and kept them at 4°C for 8 h. The diluted enzyme and substrate were frozen at −20°C or −80°C or stored at 4°C for 24 h before their activities were determined. The activity of separase at the working concentration had no significant difference when it was kept at 4°C, −20°C, or −80°C for 24 h. However, compared to the freshly prepared separase, the activity of diluted separase was reduced by 20% (
The construct that was used to express separase in 293T cells contains two IgG-binding domains of protein A (Z-domain), followed by four TEV–protease cleavage sequences on the N-terminus of separase (ZZ–TEV4–separase).
23
TEV–protease was used to release the separase from IgG–agarose beads after activation by Xenopus cytostatic factor extract. To eliminate the possibility that TEV interferes with the separase assay by cleaving (Rad21)2–Rh110, we tested the activity of TEV and separase in hydrolyzing (Rad21)2–Rh110 in parallel. The results showed that TEV could not cleave (Rad21)2–Rh110 (
The stock solution of the substrate and small compounds used in HTS was prepared in DMSO. To investigate the effect of DMSO on the separase assay, we tested different concentrations of DMSO in the reaction mixture with final concentrations ranging from 2% to 38%. The assay was not affected by 2–14% of DMSO, but it was inhibited with the increase of DMSO concentration >14%; the IC50 was ~27% (
HTS for Separase Inhibitors
After two successful test runs in the HTS setting, we performed screening for separase inhibitors using the Maybridge HitFinderTM Collection, which contains 14,400 compounds. Each compound was assayed in duplicate on two different plates (Plate A and Plate B). The reproducibility of the two plates could be assessed by plotting the RFU of A plate versus the RFU of B plate (
Fig. 3A
). We analyzed 9 representative duplicated plates with 3456 data points, including 288 positive controls, 288 background controls, and 2880 compound assay samples. They were highly reproducible with R2 = 0.9324 (
Fig. 3A
). Except for a few data points (6 at the upper-left corner and 1 at the middle-right in
Fig. 3B
), the majority of positive controls and all background controls were within the range of mean ± 3σ (
Fig. 3B
). The overall quality of the screening was high and robust with an S:B of 10.54, an S:N of 46.35 and a Z’ factor of 0.55 (
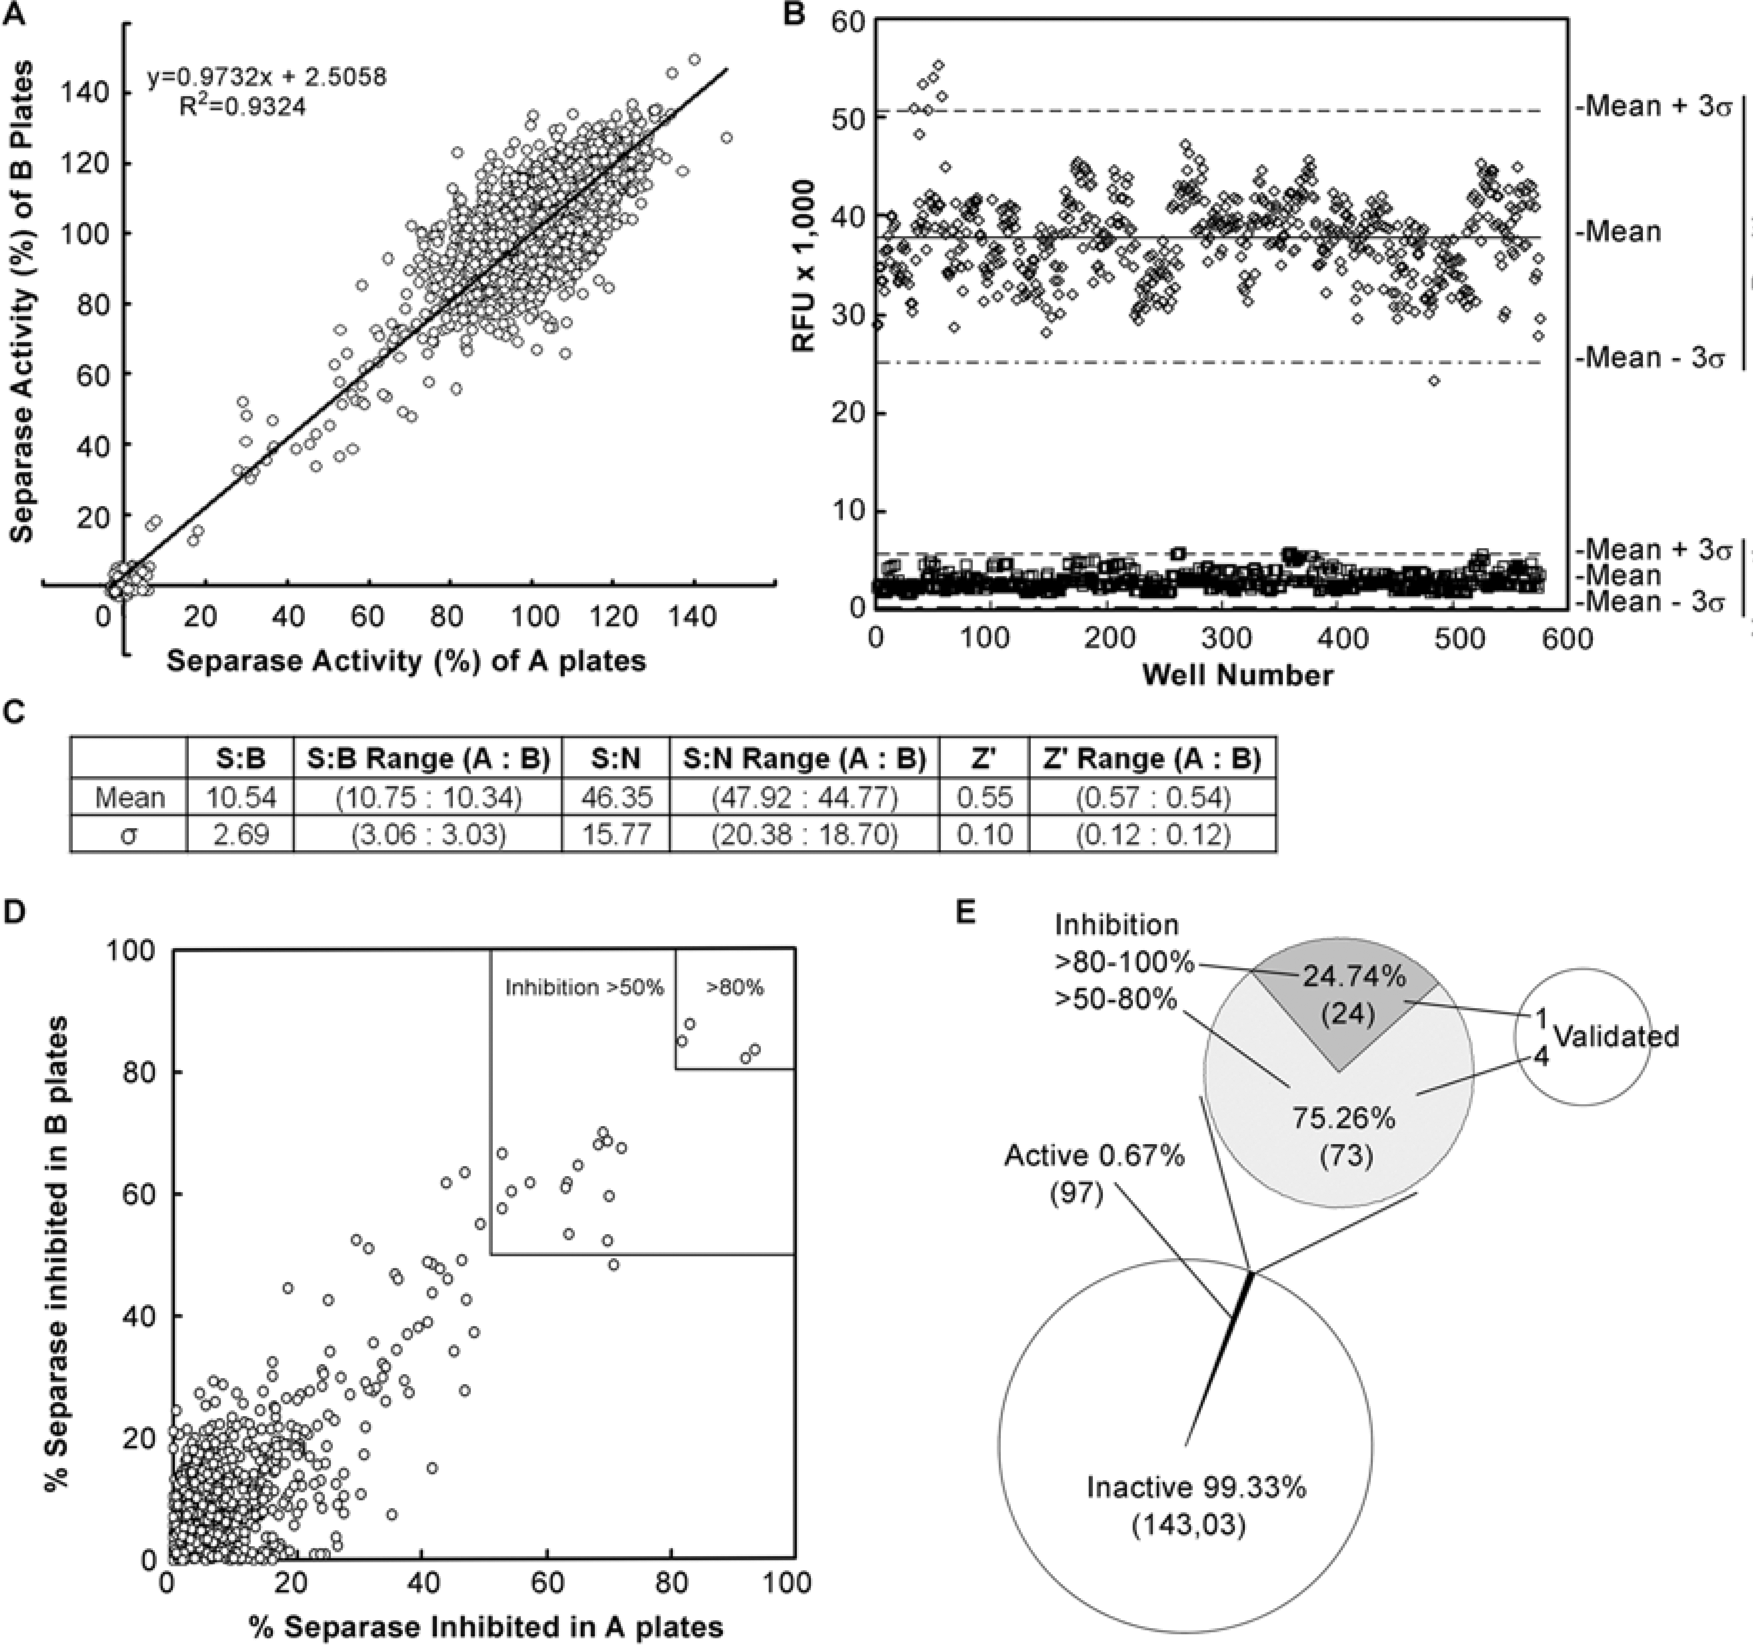
High-throughput screening for separase inhibitors. (A) Reproducibility of the screening. Each data point was repeated in two plates (A and B) and plotted with the separase activity of the A plate as the x-axis and that of the B plate as the y-axis. A total of nine representative duplicated 384-well plates with 3456 data points is shown. (B) The RFU of positive controls is well separated from that of the negative controls. 576 data points of positive controls and negative controls, respectively, from 18 384-well plates are shown. σ is STDEV. (C) Summary of robustness of the HTS. 14,400 compounds in 180 96-well plates were screened using 384-well plates in duplicates (A and B), for a total of 90 384-well plates. The value of the signal-to-background (S:B) ratio, signal-to-noise (S:N) ratio, and Z’ factor is the mean of 90 plates, whereas the value of the S:B range (A:B), S:N range (A:B), and Z’ range (A:B) is the mean of 45 A plates or B plates. (D) Inhibition of separase activity by the test compounds. The test compounds that inhibited at least 50% of separase activity in both A plates and B plates were identified. The data points in the two upper-right boxes showed the compounds that inhibited separase activity >50% and >80%, respectively. (E) Among the 14,400 compounds assayed, 97 are found to inhibit separase activity >50%. The hit rate is 0.67%. 24 out of the 97 compounds inhibit separase activity >80%. Five of the 97 compounds were confirmed.
After the percentage of separase activity inhibited by the test compounds was calculated, those compounds that reduced separase activity by more than 50% on both plate A and B were identified as active compounds ( Fig. 3D ). The majority of the compounds had very little effect on the activity of separase, and these were concentrated in the lower left corner of Figure 3D , whereas a few compounds appeared in the upper-right corner of Figure 3D , inhibiting separase activity at least >50% (bigger square box) or >80% (smaller square box). We have identified 97 compounds that inhibited separase activity more than 50%. Among the 97 compounds, 24 reduced more than 80% of separase activity ( Fig. 3E ). We ordered all of these 97 compounds and verified the activities of these compounds in inhibiting separase enzymatic activity. Five of them were confirmed, which were named separase inhibitors (Sepin-1 to -5). Among them, Sepin-1 had the highest activity, which is further discussed in the “Characterization of Sepin-1 in Inhibiting Separase Activity” section.
Characterization of Sepin-1 in Inhibiting Separase Activity
Sepin-1 is 2,2-dimethyl-5-nitro-2H-benzimidazole-1,3 dioxide with molecular weight 223 Da and a melting point of 228°C ( Fig. 4A ). 13C NMR was used to confirm the identity of Sepin-1 before we used it for further experimentation. Sepin-1 could inhibit the Rad21 cleavage by activated separase in vitro when in vitro transcribed and translated Rad21 was used as the substrate ( Fig. 4B ). In the fluorogenic separase activity assay using (Rad21)2–Rh110 as the substrate, the concentration of Sepin-1 to inhibit 50% of separase activity (IC50) was 14.8 µM ( Fig. 4C ). To examine the kinetics of separase inhibition by Sepin-1, different amounts of Sepin-1 compound were used to inhibit the cleavage of (Rad21)2–Rh110 by separase. The data showed that Sepin-1 did not affect the Km but reduced the Vmax ( Fig. 4D ), suggesting the binding site of Sepin-1 on separase is different from that of the substrate. To further confirm the specificity of Sepin-1 binding to separase, 0.1% Tween-20 or 1% bovine serum albumin (BSA) was included in the reaction mixture. The results indicated that Tween-20 and BSA did not affect the kinetics of Sepin-1 in inhibiting separase activity (data not shown). Based on this result, we conclude that Sepin-1 is not a promiscuous inhibitor and that its binding to separase is specific and noncompetitive.
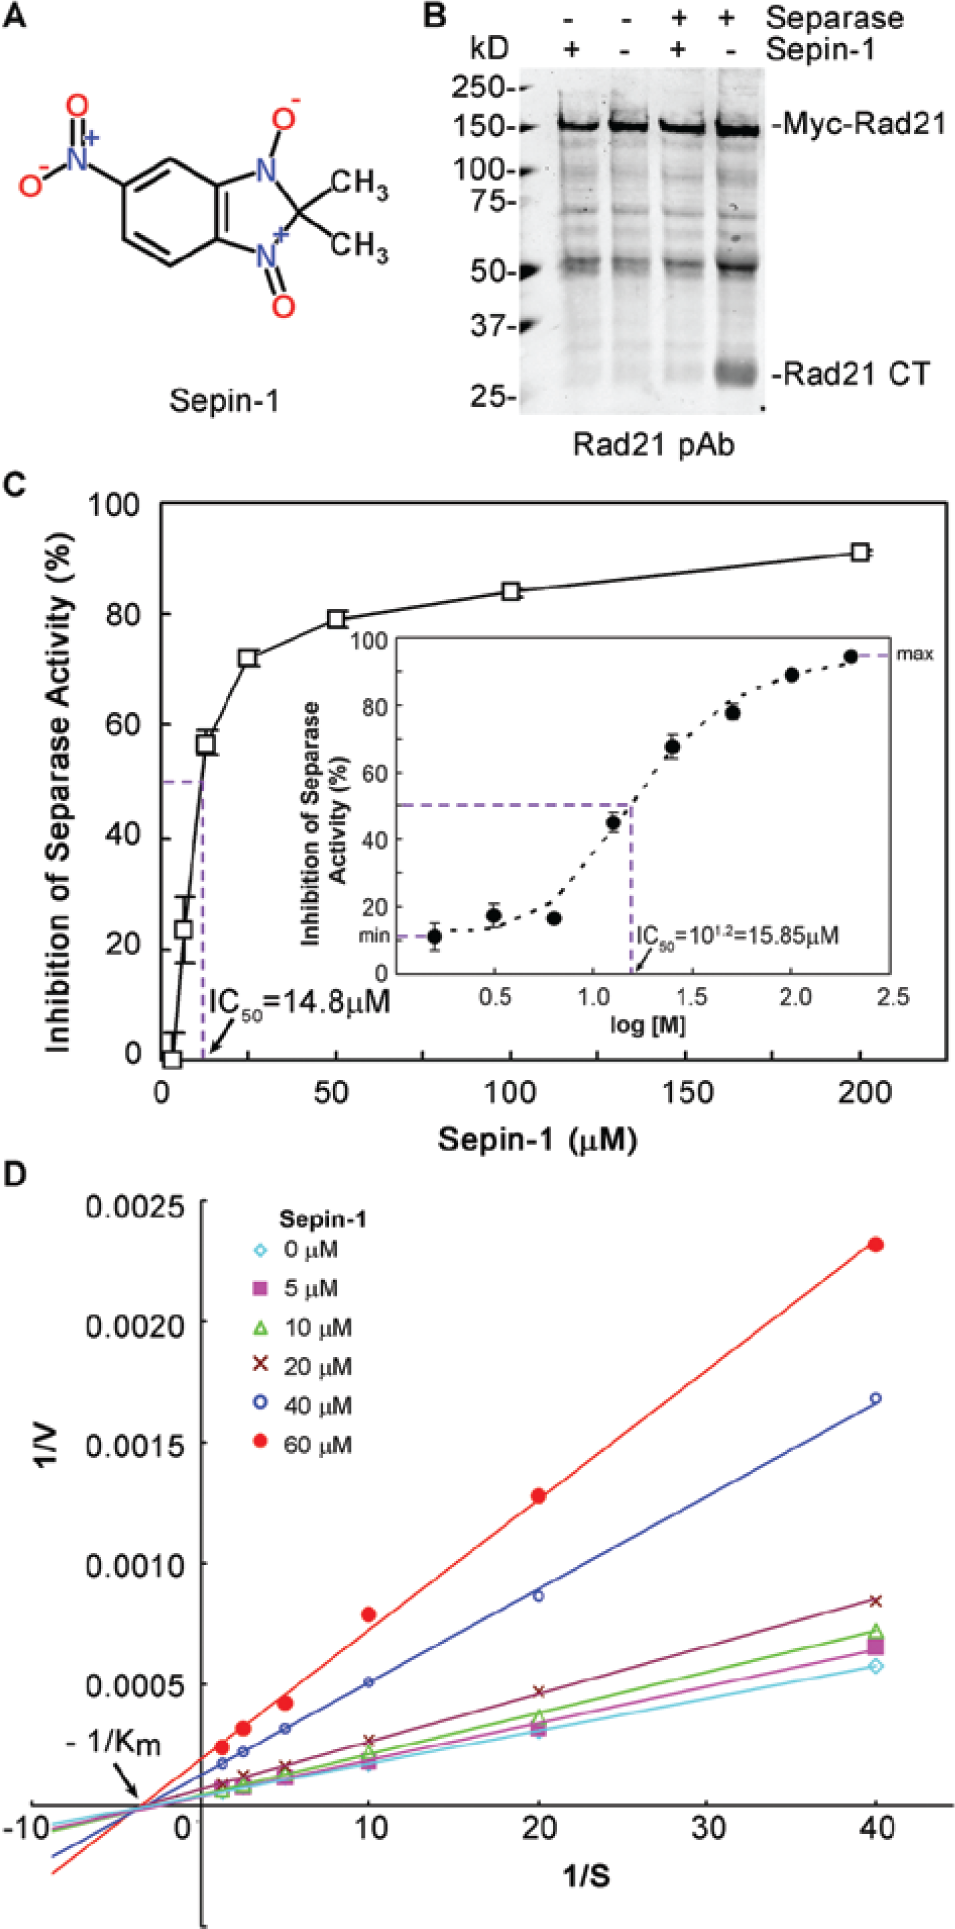
Characterization of Sepin-1 in inhibiting separase activity. (A) Structure of Sepin-1. (B) Sepin-1 inhibits the cleavage of separase substrate Rad21. The in vitro transcribed and translated Myc–Rad21 was used as the substrate for activated separase in the presence of or without Sepin-1. The final concentration of Sepin-1 in the reaction mixture was 50 µM. (C) Inhibition of separase activity by Sepin-1. The half maximal inhibitory concentration (IC50) was 14.8 µM, calculated using the KaleidaGraph program. Inset shows four-parameter dose–response curve fit and estimated IC50 of 15.8 µM (n = 3 ± standard error). (D) Noncompetitive inhibition of separase enzymatic activity by Sepin-1. The data were shown in a Lineweaver–Burt plot. Sepin-1 reduced the speed (Vmax) of substrate conversion by separase, but not the Km.
In yeast, separase has at least two sites interacting with Rad21. 26 One is the catalytic site, and the other is outside the catalytic site. Although blocking the catalytic site does not affect Rad21 binding to separase, it is unclear whether Rad21 binding to the domain outside the catalytic site has any effect on its cleavage by separase. Noncompetitive inhibition of separase by Sepin-1 suggests that Sepin-1 might bind to a third place on separase, which is different from the two sites that Rad21 protein binds because Sepin-1 can inhibit separase to cleave the peptide substrate (Rad21)2–Rh110, which is small and might bind only to the catalytic site of separase.
Toxicity of Sepin-1 in Mice
To investigate the toxicity in mice, we injected Sepin-1 at a single dose in the range of 50–100 mg/kg body weight into C57B6 mice via the tail vein. Although the mice at the highest dose of 90 mg/kg died within 30–90 min of injection, the mice injected with a dose of <80 mg/kg had no apparent effect, and they have now survived for more than 6 months. Blood analysis suggested that the mice receiving 90 mg/kg of Sepin-1 had high creatine kinase and lactate dehydrogenase (LDH) (>500 IU), suggesting muscle damage in these animals. However, the heart muscle did not show light-microscopic evidence of morphologic damage, and the skeletal muscle had no apparent damage, either. Histopathological examination indicated no significant lesions in major organs, including the heart, lungs, liver, kidney, eye, gall bladder, pancreas, spleen, brain, adrenal gland, cervical lymph nodes, salivary gland, stomach, small intestine, skeletal muscles, bone marrow, and ear. There was no apparent distressing effect on the mice in clinical observation when the dose was 70 mg/ml or lower. Based on these results, we expanded this study to identify the severely toxic dose (STD; i.e., the dose that causes death or irreversible severe toxicity in 10% of rodents is STD10) 27 using more mice injected with 75 to 90 mg/kg. A dose of 80 mg/kg was estimated as STD10 for Sepin-1 in these mice. When Sepin-1 was introduced to a cohort of 12 mice with a dose of 10 mg/kg via intraperitoneal injection (IP) daily for 6 weeks, no weight loss or apparent adverse effect on the well-being of the mice was observed.
Sepin-1 Inhibits the Growth of Cancer Cells
To test the inhibitory effect of Sepin-1 on the growth of human cancer cells, we have used the MTT assay to determine the cell viability after Sepin-1 treatment. A variety of human cancer cell lines, including leukemia, breast cancer, and neuroblastoma, have been tested (Fig. 5A–C). Different cell lines have different sensitivities to Sepin-1 in inhibiting cell growth. The IC50 of Sepin-1 ranges from 1.0 µM to over 60 µM (Fig. 5A–C).
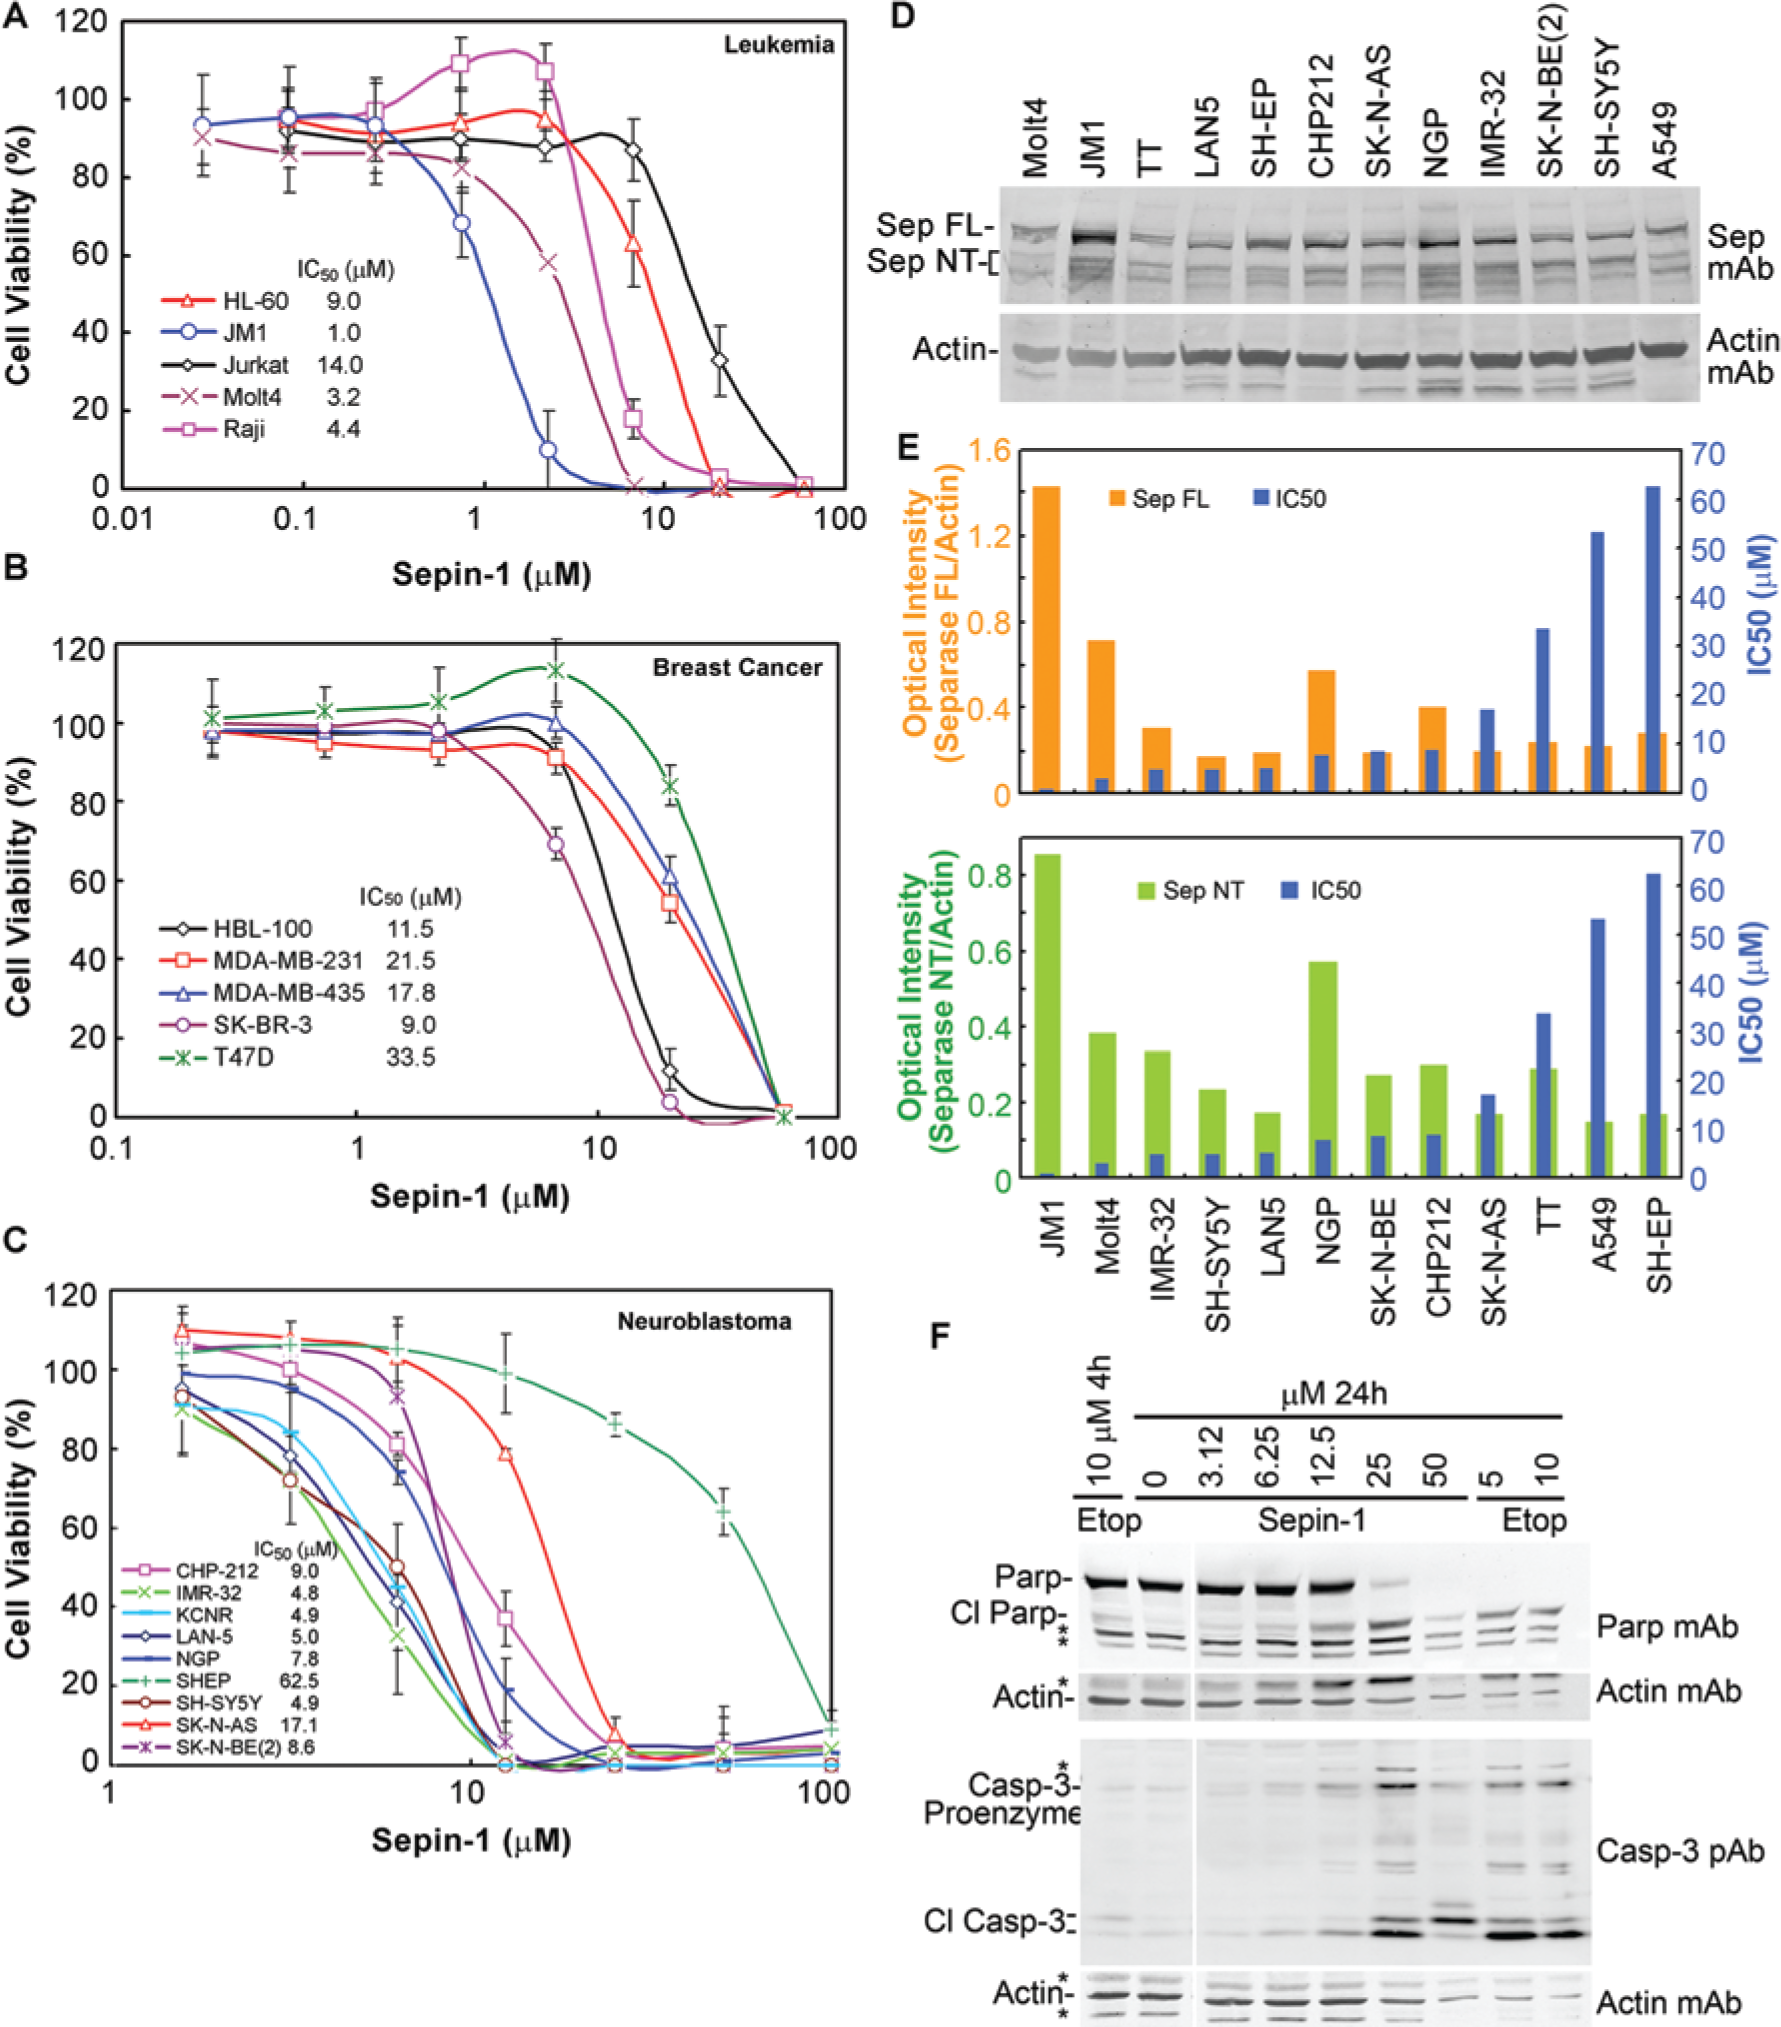
Sepin-1 inhibits cancer cell growth and induces apoptosis. (A–C) Sepin-1 inhibits the cell growth of leukemia cell lines (A), breast cancer cell lines (B), and neuroblastoma cell lines (C). Cells were treated with serially diluted Sepin-1 for 72 h. The cell viability was assessed using the MTT assay. (D) Western blot of full-length (FL) and N-terminal (NT; surrogate for the active protein) separase in cancer cell lines. (E) Relationship showing a positive correlation between the separase protein level and sensitivity to Sepin-1 in inhibiting cell growth (IC50). The separase bands from (D) were quantified and normalized with beta actin. (F) Immunoblotting shown Sepin-1-induced activation of caspase-3 and cleavage of poly (adenosine diphosphate [ADP]–ribose) polymerase (Parp). Molt4 cells were treated with various concentrations of Sepin-1 for 24 h. Etoposide (Etop) was used as control. Cl Parp, cleaved Parp; Cl Casp-3, cleaved caspase-3. *Indicates nonspecific bands.
To define the relationship of separase level and its sensitivity to Sepin-1 in cell lines, we investigated the separase protein level in 14 cancer cell lines (two leukemia, eight neuroblastoma, one thyroid, one lung cancer, and two breast cancer) with Western blot (
Figs. 5D
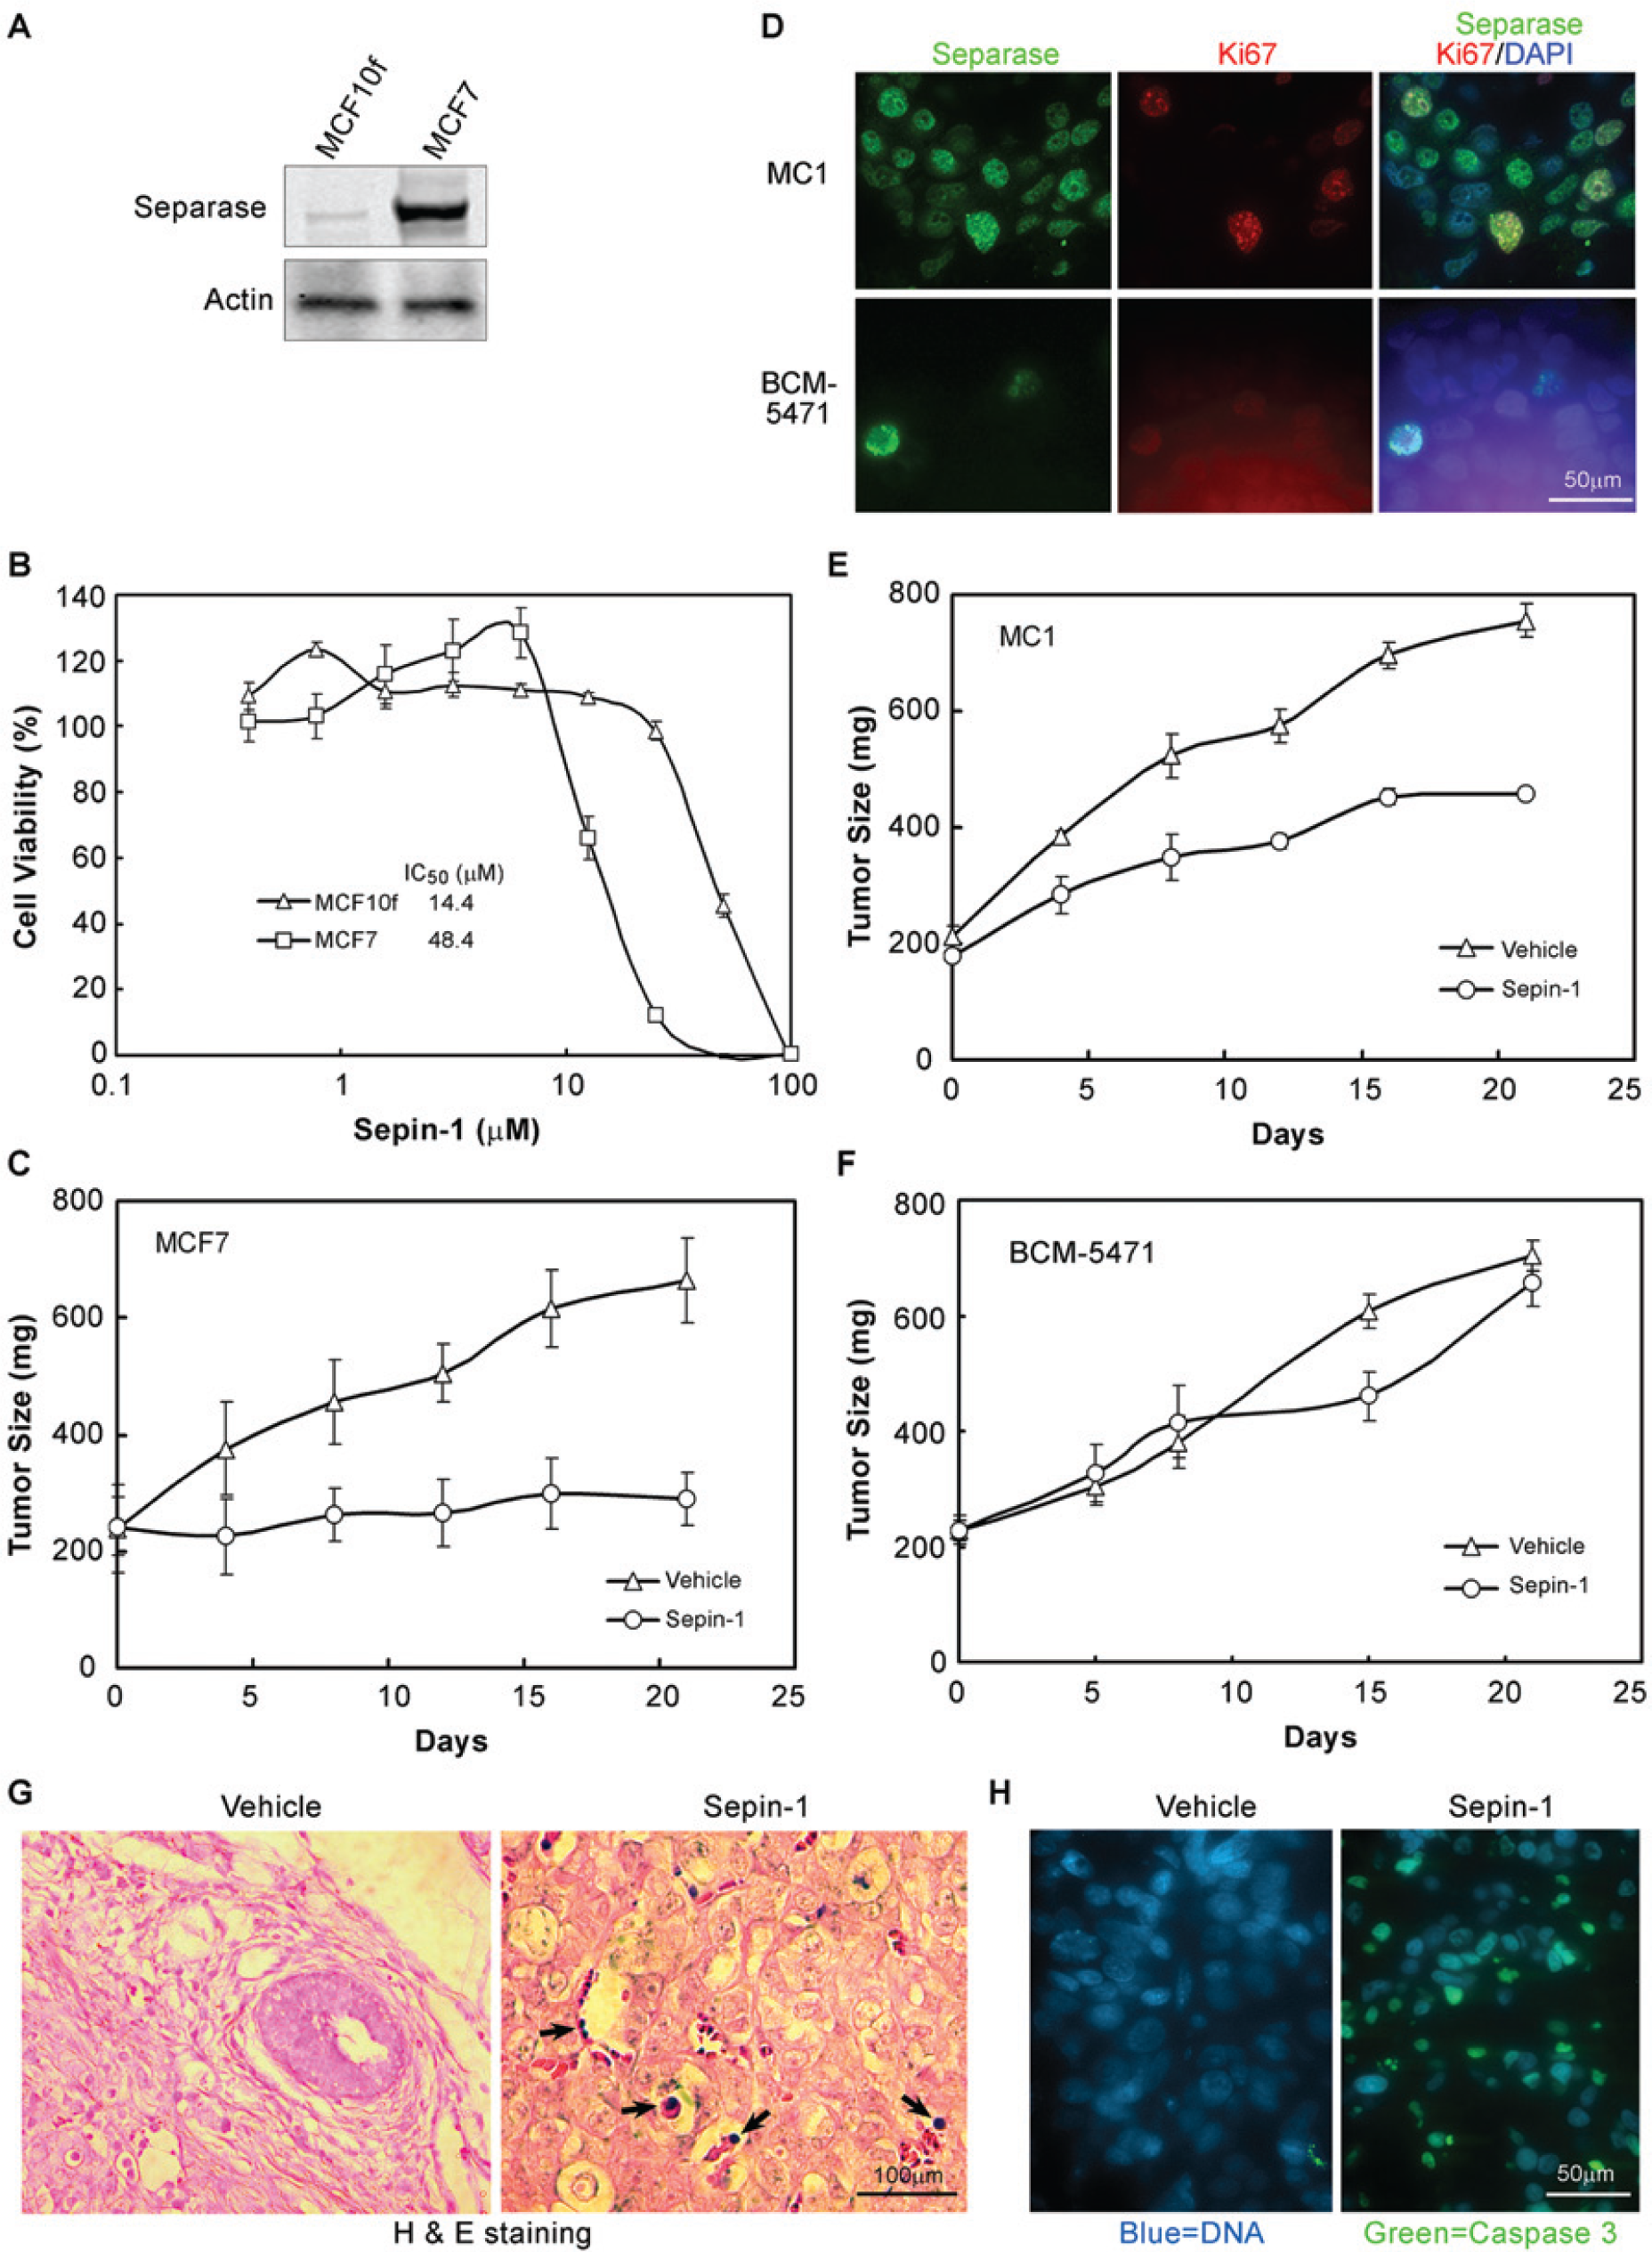
Sepin-1 selectively inhibits the growth of xenograft breast tumors with a high separase level. (A) Immunoblotting shows the separase protein in breast cancer cell lines, MCF7 and MCF10f. (B) The MTT assay shows MCF7 is more sensitive to Sepin-1 in inhibiting cell growth than MCF10f ex vivo. (C) Sepin-1 inhibits the growth of xenograft tumors derived from MCF7 in SCID beige mice. (D) Immunostaining of separase in triple-negative breast cancer tumor xenografts MC1 and BCM-5471. Tumor sections were stained with separase monoclonal antibody (mAb) (green) and Ki67 polyclonal antibody (pAb) (red). DNA was stained with 4’,6-diamidino-2-phenylindole (blue). (E–F) Sepin-1 inhibits the growth of xenograft tumors derived from breast cancer tumors in SCID beige mice. BCM-5471 xenograft tumors are more sensitive to Sepin-1 than MC-1 tumors. The xenograft tumors’ weight was assessed during a 3-week period of Sepin-1 or vehicle treatment in SCID beige mice at a dose of 10 mg/kg daily via intraperitoneal injection for 5 days a week (N = 5/group). (G–H) Sepin-1-treated MCF7 xenograft tumors show a high level of apoptosis. Tumor sections from MCF7 xenografts treated with Sepin-1 or vehicle were stained with hematoxylin and eosin (H&E) (G) or immunostained with cleaved caspase-3 mAb (H). Apoptotic bodies in H&E staining (black arrows) and immunostaining (green) were observed in Sepin-1-treated tumors.
To determine the mechanism of cell growth inhibition induced by Sepin-1, we performed immunoblotting to investigate if apoptosis is induced after Molt4 cells were treated with Sepin-1. Activation of caspase-3 and cleavage of Parp-1 are two commonly used parameters in the determination of apoptosis. We used etoposide as a positive control; this is a well-known chemotherapy agent that induces DNA damage by interacting with topoisomerase II. 28 Western blot data indicated that the caspase-3 pro-enzyme was induced and activated by the formation of cleaved caspase-3 with the increase of Sepin-1 concentration. Apoptosis induction following Sepin-1 treatment was also supported by Parp-1 cleavage ( Fig. 5F ). The effect of Sepin-1 on the activation of caspase-3 and degradation of Parp-1 is similar to that of etoposide ( Fig. 5F ). Parp-1, a chromatin-associated enzyme, catalyzes the poly ADP-ribosylation of proteins that are involved in chromatin architecture, DNA damage repair, and DNA metabolism. Parp-1 plays an important role in mediating the normal cellular response to DNA damage in nonapoptotic cells. However, it is cleaved by caspases in apoptotic cells, which is a marker of apoptosis.
Sepin-1 Inhibits the Growth of Human Tumor Xenografts in Mice
Based on the in vitro data shown in this article, we reasoned that the Sepin-1 effect in inhibiting tumor growth in vivo is also dependent on the level of separase (i.e., the higher the separase level, the greater the inhibition, and vice versa). To test this hypothesis, we selected two human breast cell lines (MCF7 and MCF10f) and two mammary tumors (MC1 and BCM-5471) that have differential levels of separase protein ( Fig. 6 ). The breast epithelial cell line MCF10f is not tumorigenic and has a lower separase level compared to the isogenic MCF7 line ( Fig. 6A ). When treated with Sepin-1, MCF7 cells were more than 3.3 times more sensitive than MCF10f cells ( Fig. 6B ). The sensitivity of MCF7 cells to Sepin-1 treatment was also further verified by the growth of xenograft tumors derived from MCF7 cells in mice ( Fig. 6C ).
We also investigated Sepin-1 activity against patient-derived xenografts from two triple-negative (ER− PR− HER2−) breast tumors (MC1 and BCM-5471). Compared to the BCM-5471 tumor, separase is overexpressed in the MC1 tumor ( Fig. 6D ). Although separase is primarily found in the mitotic cells of the BCM-5471 tumor, it was found in the majority of noncycling (Ki67 staining negative) cells in the MC1 tumor ( Fig. 6D ), as we have previously described. 4 Once the tumor’s size reached ~200 mg, mice were treated with Sepin-1 at a dose of 10 mg/kg by IP injection every day for 3 weeks. Compared to vehicle control, Sepin-1 treatment inhibited the growth of xenograft MC1 tumors by 70% during the 3-week treatment ( Fig. 6E ). However, there was no significant difference in growth between vehicle control and Sepin-1 treatment in xenograft BCM-5471 ( Fig. 6F ), possibly due to the low separase level, which causes less sensitivity to Sepin-1. Similar to the leukemia cell line Molt4, Sepin-1-treated MFC7 xenograft tumors showed an increase of apoptotic bodies in hematoxylin-and-eosin-stained sections ( Fig. 6G ), which is consistent with the finding that cleaved caspase-3 staining was significantly increased ( Fig. 6H ). Collectively, these data suggest that Sepin-1 inhibits tumor cell growth by the induction of apoptosis through selective inhibition of separase.
In the absence of any crystal structural information, it is difficult to develop inhibitors against the separase enzymatic active site using a rational drug-design approach. HTS is an alternate approach that can be used to find potential separase inhibitors. Separase is an ideal drug target, and pharmacologic inhibition of separase enzyme is a novel strategy to treat separase-overexpressed aneuploid tumors because (1) although homozygous deletion of separase is embryonically lethal, mice with separase haploinsufficiency live a normal life with no disease phenotype compared to the wild-type animal, 29 indicating that a reduction in separase level has no adverse effect on an organism’s well-being; (2) separase, a promoter of aneuploidy, is a highly specific protease that is overexpressed in a large percentage (>60%) of human breast tumors, 5 as well as in prostate tumors and osteosarcoma, 4 suggesting that attenuation of separase level pharmacologically in human cancers may kill separase-addicted aneuploid cells; and (3) separase is not only overexpressed but also constitutively mislocalized to the nucleus of the human tumors, 4 providing an opportunity to target the nuclear bound separase. Therefore, titrating down separase level therapeutically may not only inhibit tumor cell proliferation, but also effectively reverse the aneuploid phenotype in separase-overexpressed tumor cells while sparing the normal cells. Furthermore, separase mislocalization to the nucleus will facilitate its targeting in the aneuploid tumor cells. We also reason that cells with knockdown nuclear separase will initiate mitotic arrest and apoptosis, and may therefore be more sensitive to traditional chemotherapy. Until now, there are no inhibitors for separase, and the hits identified in this study will be crucial in laying a foundation for further research in developing a druggable compound to target separase-overexpressed tumors.
Footnotes
Acknowledgements
We thank Hui Zou (University of Texas Southwestern Medical Center at Dallas), who kindly provided the ZZ–TEV4–separase construct and technical support for Xenopus cytostatic factor extraction, and Peter E. Zage (Baylor College of Medicine), who provided neuroblastoma and thyroid cell lines.
Declaration of Conflicting Interests
The authors declared no potential conflicts of interest with respect to the research, authorship, and/or publication of this article.
Funding
The authors disclosed receipt of the following financial support for the research, authorship, and/or publication of this article: This study was supported by the 2008 Virginia and L.E. Simmons Family Foundation Collaborative research award and the Alkek Award for Pilot Projects in Experimental Therapeutics to D. Pati, and the 2010 Bear Necessities Pediatric Cancer Foundation and Rally Foundation for Childhood Cancer Research award to N. Zhang.
References
Supplementary Material
Please find the following supplemental material available below.
For Open Access articles published under a Creative Commons License, all supplemental material carries the same license as the article it is associated with.
For non-Open Access articles published, all supplemental material carries a non-exclusive license, and permission requests for re-use of supplemental material or any part of supplemental material shall be sent directly to the copyright owner as specified in the copyright notice associated with the article.