
Abstract
Systematic error is present in all high-throughput screens, lowering measurement accuracy. Because screening occurs at the early stages of research projects, measurement inaccuracy leads to following up inactive features and failing to follow up active features. Current normalization methods take advantage of the fact that most primary-screen features (e.g., compounds) within each plate are inactive, which permits robust estimates of row and column systematic-error effects. Screens that contain a majority of potentially active features pose a more difficult challenge because even the most robust normalization methods will remove at least some of the biological signal. Control plates that contain the same feature in all wells can provide a solution to this problem by providing well-by-well estimates of systematic error, which can then be removed from the treatment plates. We introduce the robust control-plate regression (CPR) method, which uses this approach. CPR’s performance is compared to a high-performing primary-screen normalization method in four experiments. These data were also perturbed to simulate screens with large numbers of active features to further assess CPR’s performance. CPR performs almost as well as the best performing normalization methods with primary screens and outperforms the Z-score and equivalent methods with screens containing a large proportion of active features.
Keywords
Introduction
Systematic error is present in all high-throughput screens to varying degrees, lowering measurement accuracy. Because screening occurs at the early stages of research projects, whether they are for drug development or for advancing understanding of fundamental biology, measurement inaccuracy leads to following up inactive features (false positives) and failing to follow up active features (false negatives). There are three partially independent manifestations of systematic error within individual screens: plate-specific bias, within-plate bias, and across plate well-location bias. Only plate-specific bias is addressed by commonly used normalization methods such as Z-scores or methods which use internal controls (e.g., percentage inhibition or activation, percentage of control, and plate-median normalization). More recent methods have been developed that simultaneously address all three types of bias1–5 with additional performance improvements provided by randomized study designs. 4
Current normalization methods take advantage of the fact that most primary-screen features (e.g., compounds and small interfering RNAs [siRNAs]) within each plate are inactive, which permits using robust estimates of row and column effects to remove systematic error. Screens for which a majority of features are potentially active (e.g., follow-up screens that are used to validate hits obtained from primary screens) pose a more difficult challenge for removing systematic error because even the most robust normalization methods designed for primary screens will remove at least some of the biological signal. This difficulty underlies part of the motivation for the ChemBank database’s dimensionless Z-score normalization, which uses mock-treatment wells to obtain normalization parameters. 6
Control plates that contain the same feature in all wells can provide a solution to this problem by providing well-by-well estimates of systematic error, which can then be removed from the treatment plates containing the measurements of interest. Control plates may contain a negative control (e.g., they lack the biologically active material of interest but are otherwise identical to the treatment wells) or a positive control at the same concentration for all wells. Bias correction is accomplished by regressing measurements of interest on the control-plate measurements paired by well location. This analysis-of-partial-variance approach has been used successfully to remove unwanted effects of day-to-day assay variability in clinical settings 7 and to correct for cytosolic messenger RNA (mRNA) levels in estimates of differential levels of actively translated mRNAs or protected mRNA pieces.8,9
Because high-throughput screens involve nonstationary processes that cause measurements to drift among various factors (e.g., equipment, technician, and local microenvironment factors), control plates must be run in such a way as to maximize their correlation with treatment plates. For example, they should ideally be run close in time by the same technician using the same equipment. If this is not possible, then a randomized block design can be adopted in which measurements are grouped proportionally by the uncontrolled biasing factors.10,11 Also, depending on the variability of the systematic error, averaging the bias estimates among replicate control plates will typically be necessary for improving accuracy and precision. Finally, robust statistical procedures should be used to minimize the adverse effects of high-leverage data values, which have undue influence on the statistical correction parameters. We introduce a robust regression method (control-plate regression, or CPR) and compare its performance to a high-performing primary-screen normalization method. We also compare CPR to Z-score normalization to simulate follow-up screens with a high proportion of active features.
Data Sets
Four primary-screen sets were used to evaluate CPR’s performance. Baseline performance was obtained by comparing CPR to other primary-screen normalization methods. The primary-screening data were also perturbed to simulate screens with 70% active features.
Inglese et al.
The Inglese et al. 12 quantitative HTS assay screened the 1280 compounds of the Prestwick library for pyruvate kinase activity at 14 concentration levels (0.73174 × 10⁻³ M, 0.163617 × 10⁻² M, 0.365848 × 10⁻² M, 0.818036 × 10⁻² M, 0.1829127 × 10⁻¹ M, 0.4089929 × 10⁻¹ M, 0.9145081 × 10⁻¹ M, 0.20448401 M, 0.45722625 M, 1.0223579 M, 2.28599225 M, 5.1147868 M, 11.42926633 M, and 25.55583951 M) with three replicate plates at each concentration. Ninety-eight compounds were defined as active based on their dose–response curves. The three replicate plates at the lowest concentration showed no compound activity and were used as control plates for implementing CPR normalization.
Equipe Criblage pour des Molécules Bio-Actives (CMBA)
Five hundred and sixty compounds (40 active and 520 inactive) were deposited on seven 96-well plates and were run against an immunofluorescence HTS cell-based assay, which probes for microtubule depolymerization agents. Compounds were randomly assigned to plates and individual wells in one of two designs. In the confounded design, the same randomly assigned well locations were used for each of four replicate plates. In the randomized design, random assignment of compounds to well locations was done independently for each of the four replicate plates. The screening of the 56 compound microplates was divided into 8 daily runs; for each run, 7 different compound microplates were screened, so that the 560 different test compounds were screened once during each of the 8 daily runs. Compounds were deposited in the middle 10 columns, with controls deposited in the first and last columns. Four dimethyl sulfoxide (DMSO) control plates were included in each daily run (see
ChemBank Anthrax Screen
Ten 384-well microplates (320 compounds per plate) were run in duplicate to screen for inhibitors of the anthrax lethal toxin; two DMSO control plates were also run (Erik Hett, personal communication to C. M., Feb 19, 2013). The data are available from ChemBank (see http://chembank.broadinstitute.org/welcome.htm; under Advanced Assay Search, use the Project category to search for AnthraxLethalFactorInhibtion; from the results, select CellTiterGlo(1135.0001)).
siRNA Screen
Carralot et al. screened 21,121 siRNA targets on 68 384-well microplates run in duplicate to study interactions between human cells and the human immunodeficiency virus (HIV). 13 Two sets of five control plates were screened with a one-day interval prior to the screen proper.
Perturbed Simulated Data (70% Active Features)
Follow-up screen data were generated by perturbing the primary-screen data in a manner that preserved the empirical random error among replicates, ensuring that the simulated data were as realistic as possible.
Data were first rescaled so that each plate median equaled zero (i.e., the plate median was subtracted from all raw values from its respective plate).
The median absolute deviation (MAD) of the raw data was calculated for each plate. The median of the MADs for each screen was used as the scaling factor in perturbing the data.
A subset of inactive features was selected randomly for perturbation to produce 70% active features on each plate (perturbed data + features that were active as determined in the original screens). This resulted in 896/1280 active features for the Inglese et al. second concentration data (all original features considered inactive), 390/560 active features for the CMBA experiments, 2240/3200 active features for the ChemBank Anthrax screen, and 15,232/21,760 active features for the siRNA screen.
A single value ranging from 0.5 to 1.5 times the scaling factor (to simulate small to moderate effect sizes) was added to each replicate of each feature selected for perturbation. This had the advantage of preserving feature variability among replicates observed in the primary-screen data. Effects ranging from 0.5 through 1.5 were added to randomly selected features in 1/(number of perturbed features) increments to produce equal proportions of each effect size.
Steps 1 to 4 were repeated 1000 times for each assay with a different set of chosen features (Step 3) for each iteration.
Methods
Z-Score
The Z-score is a statistical method that normalizes for additive and multiplicative effects across plates:

where xi is the signal intensity of the ith compound, and μ p and σ p are the mean and standard deviation, respectively, of the raw well intensities per plate excluding controls.
Spatial Polish and Well Normalization (SPAWN) and the Spatial-Bias Template
SPAWN fits data from each well location on each plate according to the following model:
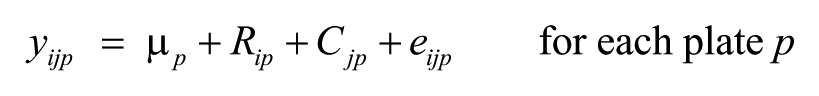
where yijp is the well value for the ith row and jth column of the pth plate, μ p is the grand mean of the pth plate, Rip is the ith row effect, Cjp is the jth column effect, and eijp are the residuals after removing the grand mean, row, and column effects.
Model parameters are estimated with an iterative polish technique as with the B-score 1 but with a trimmed mean, rather than a median, as a measure of central tendency for the row and column effects. The trimmed-mean approach has been shown to have good robustness 4 and reduces the number of false positives generated by the B-score. 3 The proportion of data trimmed from the tails of the distribution can be set from zero (mean polish) through 0.5 (median polish). In practice, a good robustness–efficiency trade-off is often achieved with a trim of 0.2, which was used in the present study. The eijp residuals are rescaled by dividing by the MAD of their respective plates.
A second optional well-location normalization step was also used. Individual well normalization was performed by shifting the score for each well location by the spatial-bias template estimate, SBTij, which is the median of the scores at the ith row and jth column of all plates. The resulting scores are then rescaled again by dividing by the MAD of each plate.
Control-Plate Regression
CPR normalization fits the following linear equation on a plate-by-plate basis:

where yip is the well intensity for the ith well on the pth feature plate, up is the grand mean of the pth plate, BTi is the well intensity for the ith well on the associated bias template, and εip is the residual after removing the grand mean and bias template effect. The residuals from the model, εip, are rescaled by dividing by the robust scale estimate from the regression function, and they are used as the postnormalized scores.
For the current study, bias templates were generated from sets of negative control plates. The bias-template well intensities are calculated by taking the median of all values at each separate well location.

where BTi is the well intensity for the ith well of the bias template, n is the number of control plates, and from xi1 to xin are the well intensities of the ith well location for n control plates. CPR was implemented with the rlm function from the MASS (Version 7.3-16) package, 14 which uses iterative reweighted least squares with the Huber M-estimator.
Moran’s I Statistic
Moran’s I statistic is a multidirectional measurement of correlation between signals that are located in proximity to one another. 15 It gives a single global estimate of spatial correlation an entire plate. Moran’s I is an extension of the Pearson’s product–moment correlation and is interpreted in a similar manner: A Moran’s I value close to 0 indicates little or no spatial correlation, and scores close to ± 1 indicate high levels of spatial correlation. The formula is defined as follows:
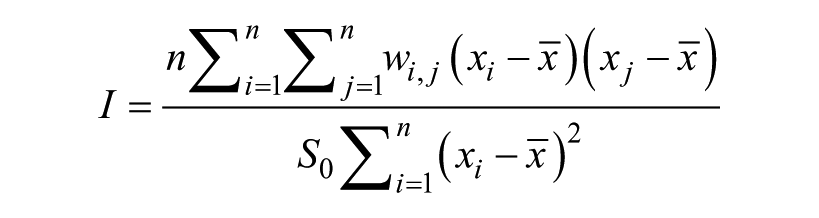
where n is the number of features on a plate; xi and xj are the ith and jth feature, respectively;
Results
Systematic Error (Bias)
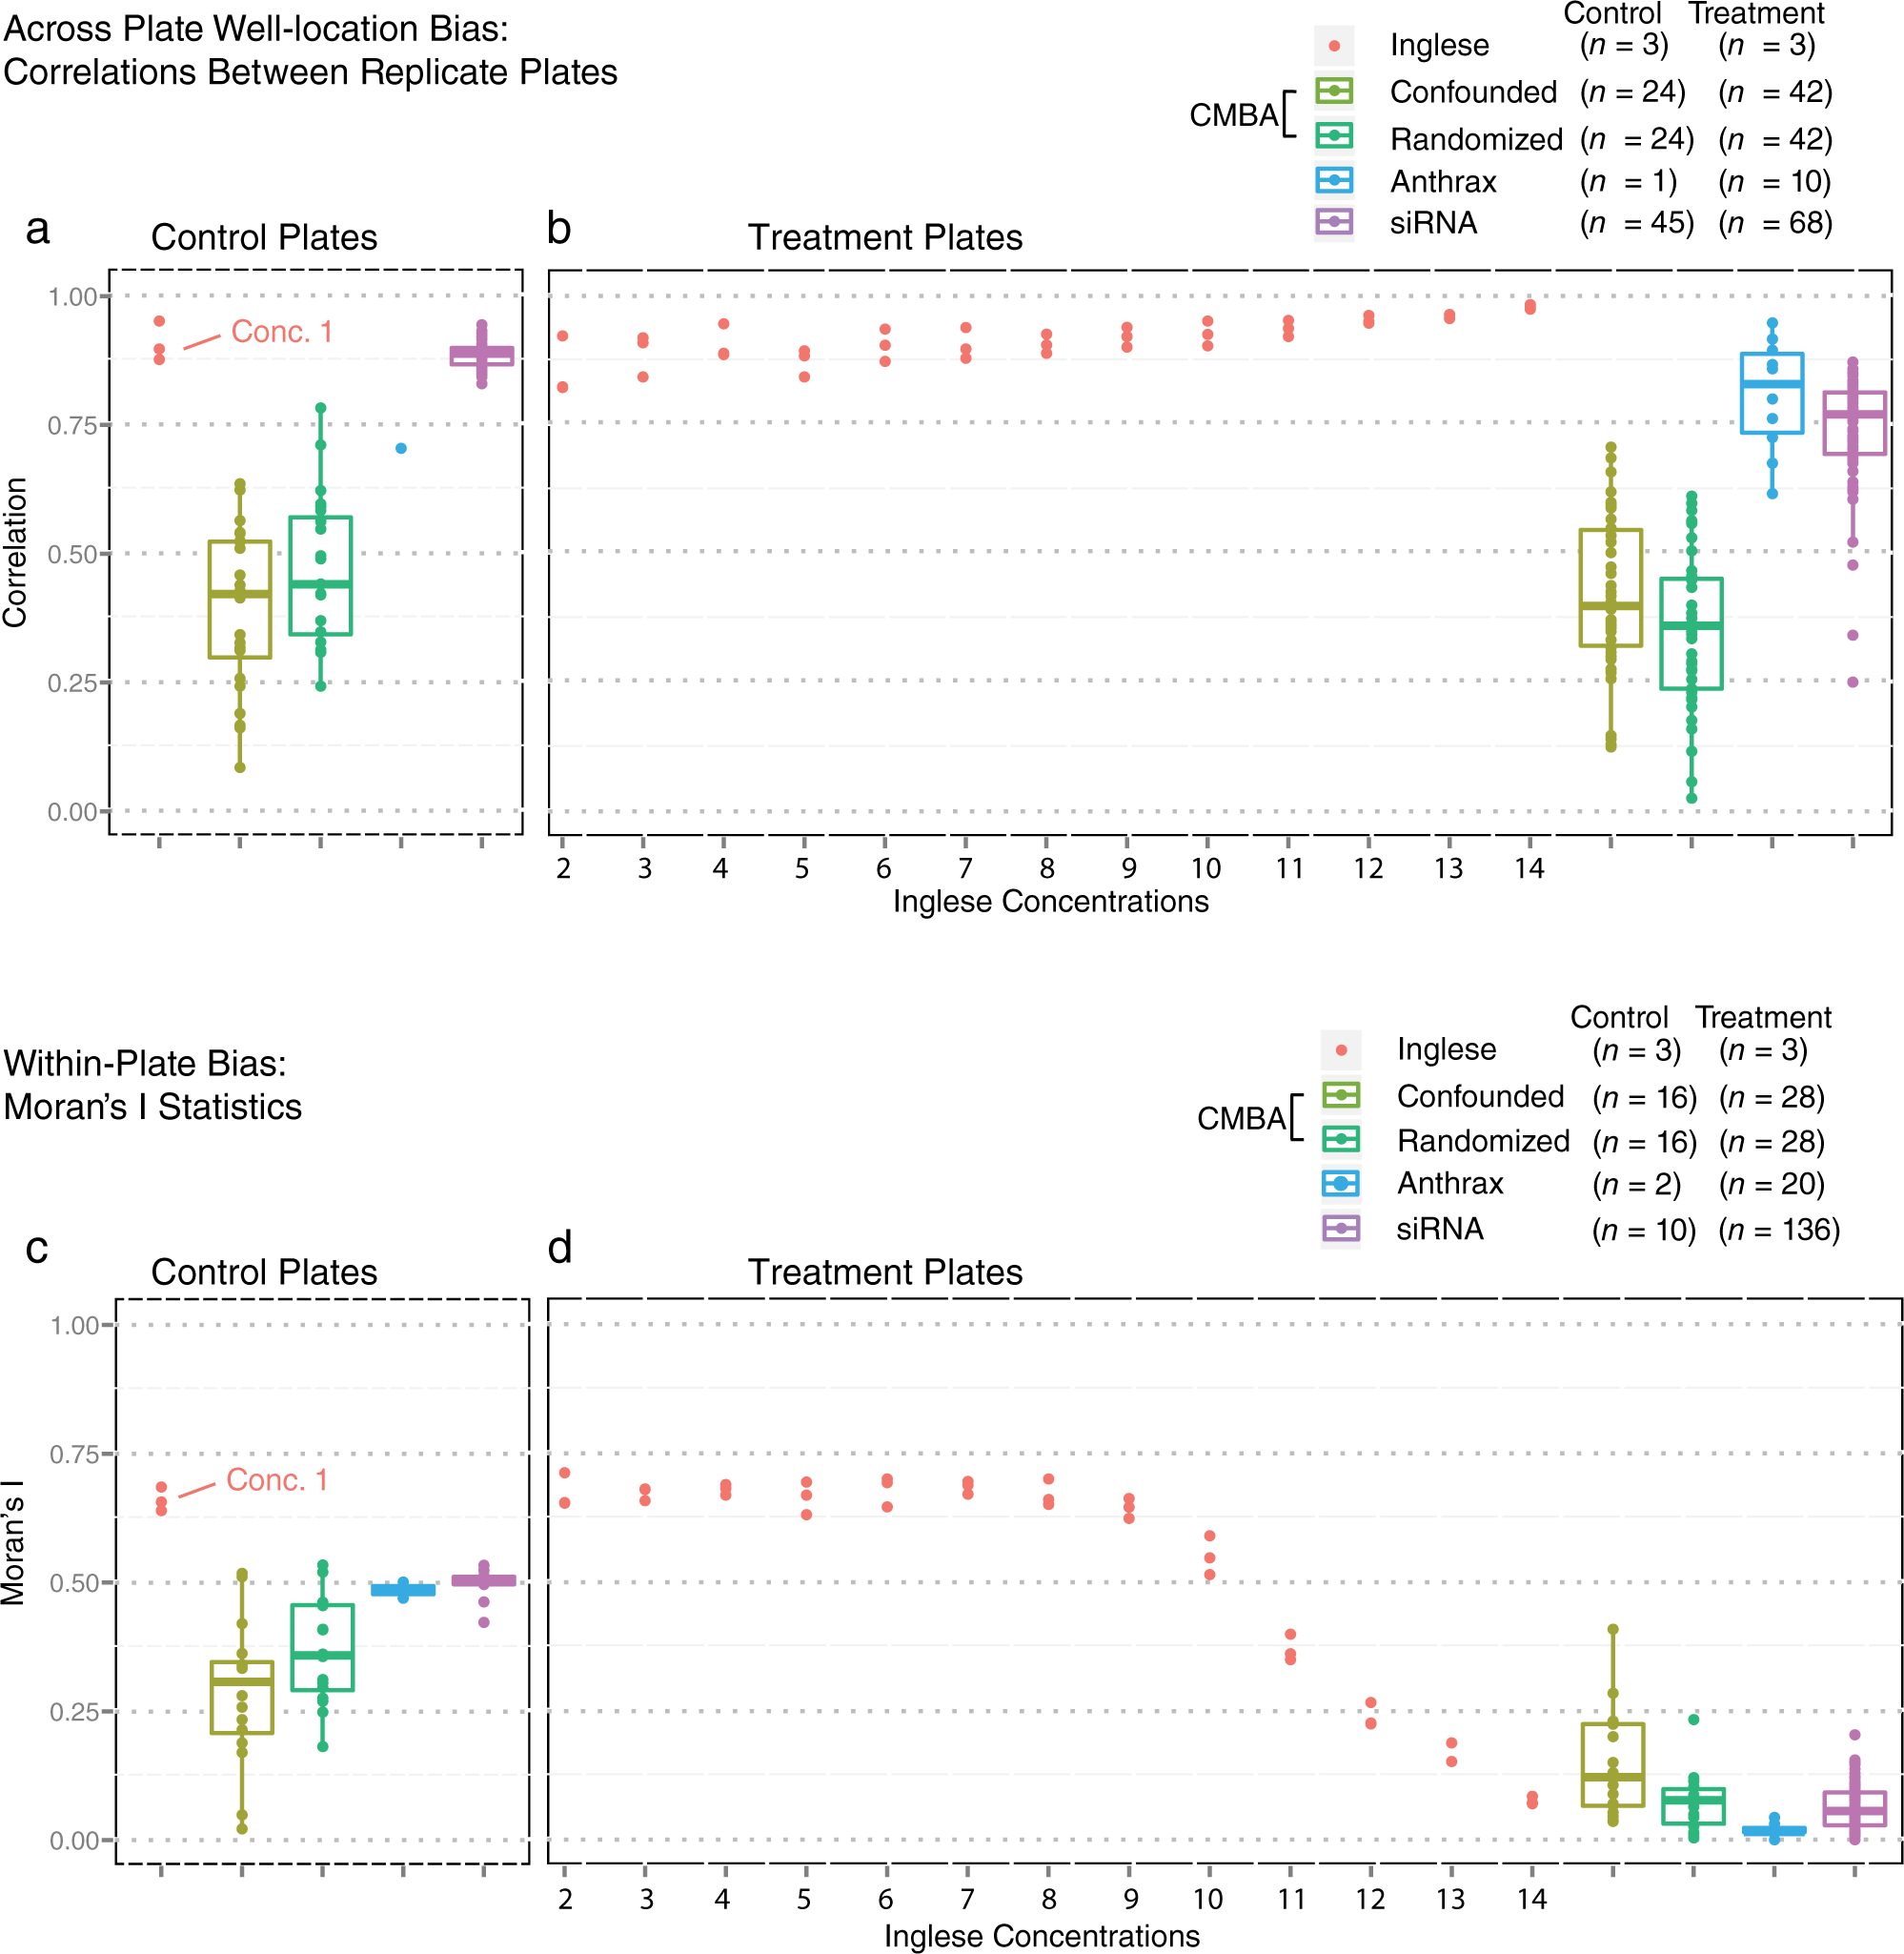
Figure 1a – b illustrates across plate well-location systematic error present in the various data sets. Figure 1a shows correlations between replicate negative control plates. Absent high leverage data points, these correlations should be approximately zero when there is no well bias because the measurements are expected to vary randomly around the same null value. Figure 1b shows correlations between inactive compounds on replicate treatment plates which should similarly be close to zero. The moderate to high median correlations observed for both the control and the treatment plates indicate substantial across plate bias for most plates.
Across plate well-location and within-plate bias for Z-score normalized data. (
The presence of within-plate bias, as indexed by the Moran’s I estimate of overall spatial autocorrelation 15 (see Methods), is shown for control ( Fig. 1c ) and treatment plates ( Fig. 1d ). Nonzero Moran’s I values indicate that proximal wells within plates are correlated and that a compound’s measured intensity depends in part on where it is located on the plate. The low to moderately high median Moran’s I values indicate nontrivial spatial bias for most plates.
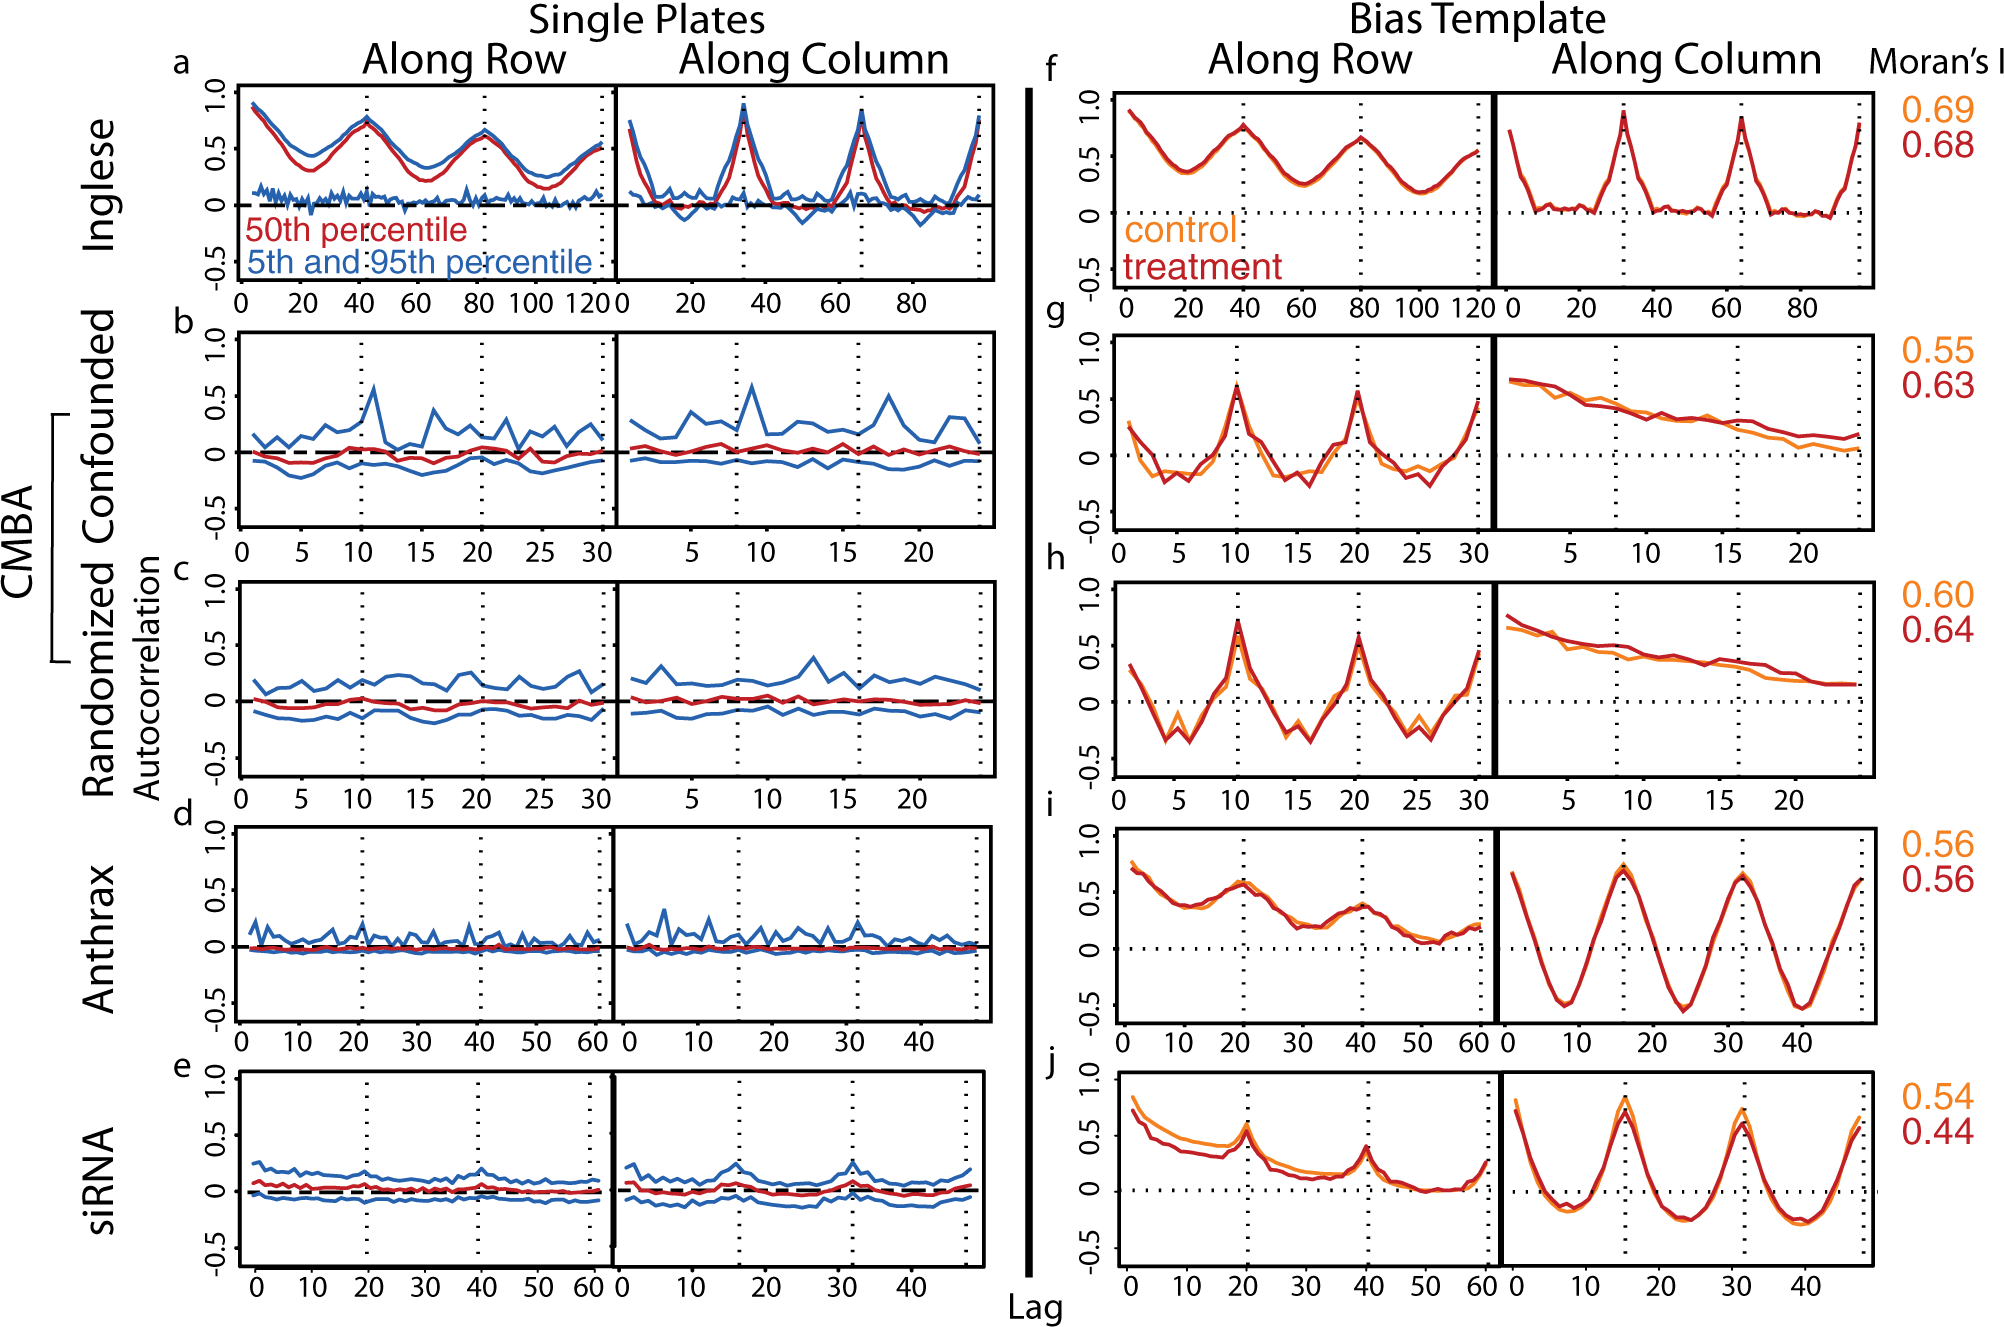
A summary of plate-by-plate autocorrelations by lags for all treatment plates is shown in Figure 2a – e . Lag 1 indicates correlation between adjacent wells, lag 2 indicates correlation between wells separated by one well, and so on. Nonzero autocorrelations indicate within-plate bias, in particular when linear or cyclical patterns among lags are observed. Consistent with the Moran’s I results, the Inglese et al. data showed the most pronounced within-plate bias effects, the CMBA data showed low levels of bias, and the Anthrax and the siRNA data showed no evidence of bias. By contrast, the spatial-bias template results for both control and treatment plates showed approximately equally strong within-plate bias for all experiments ( Fig. 2f − j ). These latter results indicate that spatial bias is present for the data in aggregate even when it is not evident for individual plates, which can affect downstream decisions if not corrected. The presence of both across and within-plate bias in all data sets indicates that normalization is required.
Autocorrelations for Z-score normalized data among different lags for (
A necessary condition for the CPR method to effectively remove bias is for estimates of bias derived from the control spatial-bias template to be correlated with the treatment plates. Figure 3a shows evidence of strong correlations for the Inglese et al. data, moderate correlations for the CMBA data, and low correlations for the Anthrax and the siRNA data. Figure 3b shows a similar pattern for correlations between the control and treatment bias-template data with the exception that the Anthrax and the siRNA data showed considerably higher correlations with the bias-template data. Also, in contrast to the other data sets, the Anthrax and the siRNA scatterplot data deviated substantially from the identity line by virtue of their much smaller ranges for the control bias-template data. These characteristics suggest that CPR normalization may be most effective for the Inglese et al. data and least effective for the Anthrax and the siRNA data.
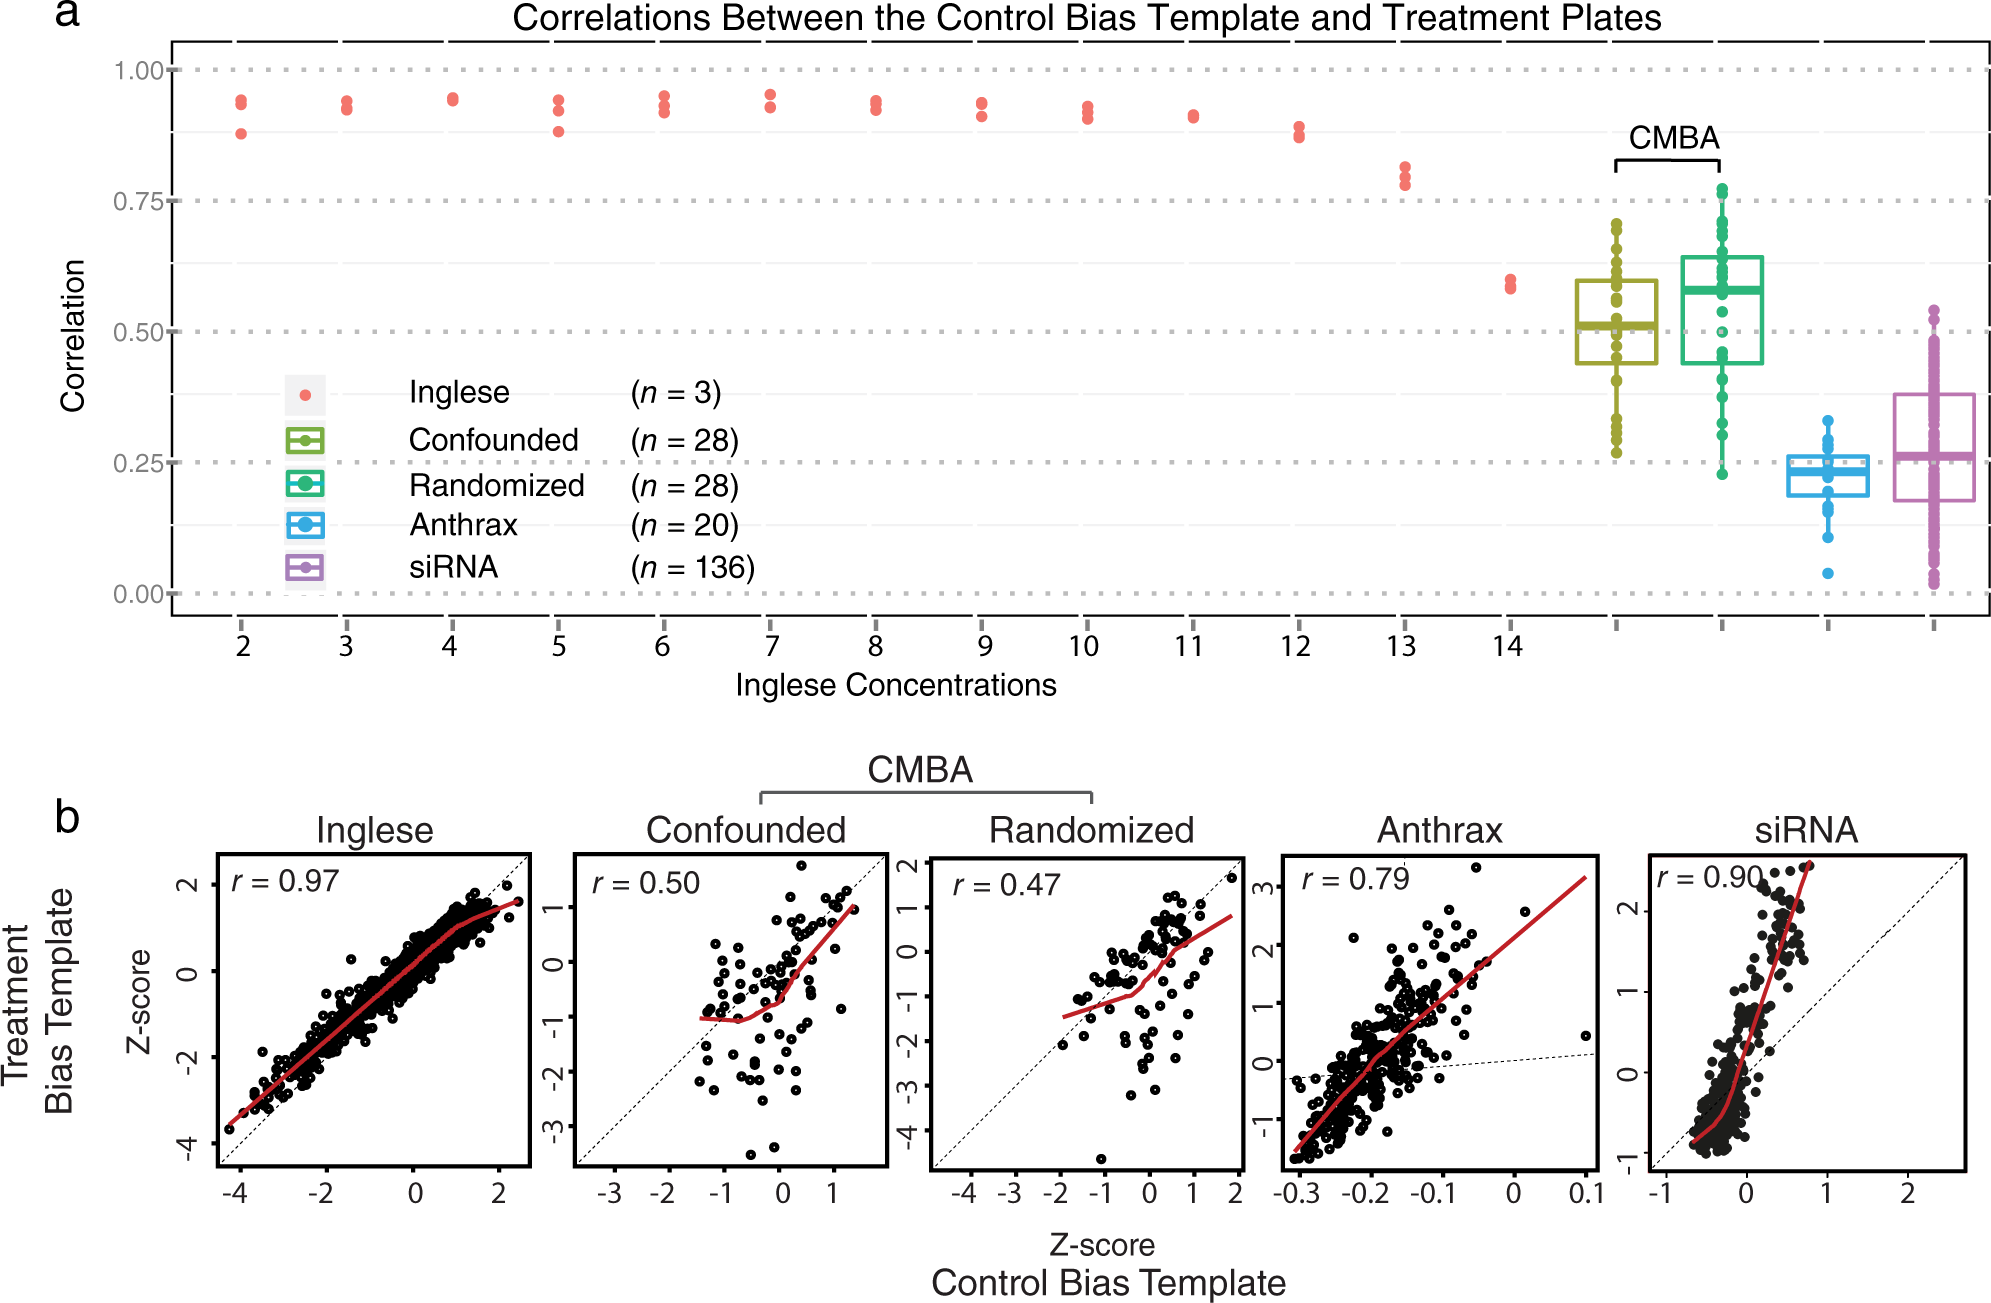
Z-score normalized data. (
Control Plate Regression
We first examine the primary-screen data sets that contain few active compounds to benchmark CPR’s performance against SPAWN, a high-performing primary-screen normalization method.
16
The correlations between the inactive compounds on replicate treatment plates of the Inglese et al. and the CMBA confounded design data (shown in
Figure 4a
–
b
for CPR) are similar to those of SPAWN and much smaller than for Z-scores, indicating CPR’s effectiveness in removing across plate spatial bias. (We note that Z-scores are not to be confused with the quality-control Z- and Z’-factor scores
17
commonly used in HTS; see Methods.) For the CMBA randomized design data, randomization effectively minimized bias, and as a consequence all three methods showed little across plate bias. For the Anthrax and the siRNA data, relatively high correlations were observed for all normalization methods, with Z-scores producing the largest correlations (
Fig. 4b
). The Moran’s I statistics shown in
Figure 4c
–
d
show similarly good performance for CPR in minimizing within-spatial bias (see
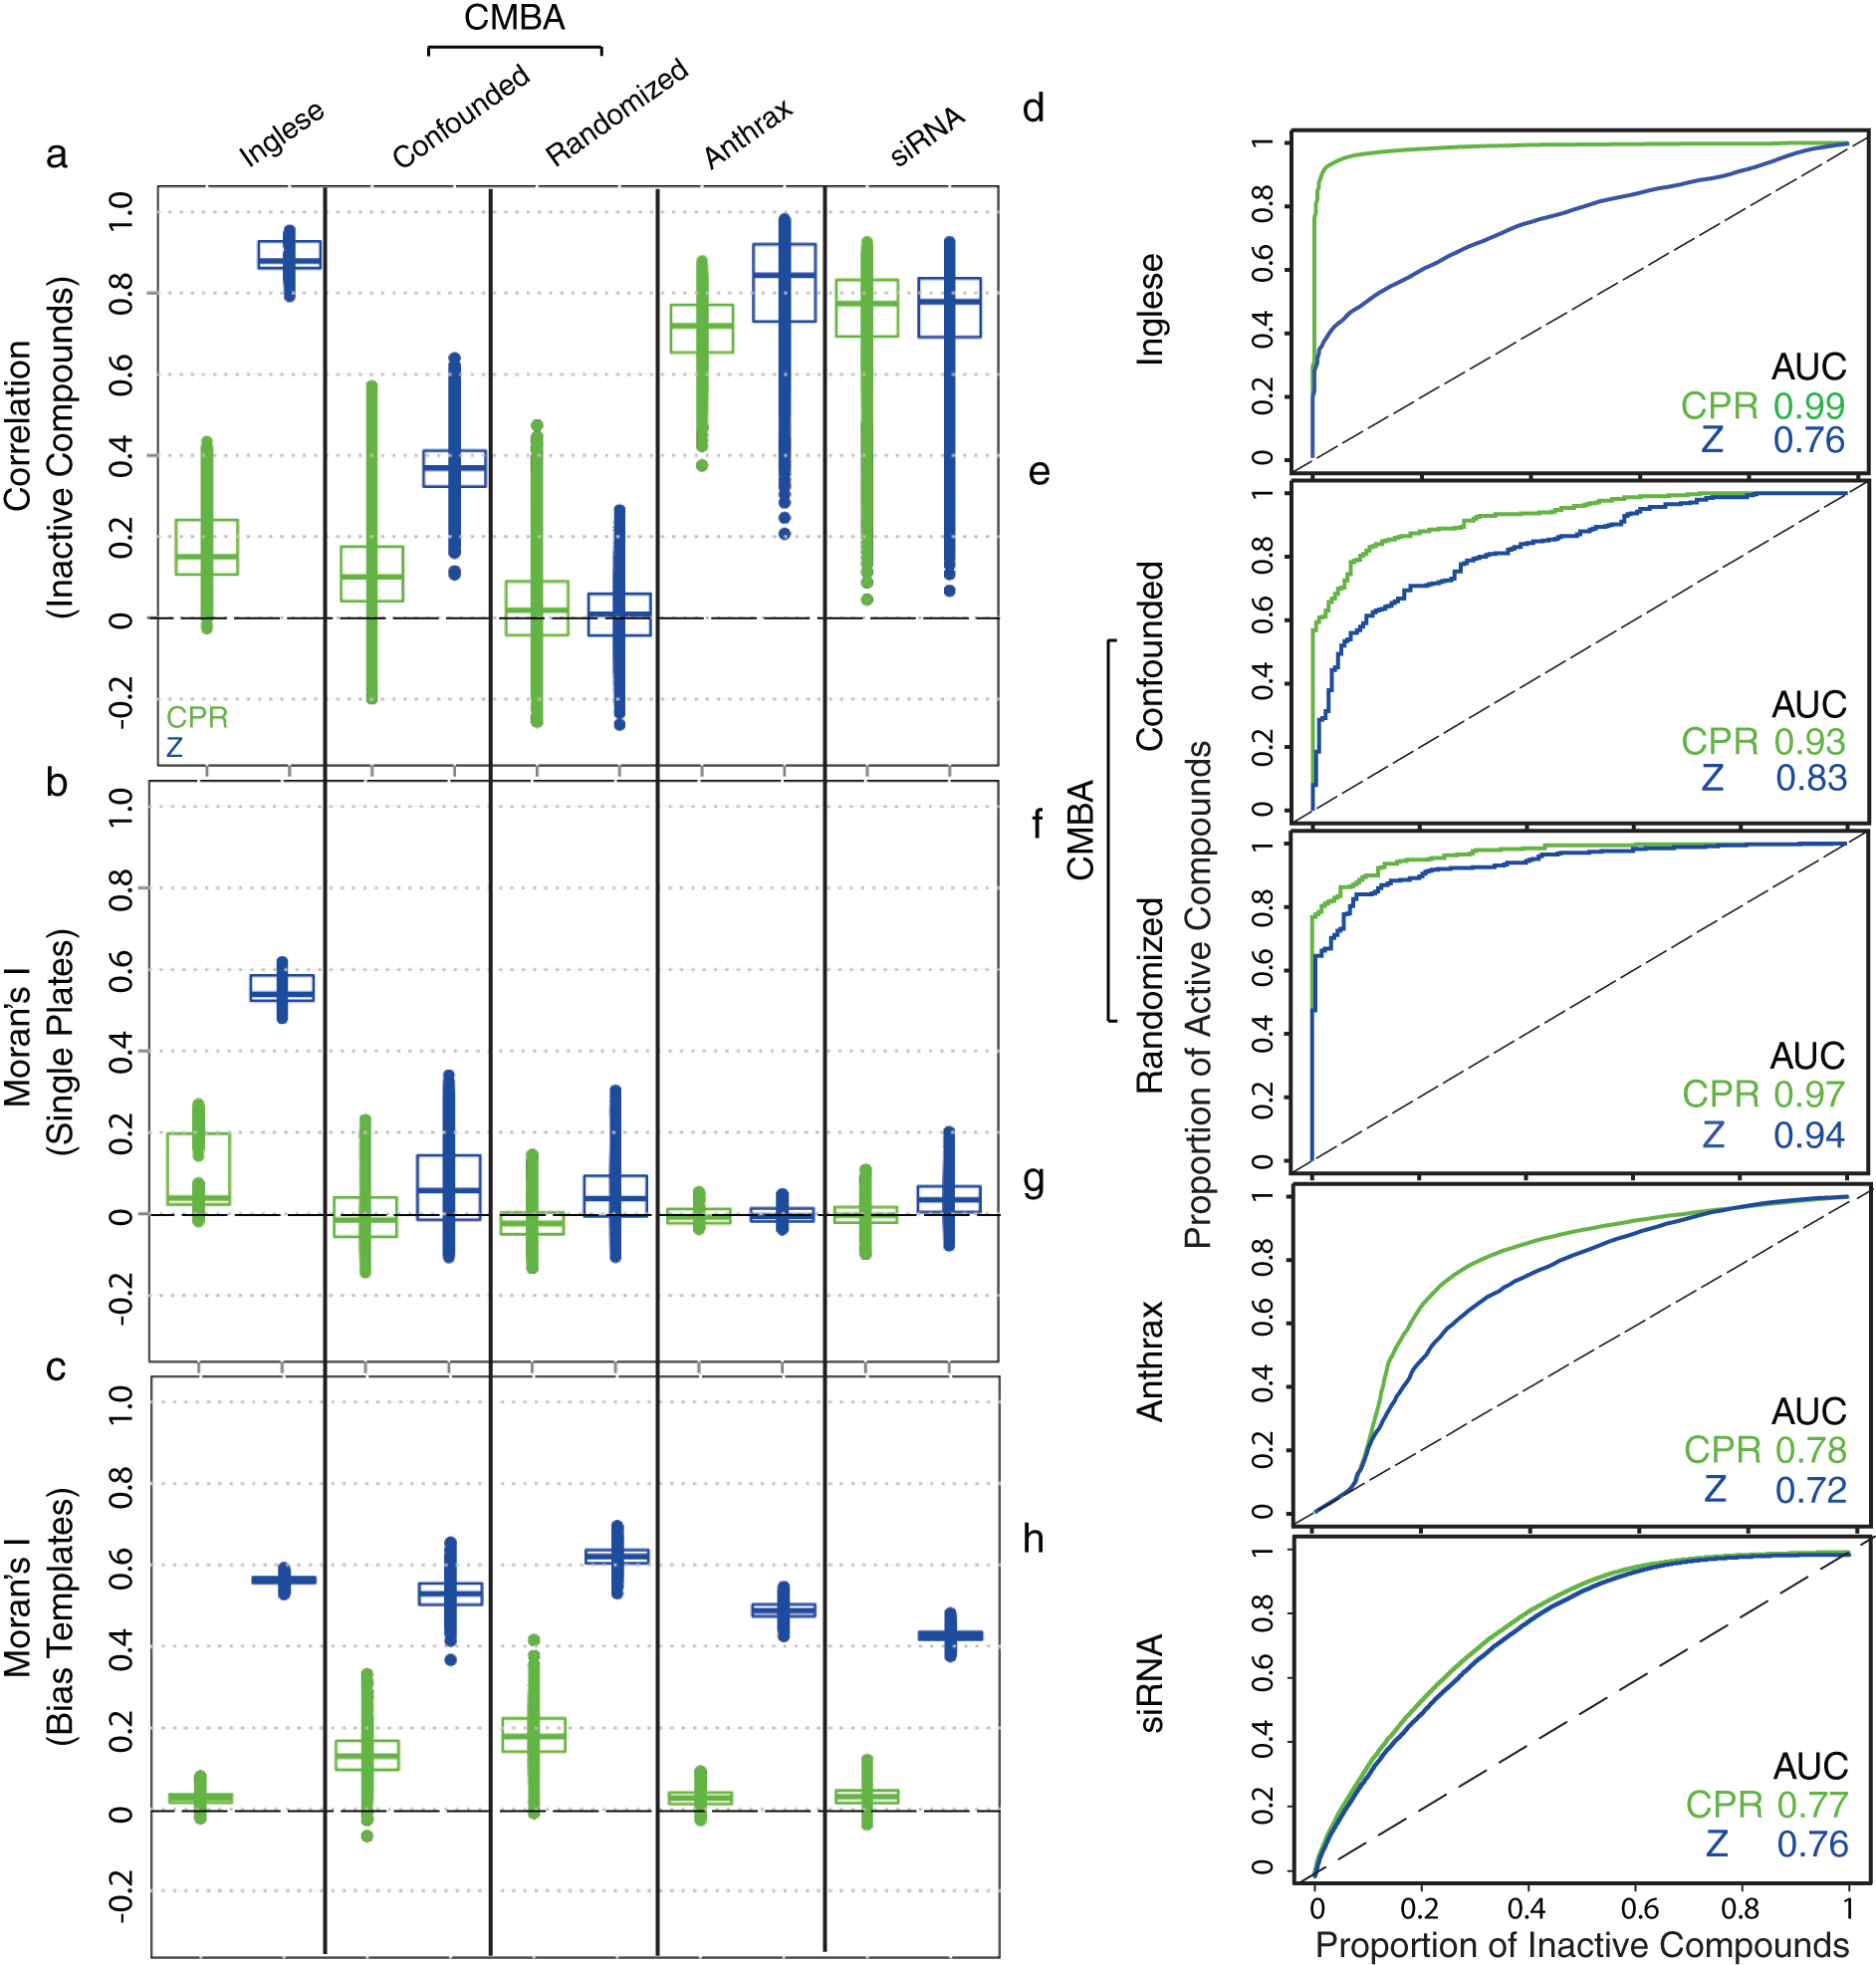
Control-plate regression (CPR) performance (primary-screen data with few active compounds). (
Figure 4e – g shows receiver operating characteristic (ROC) performance indices for the three normalization methods for the three data sets that have known active and inactive features. Figure 4e shows partial area under the curve (pAUC) values for the Inglese et al. concentration data at 0.80 specificity (i.e., a top-ranked list of compounds that includes 20% of the inactive compounds); CPR and SPAWN equally outperformed Z-scores. For the CMBA data, CPR performed almost as well as SPAWN and better than Z-scores ( Fig. 4f – g ).
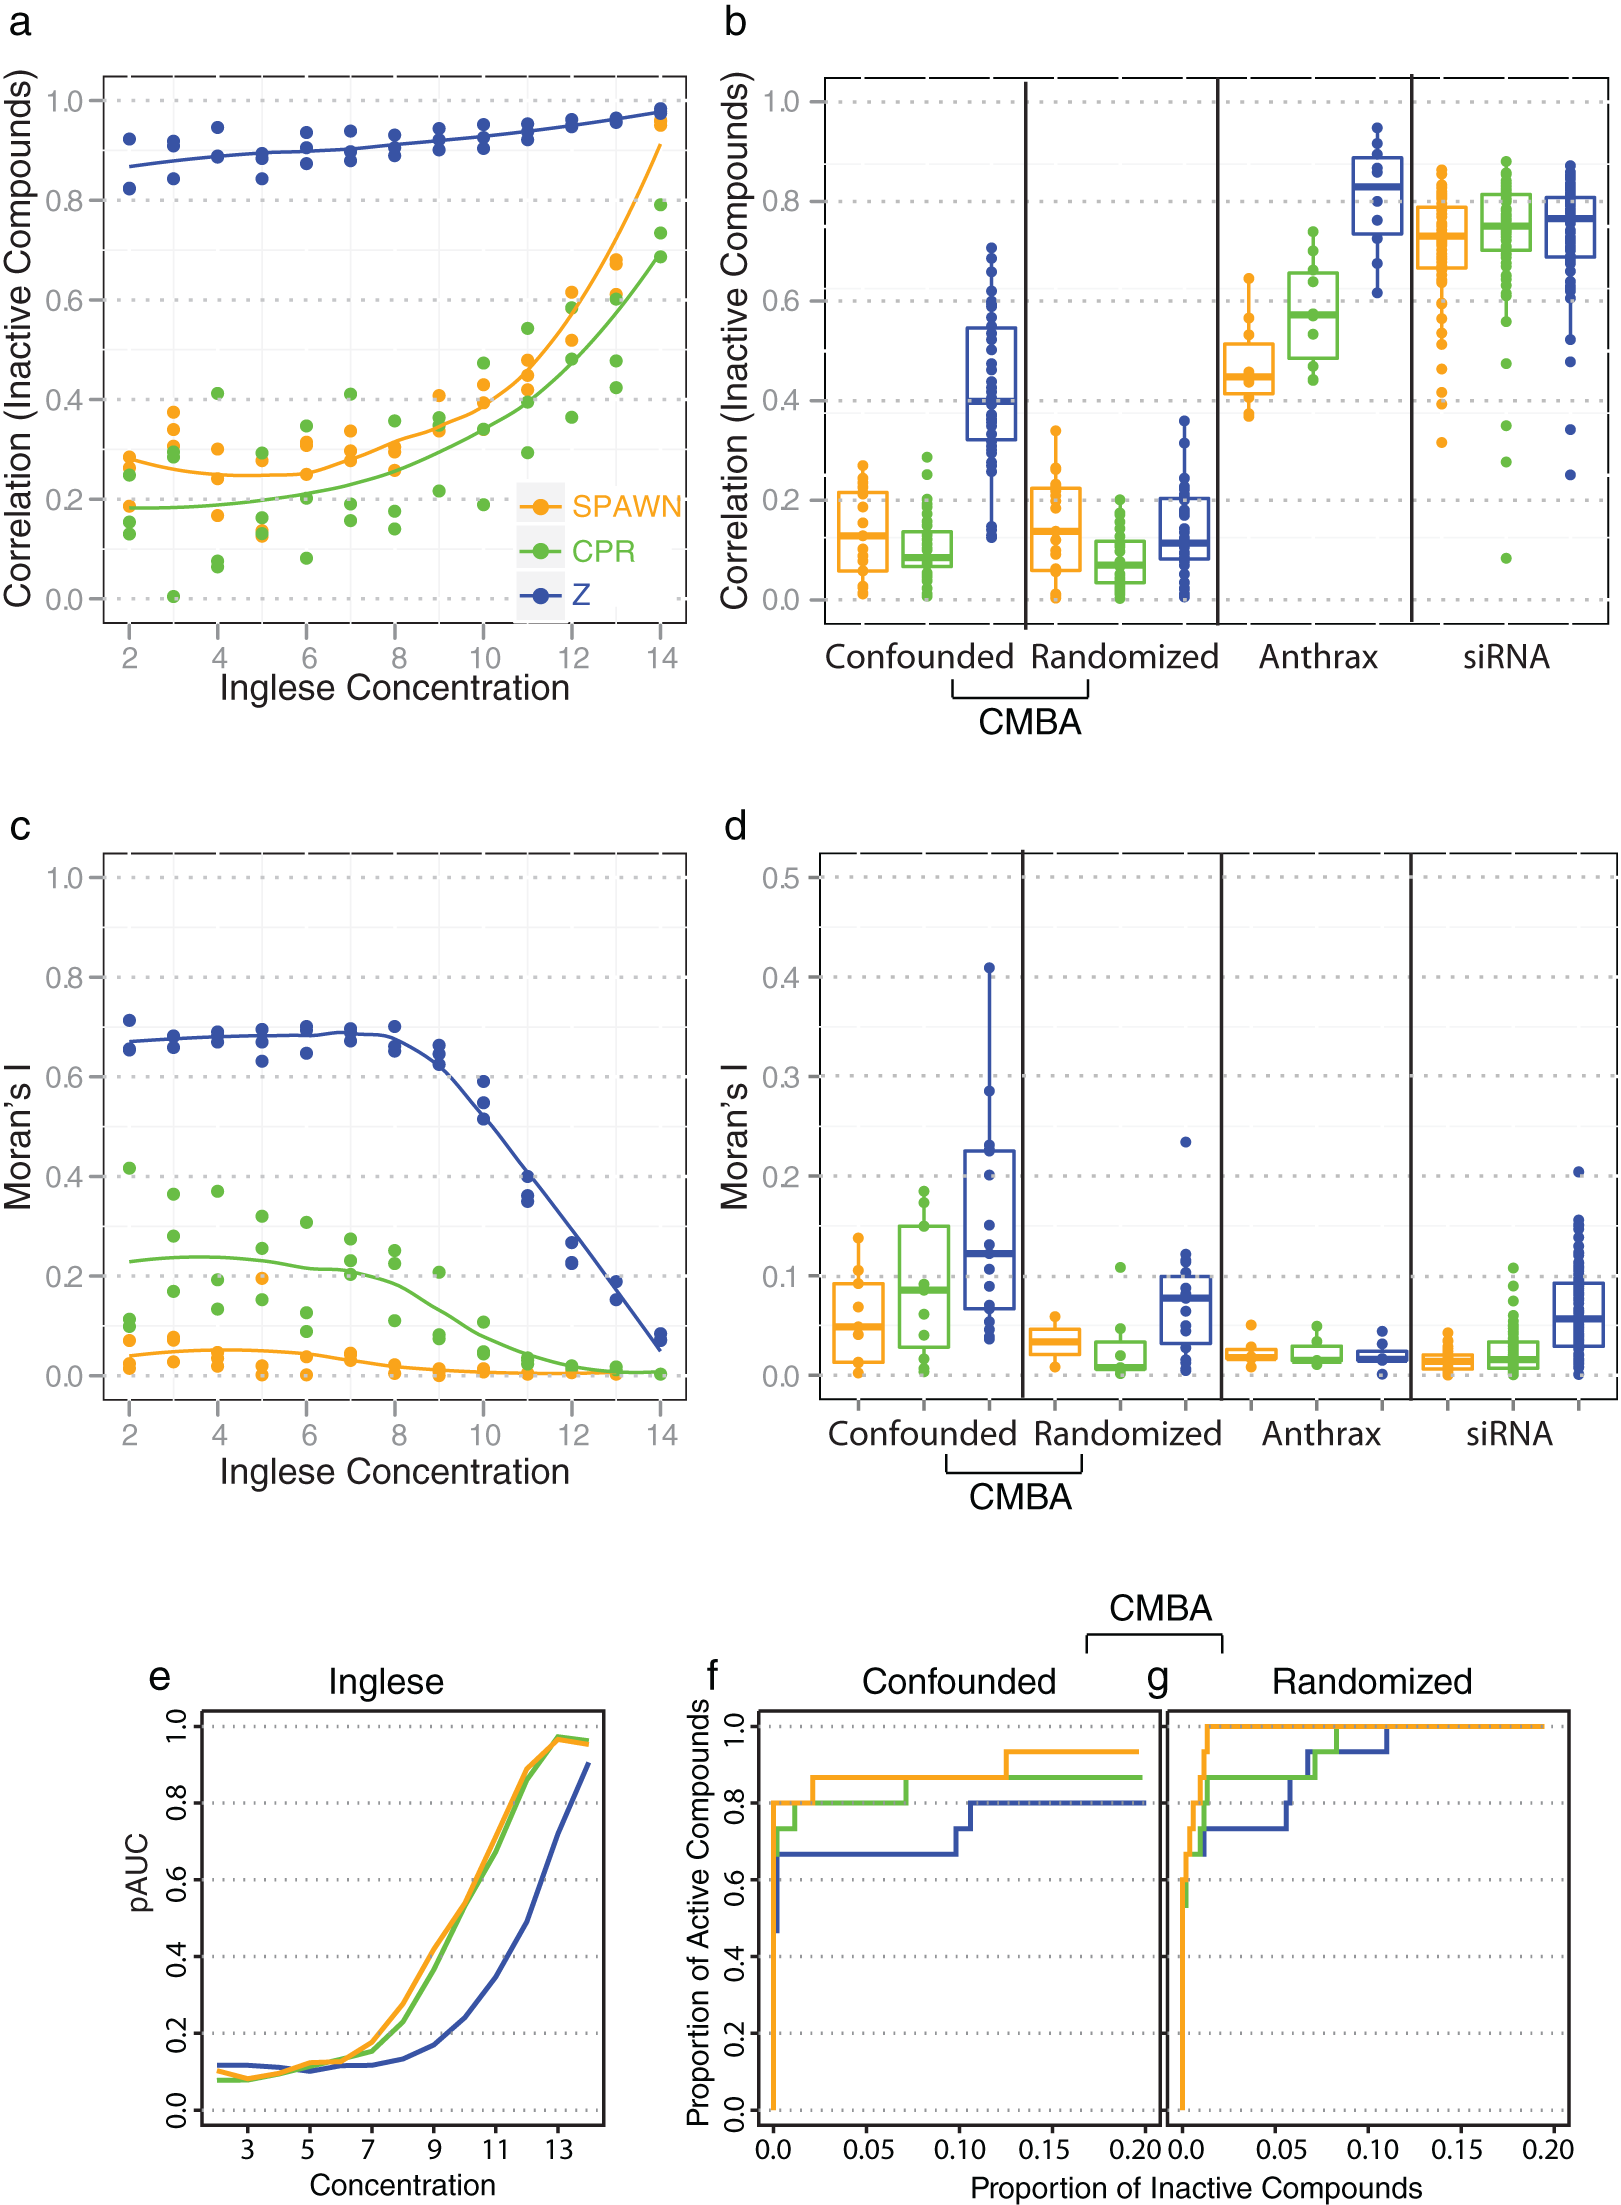
Results for the simulated 70% active-compound data are shown in
Figure 5
. Comparisons between CPR and Z-scores show that CPR effectively removed across and within-plate bias when present in the Inglese et al. and CMBA data (
Fig. 5a
–
c
). As with the primary-screen data, however, CPR removed little of the across plate bias for individual plates in the Anthrax and siRNA data sets (
Fig. 5a
), but it effectively removed aggregated bias as evidenced by the spatial-bias template results (
Fig. 5c
) (see
Control-plate regression (CPR) performance (simulated screen data with 70% active compounds; n = 1000). (
Discussion
Obtaining reasonable levels of accuracy and precision are minimum requirements for successful HTS projects. The observation that most features identified as active in high-throughput primary screens do not validate in medium-throughput follow-up screens suggests that these minimal requirements are not being met.18,19 If normalization corrects for only overall plate systematic error, as is the case for Z-scores and methods that use within-plate controls, then nonstationary processes may dominate the measurements for all but the largest effects. Recent interest in detecting small to moderate-sized effects in various HTS applications such as fragment-based, RNA interference (RNAi), natural-extract, and pharmaceutical screens20–23 indicates that more control over nonstationary processes is needed for these types of data.
Nonstationary processes contribute both random and systematic error, creating unwanted variation in the measurements. Although the adverse effects of random error can be minimized by obtaining replicates, cost considerations often prevent even minimal duplicate replication, especially for ultra-HTS. Also, replication of treatment plates will tend to be largely ineffective for minimizing unwanted variation if done in such a way as to maintain the effects of the nonstationary processes (e.g., if replication is technical rather than biological and/or if replicates are run contiguously). Nonstationary processes are especially likely to dominate measurements in these instances and in unreplicated primary screens because propagation of error from all sources will likely often exceed variation due to biological processes of interest, especially for highly variable features. Even if normalization methods that correct within-plate and across plate well-location bias, such as SPAWN or R 24 , are used in the primary screen, the lack of equivalent methods for follow-up screens with high proportions of putatively active features will necessarily reduce correspondence between the two screens. Ironically, in this situation when spatial biases have been corrected in the primary but not the follow-up screens, it may be that the former results are correct despite their failure to validate. The high similarity between CPR and SPAWN results for the primary-screen data in the present study suggests that better validation would be achieved when spatial bias is corrected for both primary and follow-up screens.
The developers of the valuable ChemBank resource 6 recognized that the strong assumption of few active features made by normalization algorithms that correct for spatial bias may not be appropriate for all data sets deposited in the database. They used Z-score normalization for this reason and because they wished to apply one method to all the data sets to allow for comparability among them. Our results with the Anthrax screen suggest, however, that Z-score normalization may not be optimal for this purpose and that CPR could provide a solution that meets ChemBank requirements for comparability with no activity-level assumptions. Like Z-scores and normalization methods that use within-plate controls, CPR makes no assumptions about the number of active wells within plates or within columns or rows. This contrasts normalization methods like SPAWN and B-scores, which, although superior to Z-scores and similar methods for primary screens, are inappropriate for screens that potentially contain large numbers of active wells.
The B-score method, for example, iteratively calculates row and column medians to estimate their respective biases and generates reasonable results when fewer than half of the wells on every column and every row for all plates have biological activity. This is a strong and unrealistic assumption for follow-up screens, which test only putatively active compounds. We have shown elsewhere that a trimmed mean polish such as that used by SPAWN gives better results than the median polish used by the B-score 4 but nonetheless makes similarly strong assumptions about activity levels, rendering it inappropriate for follow-up screens.
Another advantage of CPR is that it corrects bias on a well-by-well basis rather than by columns and rows. Well correction is desirable when specific wells are biased but are not part of an overall spatial pattern (e.g., due to a malfunction of a specific pipette in a particular run). It is also desirable if activity is clustered within columns or rows, as is potentially the case with many commercial libraries. If this latter issue raises potential concerns about using a normalization method such as SPAWN, CPR can provide an alternative for primary screens that is almost as effective as SPAWN but with less stringent assumptions.
CPR’s performance with the ChemBank Anthrax data, although better than that of Z-scores, was, however, less than it was for the other data sets; we have examined numerous other ChemBank data sets with similar results. These results point to CPR’s main caveat that the control plates must reflect the bias observed in the treatment plates for the method to be effective. For example, CPR’s performance with the Inglese et al. and the CMBA data sets suggests that obtaining more control-plate replicates run contiguously with treatment plates would improve both the accuracy and precision of the well-location bias estimates obtained from the ChemBank control plates. Also, running treatment plates in randomized orders with control plates interspersed throughout the screen so as to capture time-dependent nonstationary processes, as was done for the CMBA data, would also likely be beneficial. The effectiveness of the control plates in estimating the bias present on the treatment plates can be verified by examining scatterplots between the control-plate bias template and treatment plates. In our CMBA experiments, we found that four control plates per run day were required for obtaining reasonable estimates, although the optimal number will vary among screens.
RNAi screens could likewise benefit from CPR normalization. As noted in a recent review, 25 normalization for RNAi screens poses particularly difficult normalization problems that are not readily addressed by methods developed for small-molecule screens. Moreover, RNAi screens present various types of systematic error (row, column, and bowl shaped) 26 that are consistent among nontargeting siRNA control plates, 13 which are ideal conditions for CPR to be effective. There is the same challenge for these data as for the ChemBank data in that control plates should be run interspersed with the plates of interest. The siRNA data set we used tested the control plates on separate days from the treatment plates, minimizing CPR’s effectiveness. Various plate designs with controls placed systematically within plates according to different configurations have also been suggested for normalizing row and column effects in RNAi screens. 27 This approach has the advantage of not requiring control plates, but to be effective it requires that controls be interspersed within the entire plate, which is not always feasible. Other disadvantages are that the plate designs estimate row and column effects based on relatively few wells and do not estimate individual well biases. Notwithstanding, these plate designs are a viable alternative to CPR in that they circumvent the challenges associated with obtaining control-plate bias estimates that correspond to individual treatment plates. Off-target effects present an additional challenge for adequately normalizing siRNA data. Various methods have recently been proposed to address these effects,28,29 and our results suggest that best performance for siRNA screens would be achieved by normalizing for both off-target and spatial bias.
Footnotes
Declaration of Conflicting Interests
The authors declared no potential conflicts of interest with respect to the research, authorship, and/or publication of this article.
Funding
The authors disclosed receipt of the following financial support for the research, authorship, and/or publication of this article: This work was supported by Le Fonds Québécois de la Recherche sur la Nature et les Technologies (FQRNT) Grants 119258 and 173878, by the French national network of Genopoles, and by a Walter Sumner Foundation Fellowship to C. M.
References
Supplementary Material
Please find the following supplemental material available below.
For Open Access articles published under a Creative Commons License, all supplemental material carries the same license as the article it is associated with.
For non-Open Access articles published, all supplemental material carries a non-exclusive license, and permission requests for re-use of supplemental material or any part of supplemental material shall be sent directly to the copyright owner as specified in the copyright notice associated with the article.