
Abstract
Sphingosine-1-phosphate (S1P) is a bioactive metabolite with pleiotropic effects on multiple cellular processes in health and disease. Responses elicited by S1P are a result of binding to five specific G-protein–coupled receptors. We have developed multiple assays to systematically study the downstream signaling of these receptors, including early events such as direct receptor activation (GTPγS) as well as more distal events such as S1P1 receptor degradation. Employing such assays, we have characterized and compared multiple S1P1 agonists that are in clinical development including FTY720, BAF312, CS-0777, and other molecules from the S1P1 patent literature. Our parallel assessment has allowed us to compare their potency against S1P1, their selectivity against the four other S1P receptors, as well as species cross-reactivity. We note that all of the compounds studied signal in an identical manner through S1P1, leading to receptor degradation.
Keywords
Introduction
FTY720 (Fingolimod/Gilenya) is an approved drug for the treatment of multiple sclerosis, and this has established the S1P receptor (SIPR) family as an effective therapeutic intervention point for this disease. Although FTY720 is an agonist for S1P1, S1P3, S1P4, and S1P5, expression data and preclinical studies suggest that the efficacy is largely mediated by S1P1.1,2 Current research in the field has focused on developing molecules with an improved selectivity profile with the goal of reducing side effects observed with FTY720. These side effects, which may be mediated by the other S1P receptors, include bradycardia, macular edema, and hypertension, as outlined in the label. We have developed a set of complementary assays to study S1PR agonists, and here we compare their potency and selectivity in GTPγS, β-arrestin recruitment, calcium flux, cyclic AMP (cAMP) reduction, receptor down-regulation, and degradation assays. We demonstrate that all of the small molecules investigated signal through S1P1 in a similar manner by causing receptor down-regulation and degradation. This behavior contrasts with the natural ligand (S1P), which induces receptor down-regulation from the cell surface but not degradation at physiological concentrations (at high concentrations of S1P, degradation of the receptor has been observed3,4). We also identify some differences in the selectivity profiles across different S1P receptors, which may prove important as the origin of the side effects is further understood.
Materials and Methods
Cell Lines
Tango EDG1-bla U2OS cells (human S1P1), Tango EDG3-bla U2OS cells (human S1P3), Tango EDG6-bla U2OS cells (human S1P4), and Tango EDG8-bla U2OS cells (human S1P5) cell lines were purchased from Life Technologies (Carlsbad, CA) and cultured according to the manufacturer’s instructions. Tango rat S1P1, (rS1P1) and mouse S1P1 (mS1P1) were generated by Life Technologies and cultured according to the manufacturer’s instructions. Human S1P1 (hS1P1), human S1P2 (hS1P2), human S1P3 (hS1P3), human S1P5 (hS1P5), rat S1P3 (rS1P3), dog S1P1 (dS1P1), dog S1P3 (dS1P3), and dog S1P5 (dS1P5) receptors were subcloned into pcDNA3.2/V-5 Dest expression vector and transfected into the CHO-k1Gα16 cell line using lipofectamine 2000 (Invitrogen 11668-019, Carlsbad, CA) according to the manufacturer’s instructions. They were either used directly or selected as pools of stably transfected cells (as indicated in the “Results” section). Cells were passaged twice a week in Hams F12 (Gibco 11765), 10% fetal bovine serum (Gibco 16140), penicillin/streptomycin, 0.2 mg/mL Zeocin (Invitrogen R25001), and 0.5 mg/mL Geneticin (Gibco 10131).
[35S] GTPγS SPA Binding Assay
Human S1PR membranes for S1P1, 2, 3, and 5 (Millipore, Billerica, MA) were diluted to 2 µg/well for S1P1 and S1P3 and 3 µg/well for S1P2 and S1P5. A mixture (160 µL) of membrane suspension in assay buffer (25 mM Tris-HCl, pH 7.9, 100 mM NaCl, 3 mM MgCl2, 0.2 mM EGTA, 0.25% bovine serum albumin [BSA], 10 µg/mL saponin, and 30 µM GDP) was added to a 96-well flexi-sample plate (Wallac) containing 10 µL of 20× compound, S1P (for 100% activation control), or DMSO only (no agonist control) for a final concentration of 1 µM for S1P and 1% DMSO. Cold GTPγS was included at 10 µM final concentration in the assay as a nonspecific binding control. Thirty microliters of [35S] GTPγS (PerkinElmer, Waltham, MA), specific activity = 1250 Ci/mmol, was added for a final concentration of 0.10 nM. The assay plate was incubated at room temperature for 1 h followed by the addition of 50 µL of WGA PVT SPA beads (GE HealthCare RPNQ0001, Waukesha, WI) resuspended to 17.9 mg/mL in 25 mM Tris-HCl, pH 7.9, 100 mM NaCl, 3 mM MgCl2, 0.2 mM EGTA. The plate was incubated in the dark at room temperature for an additional hour, sealed, and centrifuged for 10 min at 1500 rpm at room temperature. Light emission was then determined on the MicroBeta plate reader (PerkinElmer) reading at 3 min/well. Reagent sourcing was S1P, GDP, GTPγS, fatty acid–free BSA, DTT, sodium chloride, magnesium chloride, DMSO, and saponin (Sigma, St. Louis, MO), Tris-HCl and PBS (Gibco), and EGTA (Anaspec, Inc, Fremont, CA).
cAMP Assays
S1P1, 2,3 and 5 CHO cells were plated at a density of 10,000 cells per well in Hank’s Balanced Salt Solution (HBSS), 0.1% BSA, in a white 384-well plate and incubated at 37 °C, 5% CO2, for 2 h. Forskolin and agonists were diluted into HBSS, 0.1% BSA, 0.5 mM IBMX (3-isobutyl-1-methylxanthine), and added to the wells. The final concentration of forskolin was 10 µM. The cells were incubated at 37 °C, 5% CO2, for another 2 h. The assay was stopped with the addition of cAMP detection reagents (PerkinElmer). The assay was read on a PE Envision (LANCE), and a ratio was calculated by dividing the 665 nm/620 nm channels. A total of 10 µM S1P was used as a positive control, and wells containing no agonist were used as negative controls. All compounds tested were subjected to a 10-point dose response in 0.5% DMSO. Compounds were also evaluated as antagonists by incubating the compound with the natural ligand, S1P, at its EC80 for each receptor.
Calcium Flux Assays
S1P1,2,3 and 5 CHO cells were plated at a density of 50,000 cells per well into 96-well, black, clear-bottom tissue culture–treated plates (BD Biosciences, Franklin Lakes, NJ) and allowed to adhere overnight. The media were removed, and the cells were washed once with HBSS (Life Technologies). Calcium 4 dye (Molecular Devices, Sunnyvale, CA) was prepared according to the manufacturer’s instructions and added to each well. Agonists were diluted in HBSS and added to the cells on a FLIPR Tetra. Fluorescence intensity was measured for 180 s. Data are represented as relative fluorescent units by subtracting the minimum signal from the maximum signal. A total of 10 µM S1P was used as a positive control, and wells containing no agonist were used as negative controls. All compounds tested were subjected to a 10-point dose response in 0.5% DMSO.
β-Arrestin Recruitment Assays
β-arrestin recruitment assays for S1P1, 3, 4 and 5 (Tango) were performed according to the manufacturer’s instructions with the following modifications. Agonists were diluted in assay media (FreeStyle Expression Medium, Invitrogen) so that the final DMSO concentration in the assay was 1%. The agonists were routinely incubated on the cells for 18 h prior to addition of the GenBlazer substrate. Ratio values for each well were compared with 10 µM S1P (percentage of control [POC]). EC50 values were calculated with XLfit using a four-parameter fit. Compounds were also evaluated as antagonists by incubating the compound with the natural ligand, S1P, at its EC80 for each receptor.
S1P1 Degradation
HS1P1 CHO cells were seeded at 1 X 10⁶ cells per 35-mm well and incubated in serum-free F12 media overnight. Cells were preincubated with compounds for 30 min (final DMSO concentration of 1%), washed with PBS, and detached using 1 mL of Accutase (Millipore). They were then pelleted and resuspended in 100 µL of 1× Sample Prep Buffer (4XNuPAGE LDS, Invitrogen NP0007) containing reducing agent (10XNuPAGE Reducing Agent, Invitrogen NP0004) and Benzonase (Novagen 71206-3), vortexed, sonicated, and heated to 95 °C for 5 min, prior to Western analysis. Equivalent volumes were run on 4% to 12% Bis Tris NuPAGE gels (Invitrogen NP-323) in 1× MOPS Buffer (Invitrogen NP0001) at 180 V for ~1 h, transferred to nitrocellulose for 7 min at 20 V using the i-Blot Dry Transfer System (Invitrogen IB1001), and blocked for 1 h at room temperature in Li-Cor Blocking Buffer (Odyssey 927-40000). Blots were probed with rabbit Anti-EDG1 antibody (sc-25489, Santa Cruz Biotechnology, Santa Cruz, CA) at a 1:1000 dilution followed by goat Anti-Rabbit IR Dye 680 (Li-Cor 926-32221) diluted 1:10,000 for visualization of the S1P1 receptor. Blots were stripped with Restore Western Blot Stripping Buffer (Thermo Scientific 21059, Waltham, MA) and then reprobed with monoclonal Anti-GAPDH, clone GAPDH-71.1 (Sigma G8795) diluted 1:20,000, followed by goat anti-Mouse IR Dye 800 CW (Li-Cor Odyssey 926-32210) for the visualization of GAPDH (loading control). All antibodies were diluted in Li-Cor Blocking Buffer containing 0.1% Tween-20 (Sigma P1379). The Li-Cor Odyssey was used to detect the S1P1 receptor signal, which was quantified using densitometry and normalized to the GAPDH signal.
Human umbilical vein endothelial cells (HUVECs) were obtained from Lonza (Basel, Switzerland), cultured in EBM-2 medium (Lonza #CC-3156), and seeded at 0.5 X 10⁶ cells per 35 mm well and incubated in serum-free EBM-2 media overnight. HUVECs were incubated with compound for 4 h as this was the time when maximum degradation was observed in a time course study (data not shown), rather than 30 min, the time of maximum degradation observed in S1P1 CHOs (data not shown). HUVECs were processed in the same manner as the S1P1 CHO cells after compound treatment.
Receptor Down-regulation Assay (Flow Cytometry)
HS1P1 CHO cells were plated overnight (50,000–75,000 cells per 150 µL/well) in 96-well round-bottom plates in serum-free F12 media. The next day, cells were incubated with compounds for 30 min at 37 °C in a total volume of 200 µL (final DMSO concentration was 1%), detached with Accutase, washed, and stained with Cell Staining Buffer (Biolegend 420201, San Diego, CA). S1P
Compounds and Data Handling
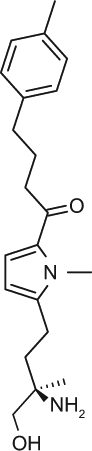
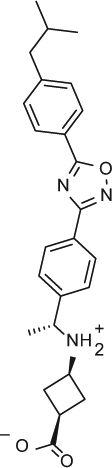
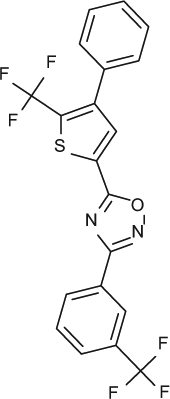
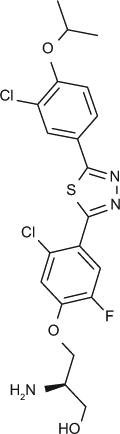
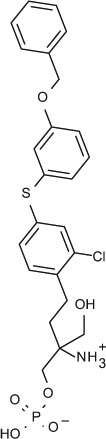
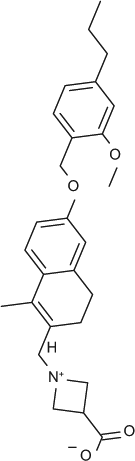
Select chemicals were purchased from commercial sources, for example, (S)-FTY720-P (Toronto Research Chemicals, Toronto, Canada; referred to as FTY720-P in the text), KRP-203-P (Cayman Chemical, Ann Arbor, MI, provides a racemic mixture that was used here), and SEW2871 (Sigma-Aldrich). The remaining chemicals were synthesized according to published methods, for example, compound X (US2009/275554), compound Y (US 2010/0249071), CS-0777 (US2007/191468), PF-991 (WO2009/060278), and BAF312 (WO2004/103306 and WO2010/071794).5,6
POC was calculated for all wells from the raw data of the test compounds, S1P as a positive control, and no agonist as a negative control. EC50 values were calculated using XLfit (IDBS, Guildford, Surrey, UK) with a four-parameter fit.
Results
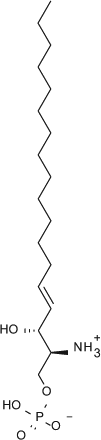
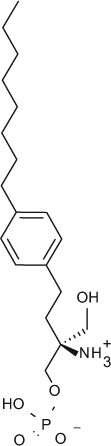
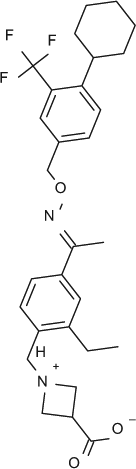
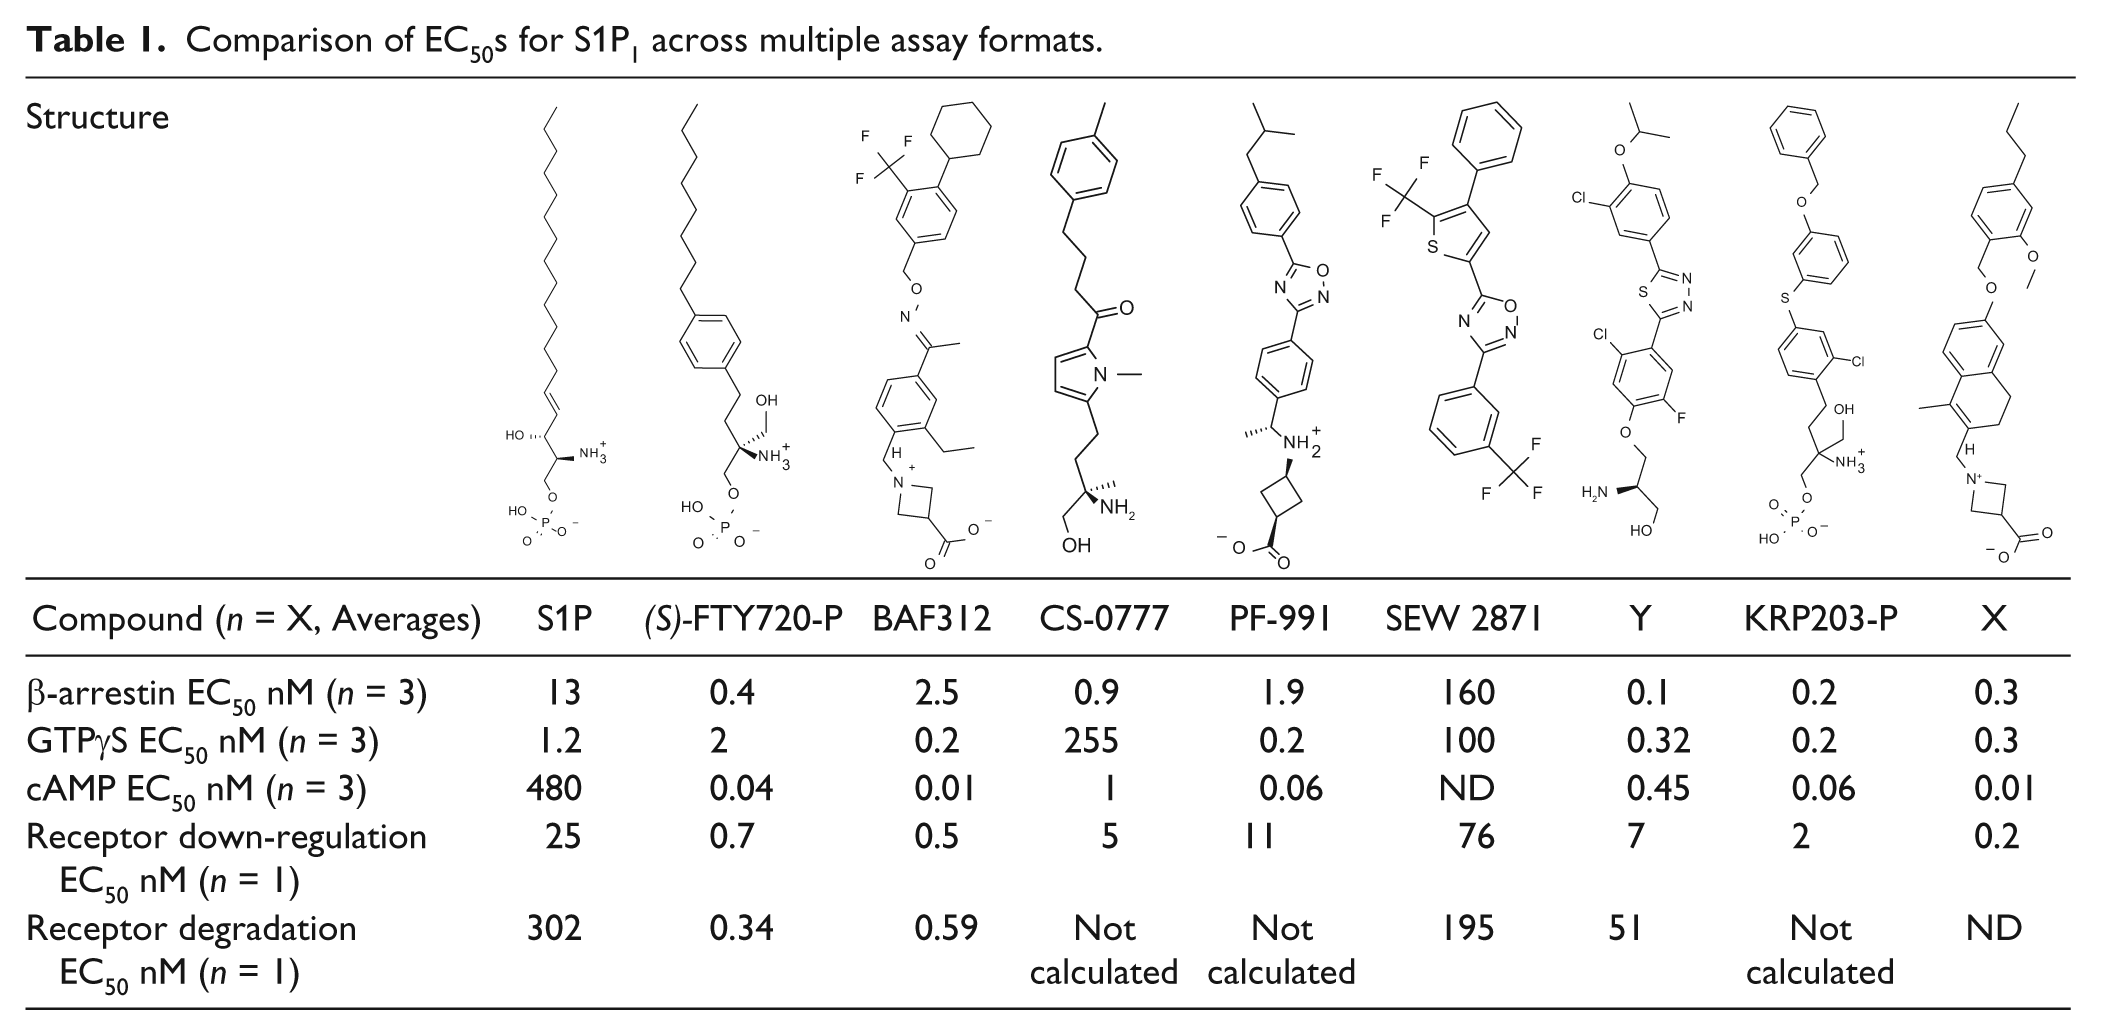
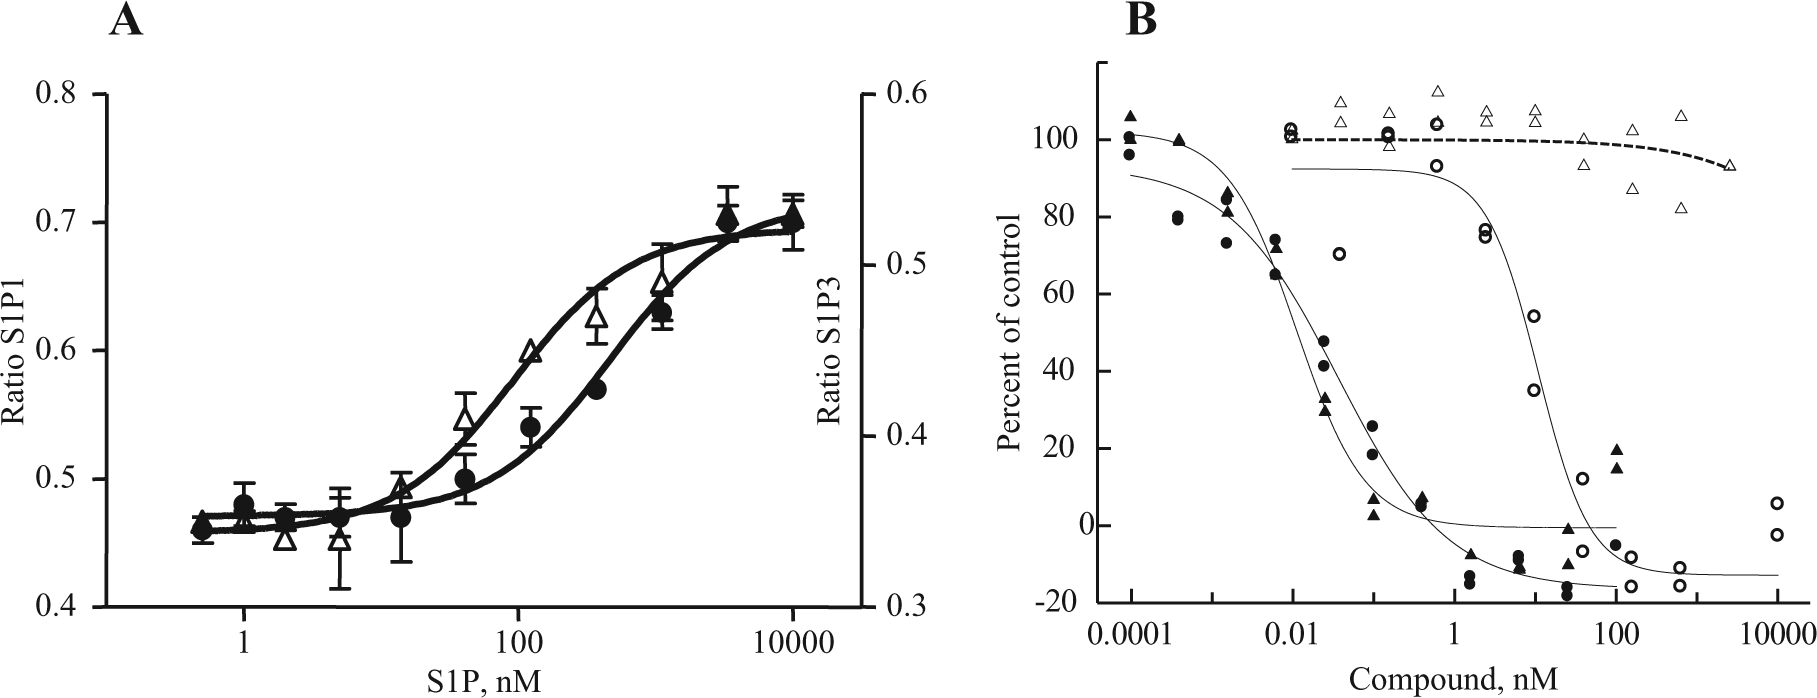
We developed and evaluated multiple assay formats for measuring S1P receptor response to natural and chemical ligands, both to allow us to compare our data to previously published data and to choose the most informative and robust assays for compound profiling. As shown in Figure 1 , our optimized GTPγS assays for S1P1, 3 (A) and S1P2, 5 (B) demonstrated a dose response to the natural ligand (S1P). Although the fold stimulation (signal to background ratio) was larger for S1P1 and S1P3 (at 10X and 14X, respectively) than for S1P2 and S1P5 (both at ~2X), the signals were reproducible regardless of membrane batch of the same receptor tested. The dose-response data for FTY720-P and BAF312 are shown for S1P1 and S1P3 in Figure 1C and D . Consistent with published reports, FTY720-P 7 and BAF3125 are potent and efficacious S1P1 agonists (EC50s of 1.4 nM and 0.14 nM, respectively). In addition, we confirmed that FTY720-P is a partial agonist with shifted potency against S1P3 (EC50: 13 nM; 30% efficacy), whereas BAF312 does not act as an agonist of S1P3 ( Fig. 1D ) up to 10 µM in experiments not shown. We performed dose responses for all compounds in each assay format based on availability of subtype and species for the S1PRs ( Tables 1 and 2 ). S1P receptor agonists tested were the natural ligand S1P, FTY720-P (the biologically active phosphate metabolite of FTY720), BAF312, CS-0777, PF-991, SEW 2871, compound Y (a representative compound from the Exelixis S1P patent literature), KRP203-P, and compound X (a representative compound from the ONO S1P patent literature). It was not possible to present data from the unphosphorylated (prodrug) and phosphate form (more active form) of all compounds because of patent restrictions. Compound phosphorylation will likely occur in cells, and this needs to be taken into consideration when comparing assay formats. All chemical structures are shown in Table 1 . Selectivity profiles are discussed later in the results. The second assay format evaluated was β-arrestin recruitment to the receptor (TANGO), which was developed for S1P1, 3, 4 and 5. This format has been previously reported, 8 and one important advantage is that the signal measured is due entirely to signaling through the transfected receptor and is not due to signals from other endogenously expressed S1P receptors. We optimized the assay to maintain the assay window while using 1% DMSO by increasing the incubation time with ligand from 3 to 18 h ( Fig. 1E ). The assay window increases from 14 to 30 (S1P) with a longer incubation time. This assay format has a large fold increase of between 5X and >20X for all four receptors tested (data not shown) and has no background in parental cells due to the specificity of the β-arrestin readout in transfected cells, making it a robust format for compound profiling. As shown in Figure 1F , these changes did not affect the EC50s obtained in the assay for FTY720-P: EC50 values of 0.08 nM and 0.09 nM were obtained at 3 and 18 h, respectively. In Figures 1G and H , the EC50s for FTY720-P and BAF312 are compared for S1P1 and S1P3 and are consistent with the GTPγS and cAMP results in that FTY720-P is a potent (0.09 nM) S1P1 agonist and a less potent (36 nM) partial (37% efficacy) S1P3 agonist. In contrast, BAF312 is completely inactive against S1P3, whereas it is potent against S1P1 (2.9 nM). All compounds were profiled against all four receptors ( Tables 1 and 2 ) in both agonist and antagonist mode.
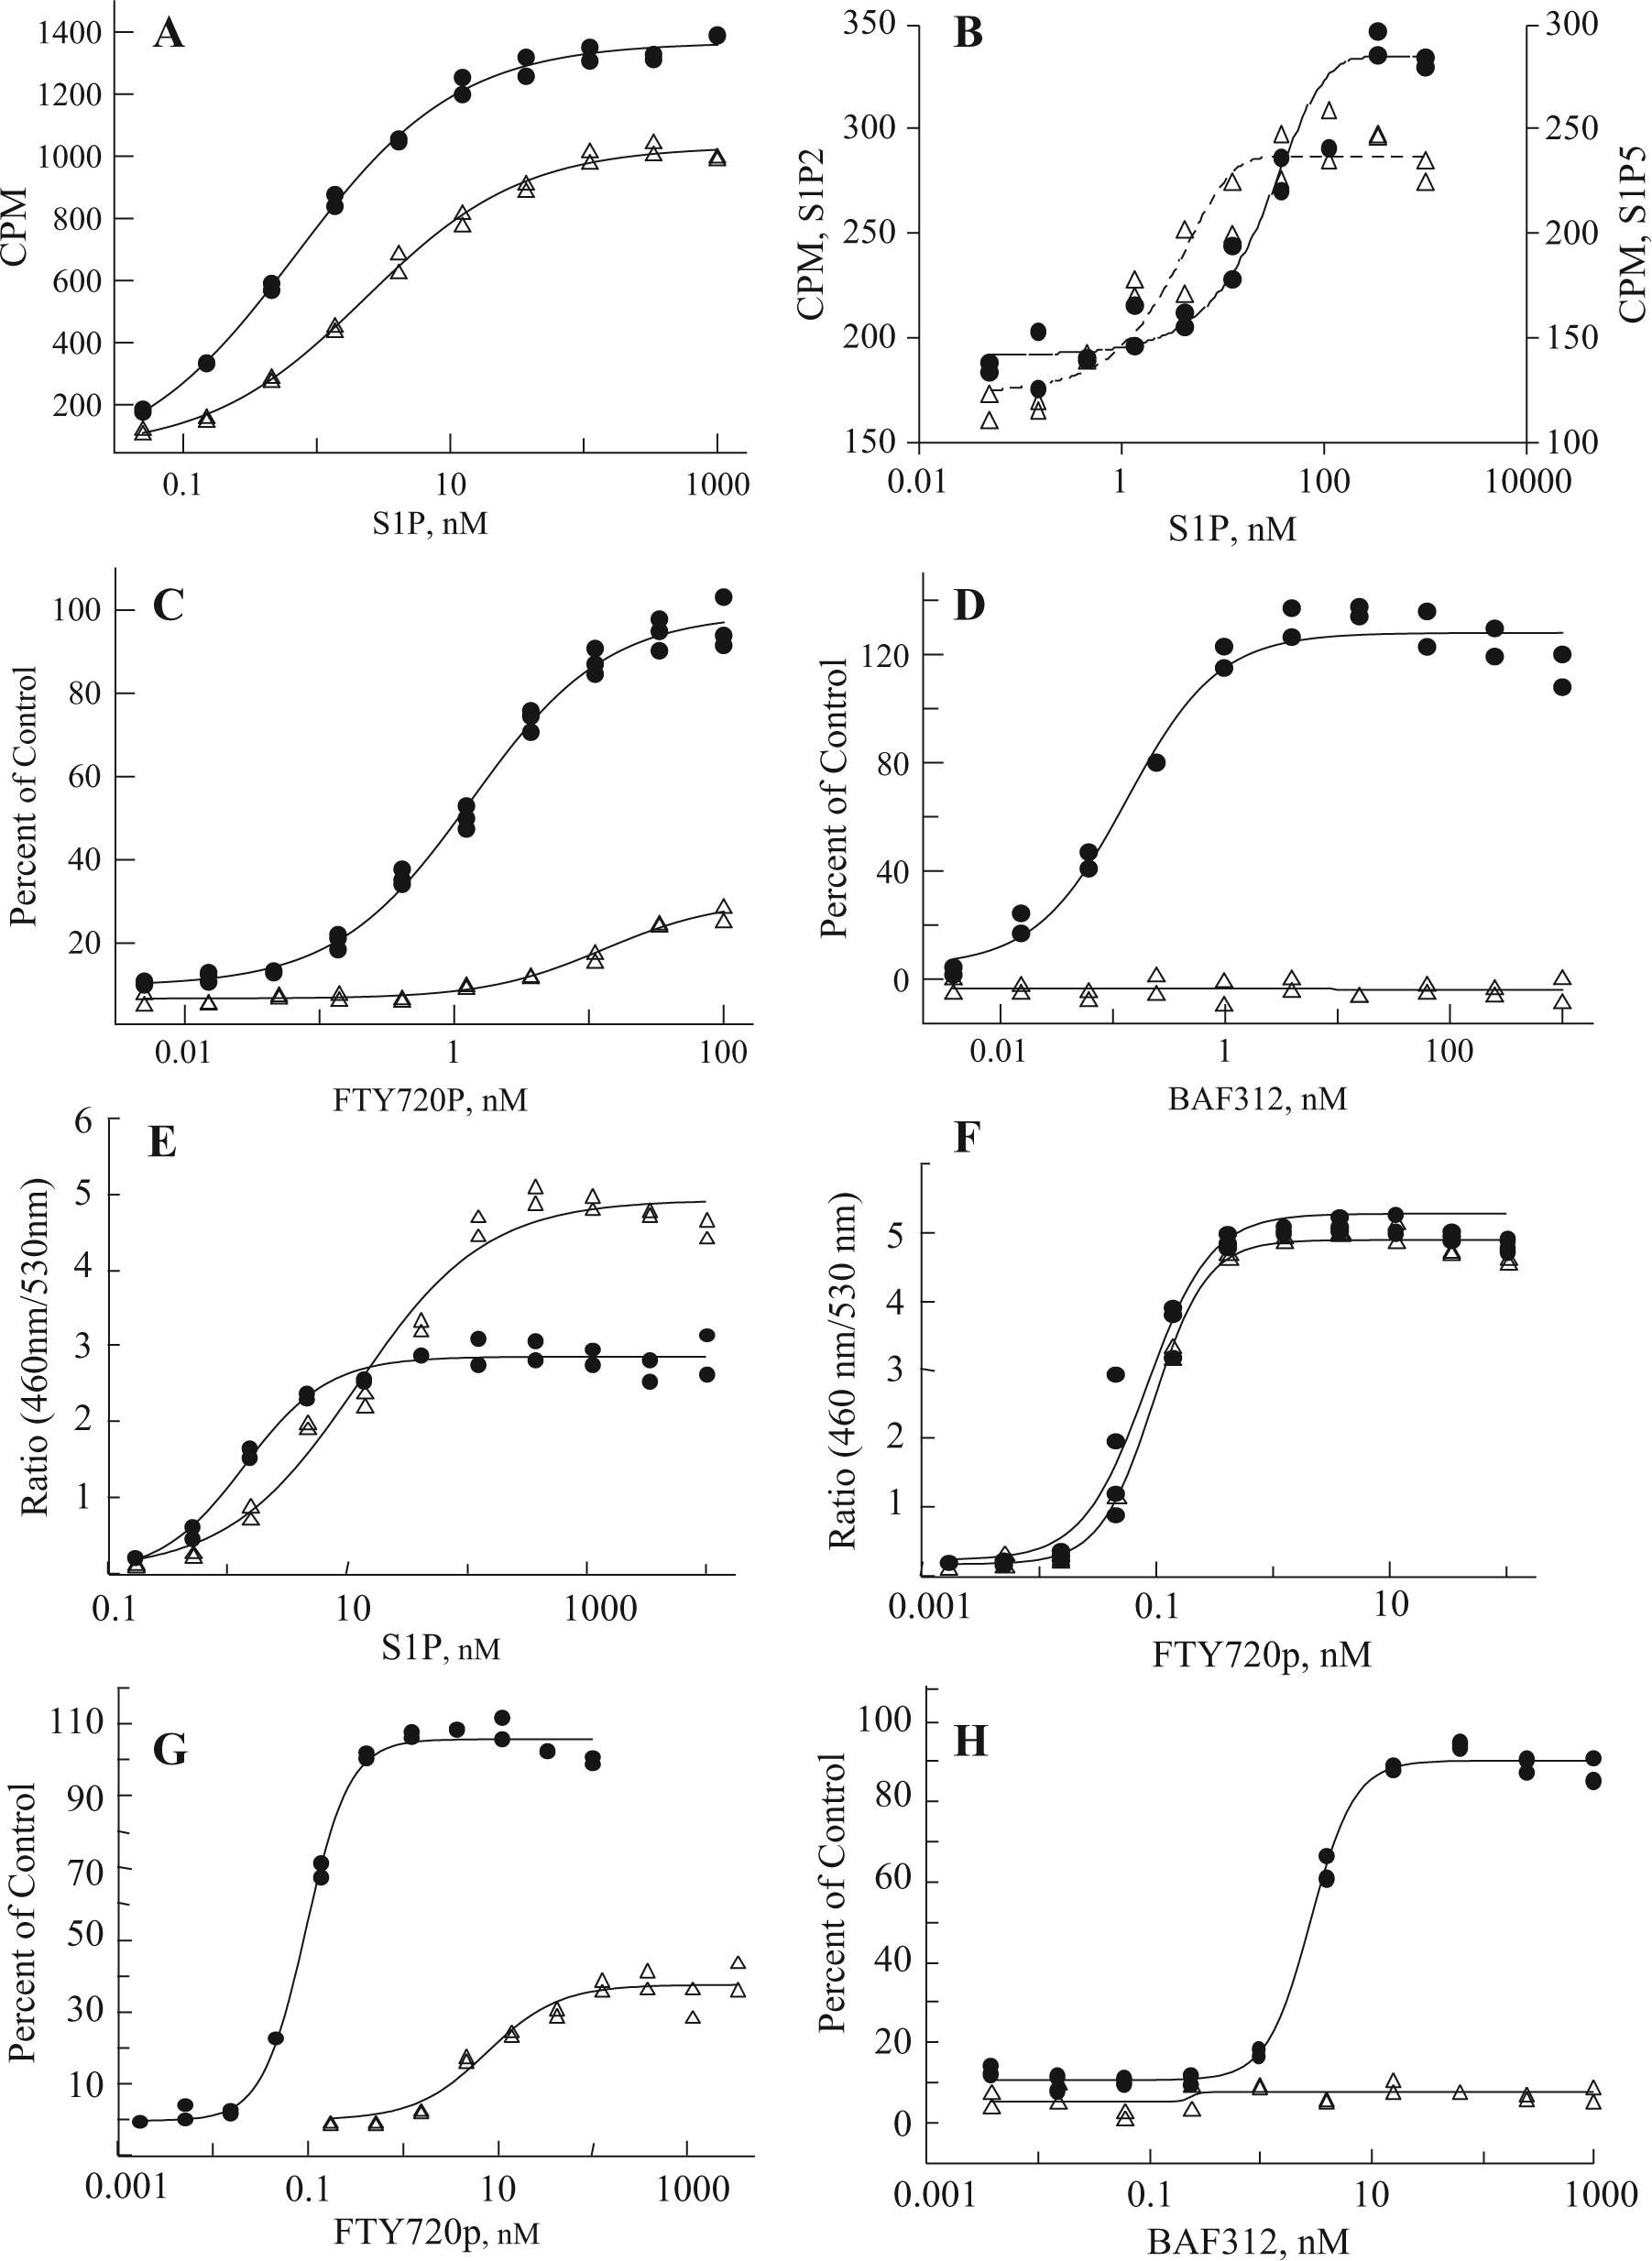
Optimized GTPγS and β-arrestin (Tango) recruitment assays for S1P receptors. CPM, counts per million. GTPγS assays (
Comparison of EC50s for S1P1 across multiple assay formats.
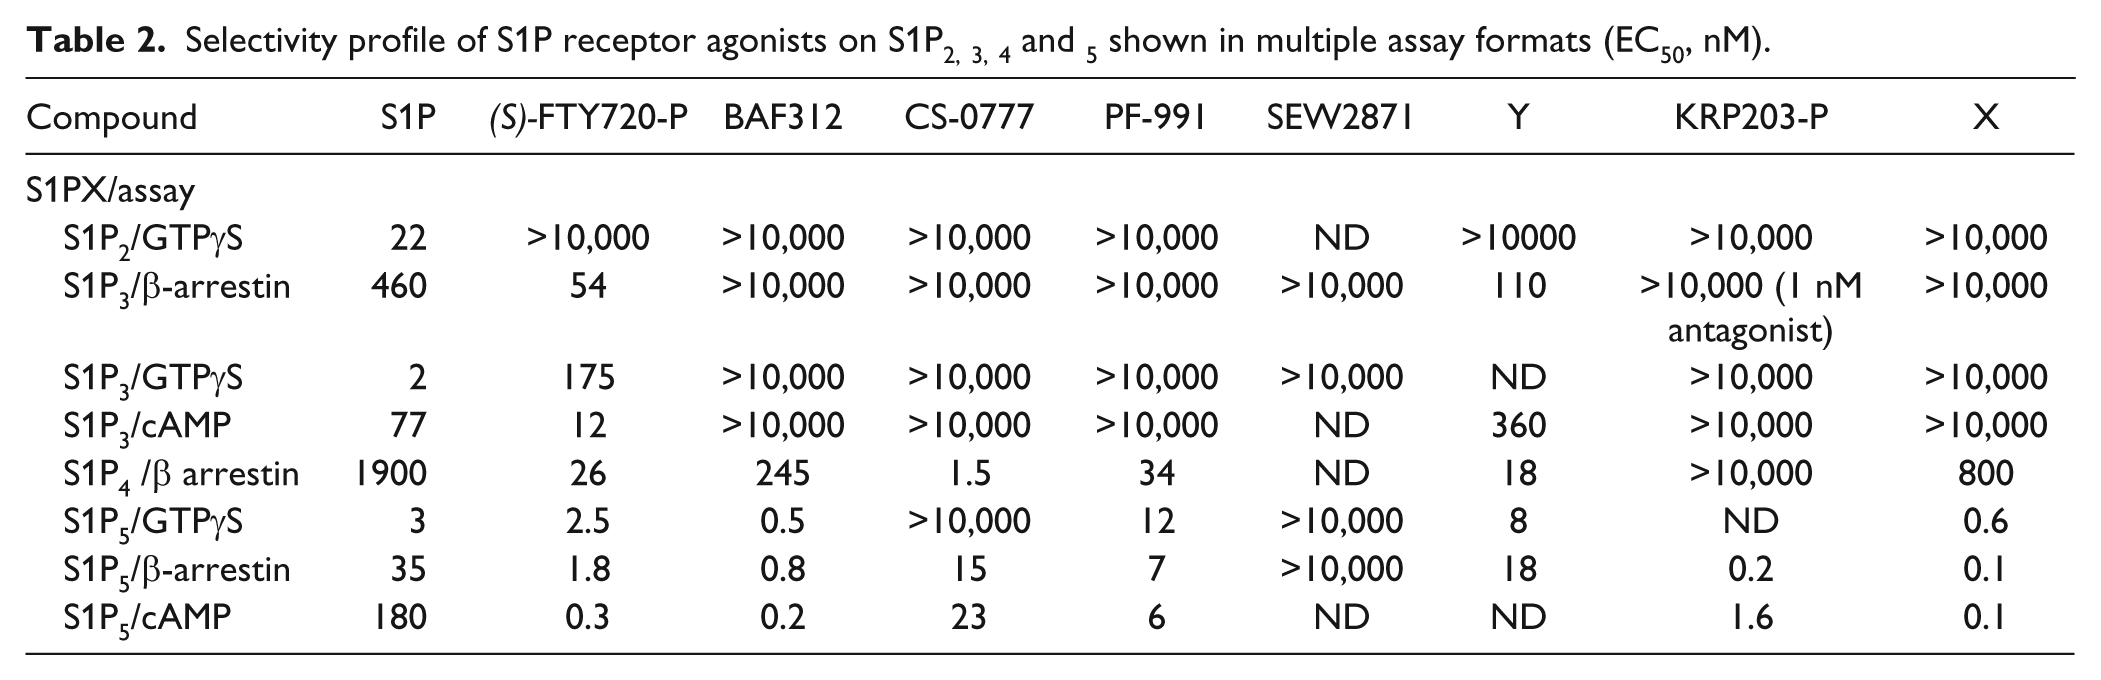
Selectivity profile of S1P receptor agonists on S1P2, 3, 4 and 5 shown in multiple assay formats (EC50, nM).
We also evaluated cAMP and Ca2+ flux assays for S1P1, 2, 3 and 5 in CHO cells stably expressing the receptors.
Figure 2
shows that although the fold increase is small for cAMP on S1P1 and S1P3, the natural ligand, S1P, gives a clear dose response with reproducible data and EC50s of 580 nM and 98 nM, respectively. Similar to what we observed in the GTPγS format, both FTY720-P and BAF312 are potent S1P1 agonists (EC50s of 0.4 nM and 0.01 nM, respectively), whereas only FTY720-P is potent against S1P
Cyclic AMP (cAMP) assays for human S1P1 and S1P3. (
We then developed a flow cytometry assay using the transfected hS1P1 CHO cells to monitor receptor internalization from the cell surface as a surrogate for receptor down-regulation. As shown in
Figure 3A
, there is a fold increase in the assay of 8X for BAF312, in which the highest compound dose is compared with isotype control and background. The untransfected CHO cells have a staining pattern similar to the isotype control, demonstrating specificity of the antibody for human S1P1 receptor (
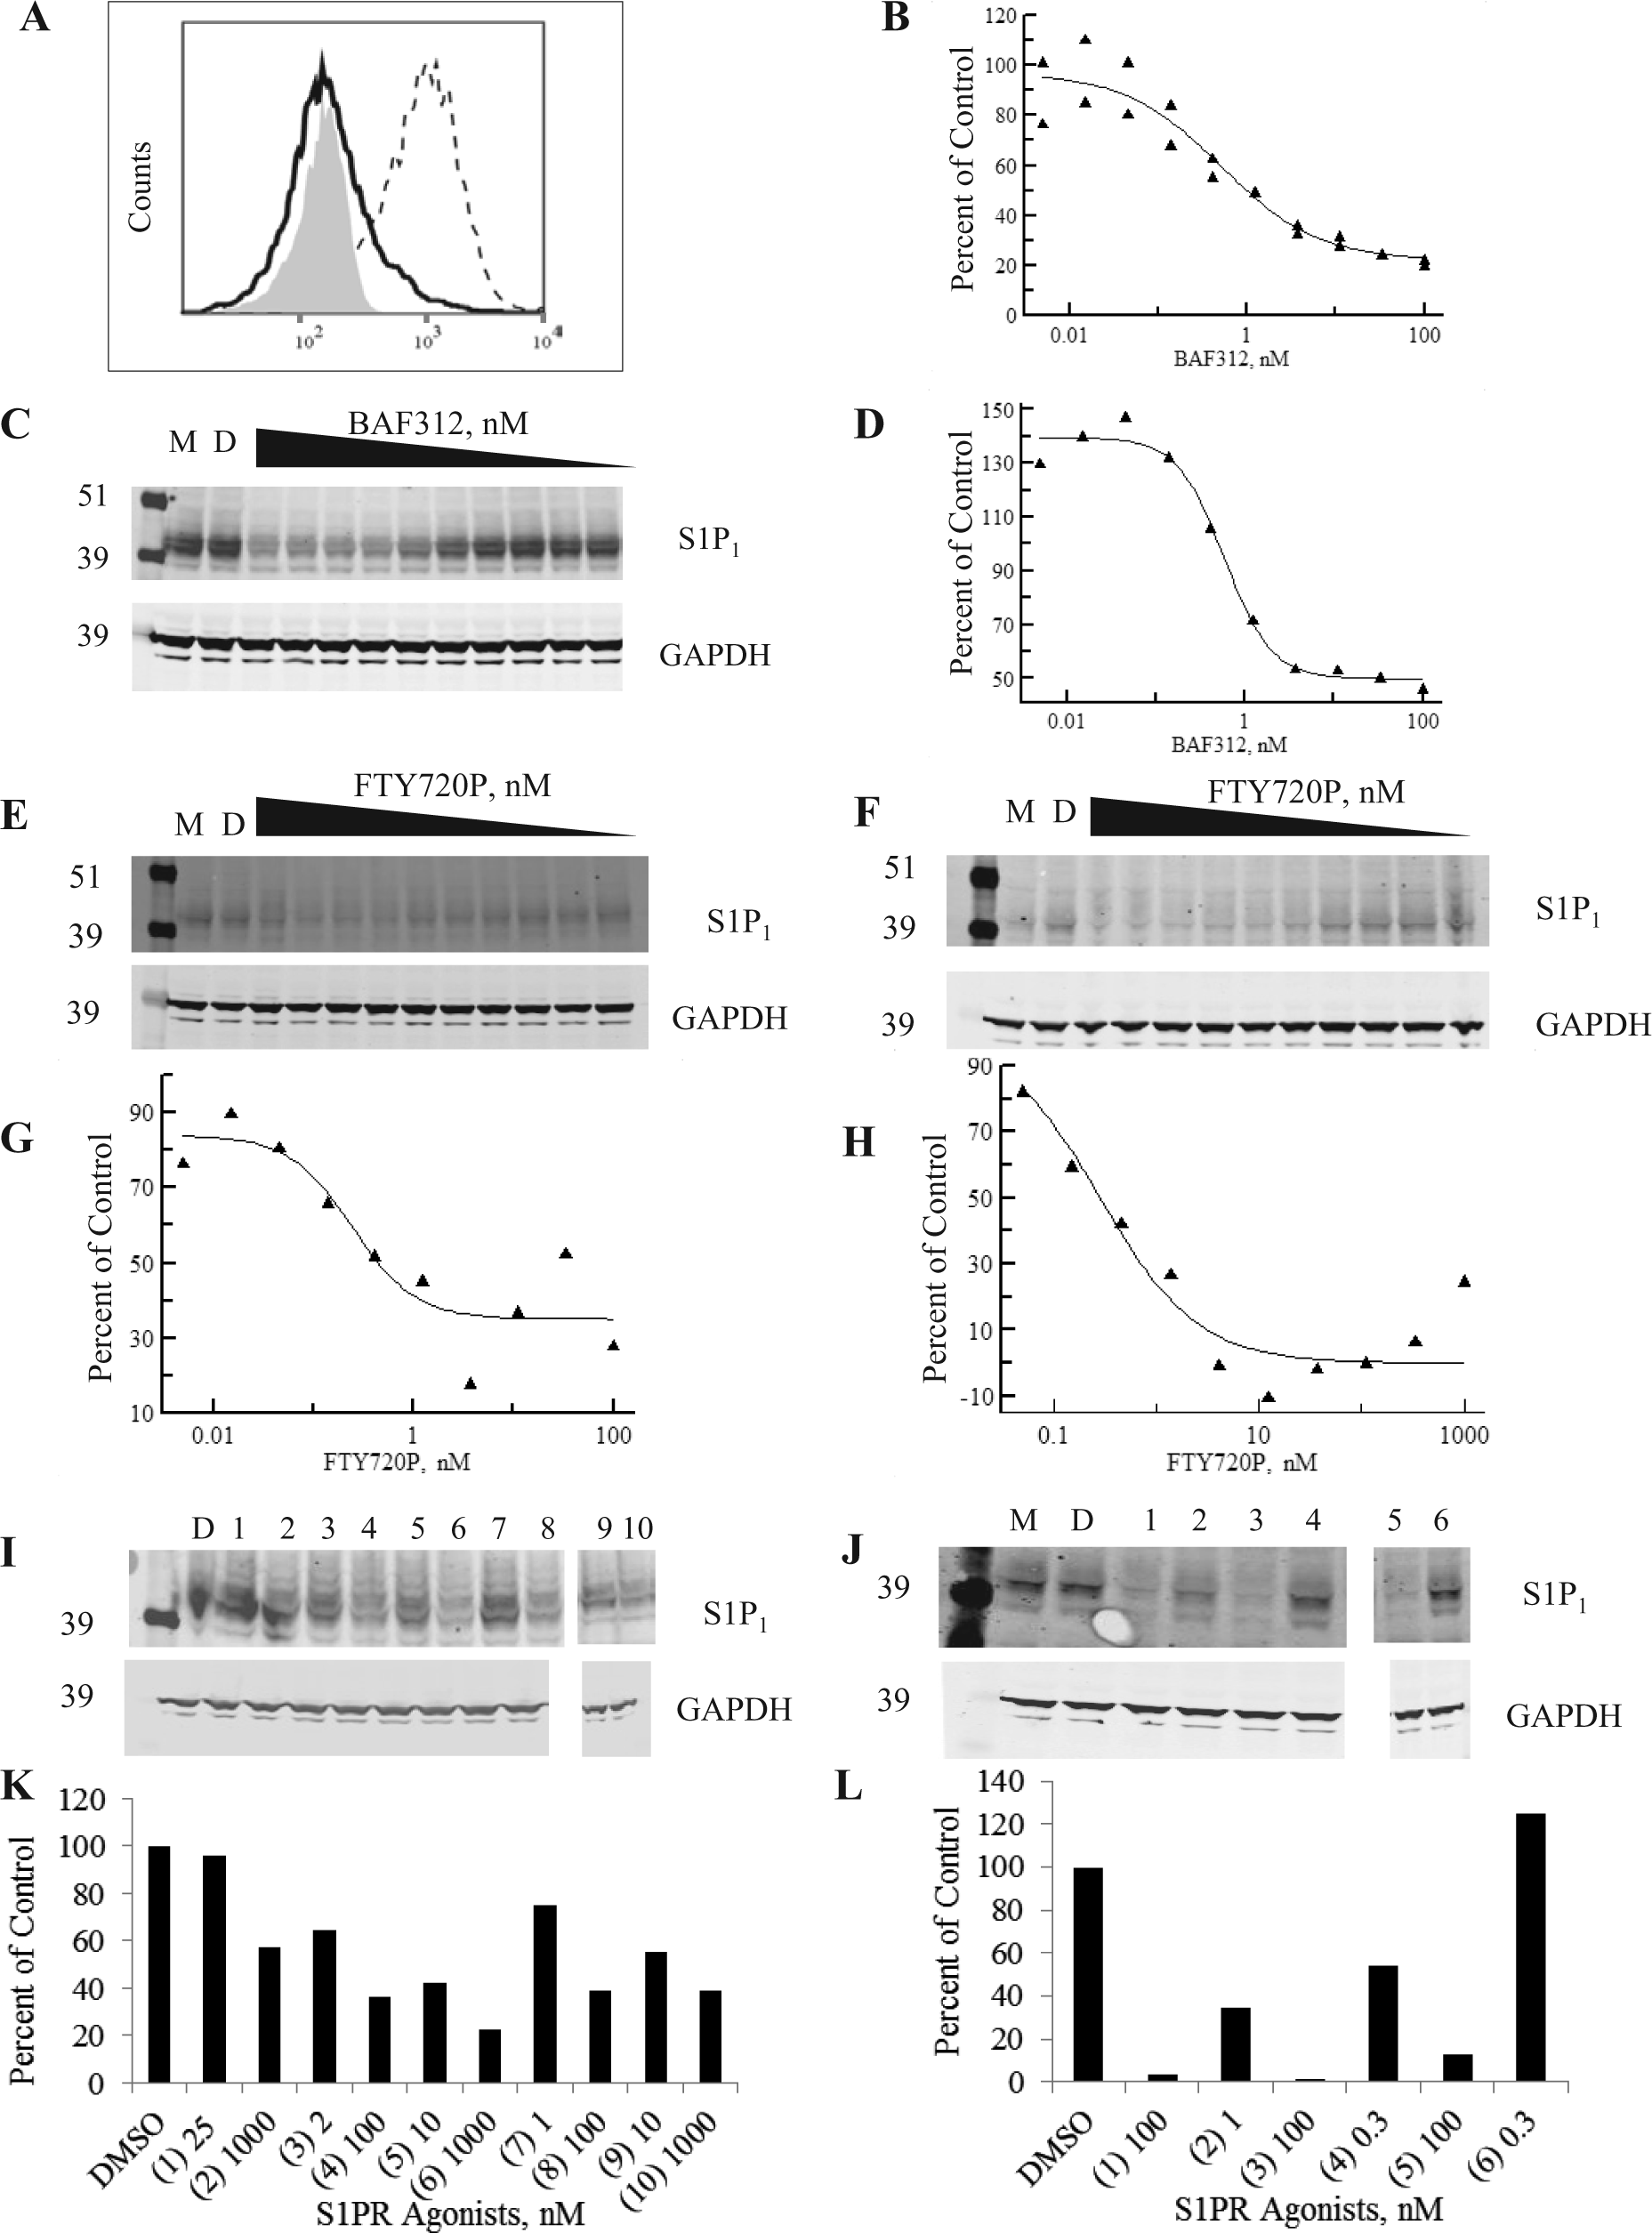
Receptor down-regulation and degradation assays for S1P1 on S1P1 CHO cells and human umbilical vein endothelial cells (HUVECs). (
We also evaluated receptor down-regulation and degradation on HUVECs, which endogenously express S1P1 9 and where the S1P1 receptor degradation upon treatment with functional S1P1 antagonists has previously been described. 10 We confirmed S1P1 and S1P3 transcripts were present by quantitative PCR (qPCR; data not shown) and evaluated the cells for protein expression. We did not detect cell surface protein by flow cytometry but could detect the protein by Western blot. We therefore performed a receptor degradation assessment in parallel for hS1P1 CHO cells and HUVECs and found similar EC50s, as shown in Figure 3E , F (Western blots) Figure 3G , H (densitometry) for FTY720-P; EC50s ranged from 0.2 to 0.6 nM in hS1P1 CHO cells (n = 3) and from 0.3 to 1.3 nM in HUVECs (n = 3), illustrating the relevance of the hS1P1 CHO cells for evaluating receptor degradation.
Given this correlation, we evaluated a number of other compounds in the hS1P1 CHO cells by receptor degradation (complete dose response; Table 1 ) and by Western blot at more limited concentrations (EC50 and EC90 of each compound) to determine if receptor degradation is tracking with down-regulation as for FTY720-P ( Fig. 3I and J , Western blots; Fig. 3K and L , densitometry) or whether it is occurring at significantly higher concentrations, as was observed for the natural ligand S1P ( Table 1 ). We observed that the EC50s for receptor down-regulation and degradation tracked for all S1P1 agonists profiled.
Receptor selectivity for S1P1–5 was tested using two overlapping sets of assays: GTPγS for S1P1, 2, 3 and 5 and β-arrestin for S1P1, 3, 4 and 5 (as appropriate reagents were not available for GTPγS for S1P4 or β-arrestin for S1P2). As shown in Table 2 , although some variation exists between reported EC50s in different assay formats, the overall selectivity profile is consistent. All compounds are inactive against S1P2, GTPγS assay, also inactive, in other assay formats (data not shown in Table 2 ). FTY720-P and compound Y are potent against S1P3, 4 and 5. This is consistent with published data for FTY720. 11 BAF312 is selective against S1P1 and 5 as reported by Novartis, 5 has limited activity on S1P4, and is completely inactive on S1P2 and S1P3. CS-0777, PF-991, and compound X have similar profiles: potent against S1P5 and S1P4 and inactive against S1P2 and S1P3. SEW2871 is described as an S1P1 receptor agonist, 12 although is appears somewhat less potent in our hands. KRP203-P is potent against S1P5 and shows no agonism against S1P2, 3 or 4 ( Table 2 ). However, we observed that it is a potent antagonist against S1P3 in the β-arrestin format (IC50 of 1 nM). All compounds herein were profiled in both agonist and antagonist mode, and KRP203-P was the only compound that displayed antagonism versus S1P3.
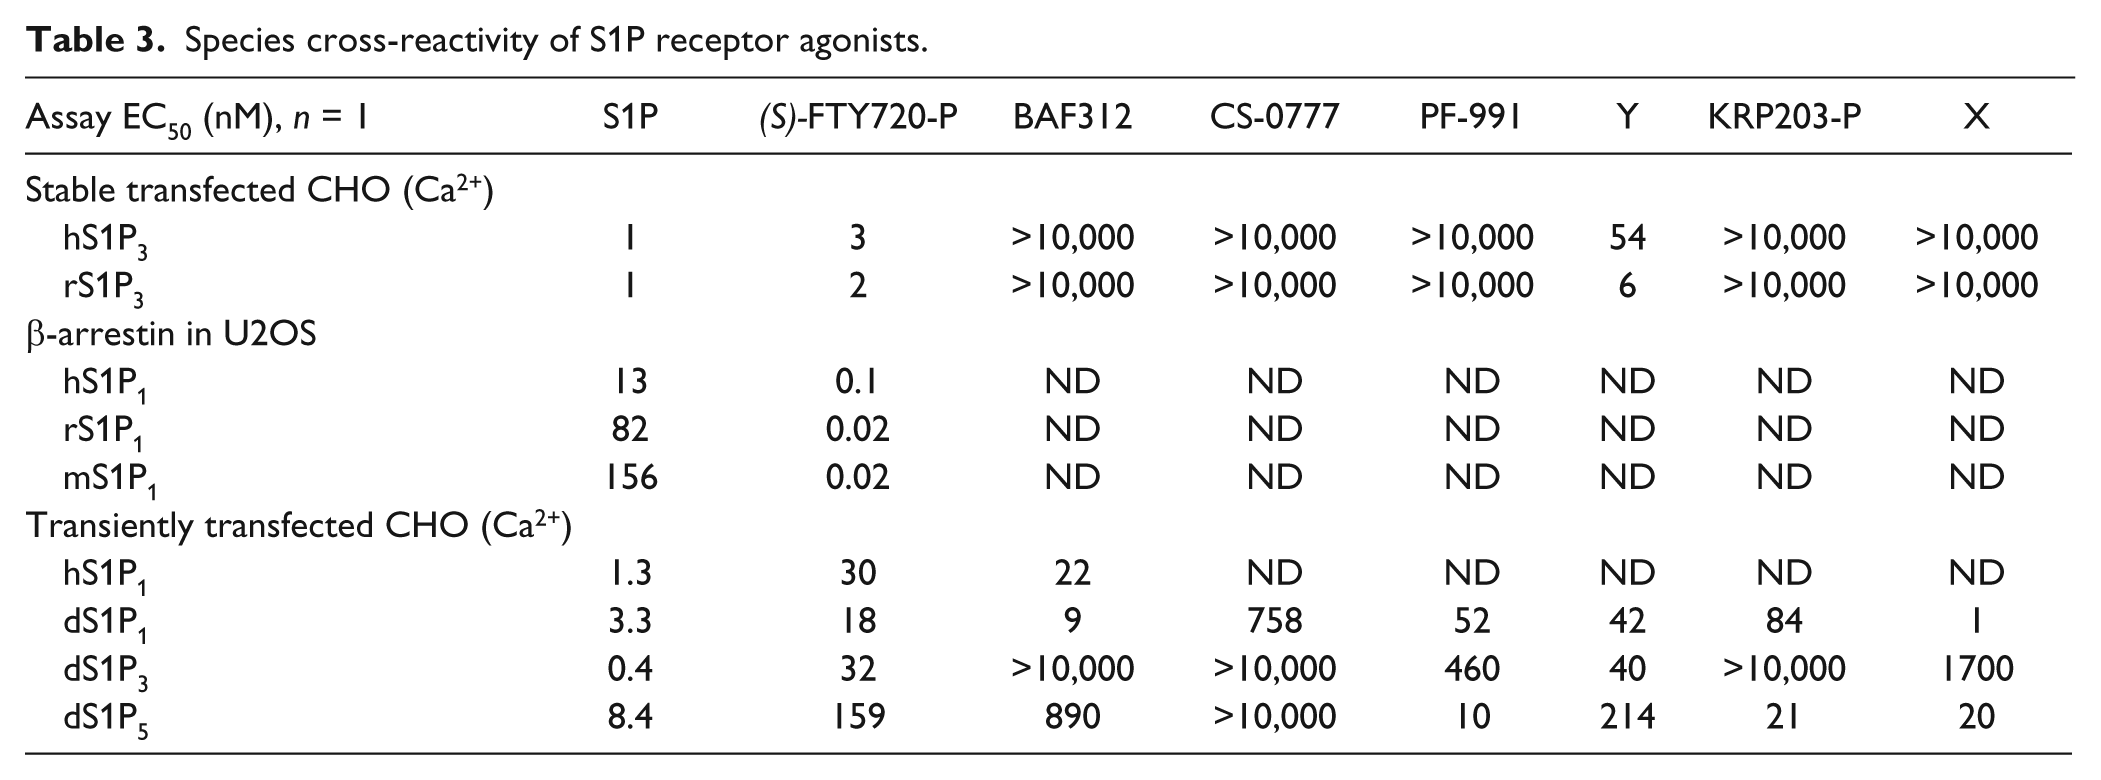
Several compounds were evaluated for their potency against rat, mouse, and dog S1P1, 3 and 5 receptors ( Table 3 ). As reported, FTY720-P cross-reacts with all three species. 13 We found that for all compounds tested, their species cross-reactivity was consistent with the human selectivity profile.
Species cross-reactivity of S1P receptor agonists.
Discussion
We developed and compared different assays to monitor S1P receptor engagement, including GTPγS, cAMP reduction, calcium flux, β-arrestin recruitment, receptor down-regulation from the cell surface, and receptor degradation. We have used these assays to compare the mechanism of action and selectivity profile of S1P receptor family agonists including the clinically validated FTY720-P as well as other candidates and tool compounds. Furthermore, we demonstrate that although these compounds have different selectivity profiles, they all signal in a similar way through S1P1, leading to receptor down-regulation from the cell surface, and in contrast to the natural ligand, S1P, they all lead to receptor degradation.
Independent of assay format, the EC50s are remarkably conserved, despite different transfected cell lines used (three different backgrounds in these cases), and so we believe GTPγS and β-arrestin represent a useful pair of assays for assessing compound potency and relating early events in S1P1 receptor activation to functional antagonism. Given the likely endogenous expression of S1P receptors in CHO cells, we do not believe that measurement of Ca2+ in those cells gives accurate estimations of compound potencies.
One challenge in working with this class of compounds is that they are often phosphorylated in cells/in vivo (by sphingosine or sugar kinases), leading to higher activity than the unphosphorylated compound, and hence they are described as prodrugs. Patent coverage by other companies prevents us from using both the prodrug and the more active (phosphate-P) form of all the compounds in parallel in this study. Because we are most interested in the cellular readout, we focused our attention on compound activity in longer-term cellular assays (e.g., 18 h incubation in β-arrestin, where phosphorylation of these compounds can likely occur). In these assays, we are likely measuring a combination of cell permeability and activity of phosphorylated/dephosphorylated compounds. Nonetheless, as we ultimately want to know how the compounds function in cells, we believe that the β-arrestin assay is the most relevant format.
Examples of this may be CS-0777 ( Table 1 ), which can be phosphorylated and does not appear as potent in GTPγS as in β-arrestin. This is consistent with SEW-2871 as a nonphosphorylatable compound whose potencies are relatively insensitive to assay format. We can also speculate that this is due to differences in assay conditions. A third possibility, which may also explain the somewhat divergent data in cAMP format, is that different compounds behave as biased agonists, activating one signaling pathway more than another. This has been alluded to for FTY720 on S1P3, 14 and differences in EC50 values between different formats are indeed more pronounced for S1P3 ( Table 2 ) than for S1P5. For this reason, it is important to link the upstream signaling readout with a more biologically relevant downstream readout—receptor degradation, in this case.
To that end, we linked the initial events in cell signaling with the internalization of the S1P1 receptor from the cell surface in a feasible assay format and demonstrate that this can be associated with receptor down-regulation depending on the compound profile. The down-regulation observed in the hS1P1 CHO cells parallels that observed in HUVECs endogenously expressing S1P1, building confidence that CHOs overexpressing S1P1 can be used as biologically relevant reagents to measure this process. Calcium flux measurement, however, does not appear to represent a useful system because of background effects observed in CHO cells, and although the rank order of compound potencies was maintained in this format, they were significantly less potent, which may lead to loss of sensitivity/failure to identify hits in this format.
On a technical note, we observed that the S1P2 and 5 cellular assays had smaller-fold stimulations than their counterpart assays on S1P1 and S1P3 in all formats. This window is likely mediated by the degree of receptor expression in the different membrane preparations and cells. Although we cannot demonstrate this directly because of lack of specific antibodies for all S1P receptors, it is supported by qPCR on some of the cell lines (data not shown).
Our comparisons of different assay formats in parallel for S1P1 allow us to compare different compounds directly, which have been profiled using different assays in the literature. This is important in understanding the relative selectivity profiles of tools and clinical candidates and the relative value of different assay systems.
We have also compared multiple compounds (or representative compounds of series) that are in clinical development in all our assay formats (in both agonist and antagonist mode, where possible) including across different species. This allows us and others to review and compare published in vitro data and reports and critically review in vivo pharmacology data, particularly when it comes to evaluating off-target effects based on differential selectivity profiles (e.g., the antagonism observed for KRP-203-P on S1P3 may explain the relatively weaker impact on bradycardia in rats than that observed with FTY720 15 ).
Based on our analysis, it may be difficult to differentiate any of these compounds from FTY720 from a safety point of view, if it is mediated by activity on S1P1, as they all induced S1P1 receptor degradation, which has been suggested to be causative in inducing vascular leak16,17 and may be associated with the reported lung phenotypes. However, subtleties in agonism/antagonism on the other receptors (e.g., S1P3 antagonism that may protect against cardiac effects and differences in agonism on S1P4 that may lead to some positive pharmacological impact on lymphocytes) may lead to differences in the efficacy and safety profile of these compounds under clinical evaluation.
In conclusion, we recommend a detailed analysis of the downstream signaling events when developing agonists for G-protein–coupled receptors and a thorough evaluation of tool compounds in all available formats to characterize lead series. We conclude that for S1P receptors, a combination of GTPγS and β-arrestin assays can provide a robust data set to drive structure-activity relationships in medicinal chemistry programs.
Footnotes
Acknowledgements
We thank Nuruddeen Lewis for reading the manuscript.
Declaration of Conflicting Interests
The authors declared no potential conflicts of interest with respect to the research, authorship, and/or publication of this article.
Funding
The authors received no financial support for the research, authorship, and/or publication of this article.