
Abstract
The health and disease-related biology of the CXCR4 chemokine receptor presents the challenge of finding a small molecule that can bind CXCR4 and block T-cell tropic human immunodeficiency virus type 1 (HIV-1) cell entry, while preserving the ability of CXCR4 to respond to its native ligand, CXCL12. HIV entry into the host cell involves the interaction of the viral envelope glycoprotein gp120 binding to CD4, followed by a rearrangement in gp120, and subsequent interaction with the chemokine receptor CXCR4 or CCR5. These initial events can be re-created in a cell fusion assay that represents a surrogate system, mimicking the early stages of viral entry via these host cell receptors. In the current study, a T-tropic HIV cell fusion assay was established using U2OS cells expressing the envelope glycoprotein gp160 from the T-tropic HIV NL4-3 and HeLa cells expressing CD4 and CXCR4. Detection of the cell fusion event was based on a Gal4/VP16-activated β-lactamase signal and was measured by automated microscopy or laser scanning plate cytometry. Changes in morphology associated with cell fusion were combined with β-lactamase activity to generate results with robust assay statistics in both 384-well and 1536-well plates. Compounds were subsequently characterized by CXCR4 signaling assays to eliminate functional antagonists and allow the identification of a function-sparing HIV entry inhibitor.
Introduction
Human immunodeficiency virus type 1 (HIV-1) infects CD4-positive target cells through interaction with one or both of two chemokine receptors, CCR5 and CXCR4. The discovery of the molecular mechanisms of HIV entry has enabled mechanism-based strategies for high-throughput screening (HTS) to find small-molecule antagonists of these host coreceptors. Thus, a new class of HIV antiretroviral therapeutic agents has emerged based on the inhibition of viral entry. The ability of HIV to develop resistance-associated variants that can overcome current combination antiretroviral therapy (cART) consisting mainly of drugs directed against viral targets (i.e., reverse transcriptase, HIV protease, integrase 1 ) is well documented. This new class of HIV entry inhibitors targeting host cell factors involved in the spread and pathogenesis of HIV has the potential to provide a much higher barrier to the development of clinical resistance.
Entry of HIV-1 into target host cells is mediated by the coordinated interaction between the HIV envelope glycoprotein (Env) on the virion surface with the CD4 receptor and the coreceptors CCR52,3 and/or CXCR4. 4 The mature Env protein is composed of a trimer of gp120 envelope glycoproteins and the noncovalently associated gp41 molecules, both of which are proteolytically derived from the precursor envelope glycoprotein, gp160. 5 The membrane-spanning segments of gp41 anchor Env to the viral surface. When the exposed gp120 homotrimer binds to CD4 on the host cell surface, a conformational change occurs that facilitates coreceptor binding. 5 The subsequent binding of either CCR5 or CXCR4 then produces a conformational change triggering insertion of the fusion peptide gp41 into the cell membrane, resulting in the fusion of the viral and cell membranes. This fusion event allows entry of the viral genetic components for subsequent replication events and the perpetuation of the viral replication cycle.
The hypervariable V3 loop and bridging sheet regions of gp120 are the main determinants for chemokine coreceptor usage and subsequent target cell type. Macrophage-tropic (M-tropic) viruses use CCR5 (R5) and are primarily responsible for transmission of HIV. In the case of T-cell tropic (T-tropic) viral strains, CXCR4 (X4) is the primary coreceptor used; however, dual-tropic viruses (X4/R5) are also prevalent. X4 and X4/R5 viruses are largely associated with the later stages of the disease, which results in a more accelerated decline in CD4-positive T cells and progression to the onset of AIDS.
The search for an HIV entry inhibitor targeting CCR5 was initiated following the discovery of the coreceptor and the finding that humans homozygous for a 32–base pair deletion in CCR5 are not susceptible to HIV-1 infection 6 and do not exhibit any significantly negative phenotypes. 7 Small-molecule discovery programs have subsequently identified several orthosteric and allosteric modulators of CCR5 that block M-tropic HIV viral entry 8 that do not exhibit any mechanism-based adverse effects. Maraviroc and vicriviroc are both examples of CCR5 antagonists shown to be specific M-tropic HIV-1 entry inhibitors.9,10 Maraviroc has subsequently received regulatory approval for use in treatment-experienced M-tropic–only HIV-1–infected patients. 11
AMD3100 was first discovered as an antiviral compound with activity against HIV in 1992. 12 Upon the discovery of CXCR4 as an HIV coreceptor in 1996, AMD3100 was subsequently shown to act as a CXCR4-specific orthosteric antagonist that inhibits T-tropic HIV-1 entry. 13 Since that time, development of AMD3100 as well as other CXCR4 antagonists has been hampered by the fact that CXCR4 and its single and unique cognate ligand, CXCL12, 14 are critical in a number of important biological processes, in both health and disease. Thus, inhibition of CXCL12 binding and function via CXCR4, while effective against HIV entry, may lead to numerous deleterious side effects. However, an alternative approach would be to identify an allosteric modulator of CXCR4, which could potentially inhibit HIV entry via CXCR4 yet still allow normal functional interaction of CXCL12 with CXCR4. This allosteric inhibition of HIV entry has been demonstrated for CCR5 by Muniz-Medina et al., 8 who described and characterized several orthosteric and allosteric modulators of CCR5 that inhibit HIV entry. For CXCR4, it is unlikely a simple receptor binding or functional assay is sufficient to find such an inhibitor since these are specific for the orthosteric interaction of CXCR4 and CXCL12. A more desired approach would be to employ a relevant HIV functional phenotypic assay as a primary screen, to find molecules that inhibit HIV entry via CXCR4. Primary screen hits would then be followed by an array of secondary receptor functional and binding assays to identify allosteric modulators with a more ideal profile.
The HIV cell fusion assay serves as a surrogate cellular model for HIV entry. In prior incarnations, transcriptional activators and their cognate responsive elements had been placed upstream of a reporter gene and were compartmentalized into the effector and target cell lines. Upon cell fusion and mixing of each cell cytoplasm, expression of the reporter gene marked the successful combination of these transcriptional elements. To date, the reporter gene–based cell fusion assays have used whole-well detection of the reporter gene signal, such as colorimetric or fluorometric detection of β-galactosidase,4,15 measurement of luminescence (luciferase),16,17 or whole-well fluorometric detection of β-lactamase or GFP expression. 18 In this report, we improved upon the reporter gene utilization approach by combining it with the direct detection of morphological changes of the cell fusion event. We took advantage of the unique fluorescence resonance energy transfer (FRET)–based substrate dyes for the reporter gene β-lactamase 19 in combination with the measurement of morphological changes using single-cell analysis and high-content instruments. As a proof of concept, we used this assay to screen ~120,000 compounds from a proprietary library and profiled the hit compounds in a CXCR4 binding assay, HIV pseudovirus entry assay, and fluorometric imaging plate reader (FLIPR) calcium flux assay.
Materials and Methods
Cell Lines
HeLa and U2OS cell lines were obtained from the American Type Culture Collection (Manassas, VA) and were grown in complete medium: minimum essential medium, supplemented with 10% heat-inactivated fetal bovine serum (FBS) (v/v), 2 mM glutamine, 50 U/mL penicillin, 50 U/mL streptomycin, and nonessential amino acids (Life Technologies, Carlsbad, CA). Derived stable cell lines were grown in complete medium supplemented with the appropriate selective antibiotic: HeLaCD4-23, 4 µg/mL blasticidin; HeLaCD4/VP16, 4 µg/mL blasticidin and 500 µg/mL G418; and U2OS-UASbla7, 100 µg/mL hygromycin.
A stably transformed HeLa cell line (HeLaCD4-23) expressing human CD4 was selected from a blasticidin-resistant population transduced with a lentivirus encoding the human CD4 gene downstream of the CMVie promoter (Life Technologies). Infected populations were subjected to blasticidin selection (4 µg/mL) for 1 week, and resistant colonies were selected for expression of CD4 using flow cytometry.
The HeLaCD4-23 cell line (HeLaCD4/VP16) stably expressing the Gal4/VP16 transactivator was isolated from a G418-resistant population transfected with pTS336. Briefly, plasmid pTS336 is a house-engineered plasmid using the vector plasmid pCIneo (Promega, Madison, WI) encoding the fusion protein comprising of the yeast GAL4 DNA-binding domain (amino acid residues 1–147) fused in frame to the herpes simplex virus 1 VP16 transcription activation domain (amino acid residues 411–456). The PCR template sequences for the GAL4 DNA binding domain and the VP16 transcription activation domain were obtained from Promega plasmids pBIND and pACT, respectively. Standard PCR cloning methods were used to subclone the fusion protein into pCIneo. After transfection with pTS336, individual colonies were selected from G418-resistant cultures after 2 weeks of 1 mg/mL G418 selection. Clones were expanded and then transfected with pGL4.31 (Promega), which contains the UASg sequence upstream of the luciferase gene. Transient luciferase assays were performed 48 h after Fugene6 (Roche, Indianapolis, IN) transfection to select the best clone.
The effector cell line, U2OS-UASbla7, was established following lentivirus transduction and hygromycin selection of single clones. The lentivirus stock was produced using the Virapower Packaging Mix in HEK293FT cells together with pLenti4-hygro-UAS-bla following the manufacturer’s protocols (Life Technologies). Final clone selection and characterization were carried out using transient β-lactamase reporter gene assays performed 48 h after transfection with pTS336.
BacMam Virus Construction
A BacMam baculovirus encoding the genomic complementary DNA (cDNA) sequence of HIV-1 rev, vpu, and env sequences of HIV-1 NL4-3 (reference HIV-1 strain HXB2 nt 5970–8795) was custom engineered and produced in high titer stock quantity by Life Technologies.
BacMam Transduction
Liquid nitrogen frozen stocks of U2OS-UASbla7 were thawed and washed twice in Dulbecco’s phosphate-buffered saline (D-PBS). Cell suspensions with 2.5 million cells per T175 flask were incubated at 37 °C, 5% CO2 for 48 h in Opti-MEM (Life Technologies) supplemented with 2% FBS (v/v). For accurate multiplicity of infection (MOI) determination, one flask was sacrificed to determine viable cell titer per flask. Flask culture media were replaced with Opti-MEM supplemented with 2% FBS (v/v), and an appropriate volume of BacMam HIVgp160 virus stocks was added to attain desired MOI. Flasks were incubated overnight at 37 °C in 5% CO2. Cell monolayers were washed twice with D-PBS, treated with Enzyme-free Cell Dissociation Buffer (Life Technologies), harvested, and washed. Final cell preparations were suspended at 10 million cells per 1 mL of Cell Culture Freezing Medium (Life Technologies). The 1-mL aliquots were stored in liquid nitrogen until ready for use.
Western Blot
U2OS-UASbla7 cells were transduced by BacMam HIVgp160 virus at varying MOI. Cell monolayers were harvested, washed, and then lysed in RIPA Buffer (Pierce, Rockford, Ill). For each MOI sample, electrophoresis was carried out using 40 µg, prepared in LDS Sample Buffer using NuPage 4% to 12% gels (Life Technologies). Separated proteins were electrotransferred onto polyvinylidene fluoride membranes, which were probed using 2 µg/mL rabbit pAb anti-gp120 MN HIV-1 (cat. 1321; Immunodiagnostics, Woburn, MA) and mouse mAb α-tubulin (cat. 3873; Cell Signaling Technology, Beverly, MA). Secondary antibodies used for the detection of immunoreactive species were goat anti–rabbit IR-Dye680 (cat. 926-32221; LI-COR Biosciences, Lincoln, NE) and goat anti–mouse IR-Dye800 (cat. 926-32210; LI-COR). The Odyssey Imaging System (LI-COR) was used to detect immunoreactive proteins.
Immunostaining and Flow Cytometry
HeLa and HeLaCD4-23 cells were harvested, washed, and then fixed using 4% formaldehyde (v/v) in D-PBS for 15 min at room temperature. Subsequently, cells were washed and suspended in block buffer (3% FBS [v/v], 0.1% Tween-20 [v/v] in D-PBS) for 1 h at room temperature. Primary antibodies or isotype controls were added at a final concentration of 2 µg/mL: CXCR4-specific monoclonal antibody 12G5 (BD Biosciences, Franklin Lakes, NJ), CD4-specific monoclonal antibody RPT-T4 (BD Biosciences), mouse IgG 2a,κ for CXCR4 isotype control antibody, or mouse IgG1 κ for CD4 isotype control antibody. Cell suspensions with antibodies were incubated overnight at 4 °C, followed by three washes with 0.1% Tween-20 (v/v) in D-PBS (D-PBST). Goat anti–mouse secondary antibody conjugated to Alexa Fluor 488 (Life Technologies) was then added followed by 1-h incubation at room temperature. Cell suspensions were washed three times in D-PBS, and samples were subjected to flow cytometry analysis using a 488-nm laser and 530/30-nm filter configuration. Fluorescent intensity units were recorded for 10,000 events and compiled into frequency histograms.
HIV Entry Assay/Luciferase Detection
HIV-1 pseudoviruses were produced in HEK293FT cells (Life Technologies) by calcium phosphate transfection of pNL4-3E-Luc+ and the appropriate HIV-1 envelope expression vectors (NL4-3, HXB2, and ADA) using ProFection Mammalian Transfection System (Promega). HIV-1 pseudovirus stocks were made from clarified culture supernatants 48 h after transfection. To assess susceptibility to test compounds, 2000 cells per well of HeLaCD4-23 cells were plated in white opaque 384-well plates (Matrix Technologies Corporation, Hudson, NH) and incubated overnight at 37 °C in 5% CO2. Serial 2-fold dilutions of compounds (final assay concentration range was 100 µM to 90 pM) were added to wells 1 h prior to the addition of HIV-1 pseudovirus. Plates were incubated for 72 h at 37 °C in 5% CO2, and then 25 µL per well of Bright Glo reagent (Promega) was added and luminescence detected using an EnVision instrument (PerkinElmer, Waltham, MA). Relative light units (RLU) were normalized to virus dose, measured as nanogram of p24, and percent inhibition was calculated as follows: 100 − [mean normalized RLU for HIV-1 pseudovirus treated/mean normalized RLU for HIV-1 pseudovirus untreated] × 100. Dose-response data were analyzed using a nonlinear regression four-parameter logistic curve fit program with GraphPad Prism software (GraphPad Software, La Jolla, CA). To determine the specificity of the luciferase signal generated by the pseudovirus entry assay and possible cytotoxic effects of the compounds on HeLaCD4-23 cells, replicate plates were prepared and incubated without pseudovirus. At 72 h, cells were fixed with Prefer fixative, and nuclei were stained using 1 µM Hoechst 33342 for 30 min. Plates were scanned using the Acumen eX3 (TTP LabTech, Melbourn, UK), and total cell counts were determined by the number of nuclear dye-positive objects. Percent inhibition of cell counts was determined using DMSO-treated wells as controls, and cytotoxic IC50 values were determined using GraphPad Prism software as outlined above.
β-Lactamase Assay
β-Lactamase assays were performed in both 384-well and 1536-well black poly-D-lysine-coated plates (Greiner Bio-One, Monroe, NC). Cells from frozen stocks were prepared in Opti-MEM supplemented with 2% FBS (v/v) at a cell density of 5000 cells per well for 384-well plate assays and 1000 cells per well for 1536-well plates. CCF4-AM reagent (LiveBLAzer; Life Technologies) was added at a final concentration of 1 µM at appropriate incubation intervals after cell plating. Using a single excitation wavelength at 405 nm, detection of dye substrate fluorescence at 520 nm (green) and β-lactamase product at 450 nm (blue) was done using the EnVision, the Pathway855 automated fluorescent microscope (BD Biosciences), or the Acumen eX3. Positive β-lactamase cells were defined using the ratio of relative fluorescent units (RFU) at a 520-nm emission wavelength over RFU at a 450-nm emission wavelength.
Image Capture and Merge
Fluorescent image capture of CCF4-AM substrate and product was accomplished using the BD Pathway855. The single excitation wavelength was produced through Chroma filter HQ405/20 (Chroma Technology, Bellows Falls, VT), and separate images were captured for each substrate and product emission results using Chroma filter HQ530/30 and Chroma filter HQ460/40, respectively. All raw images were captured using the same exposure time and fluorescent unit dynamic range and merged without further adjustment to images. Pseudo-color was applied for visual discrimination between emission wavelengths—green for uncleaved CC4-AM substrate emission and blue for β-lactamase-cleaved product emission.
FLIPR Calcium Flux Assay
HeLaCD4-23 cells were transfected with a plasmid expressing the chimeric G-protein Gqai3, 20 using Fugene6. Twenty-four hours after transfection, cells were plated in 384-well black plates (Greiner Bio-One) using 15,000 cells/well in 25 µL and further incubated overnight at 37 °C in 5% CO2. At 48 h after transfection, cells were loaded with 1 µM Calcium 4 dye (Molecular Devices, Sunnyvale, CA). For agonist mode, diluted compounds were applied, immediately followed by measurements by FLIPR (Molecular Devices), detecting fluorescent signals at 520 nm resulting from free intracellular calcium binding to the calcium dye. CXCL12 was used at 4 µM as a measure of 100% agonist activity. For antagonist mode, diluted compounds were applied and incubated for 30 min prior to the addition of 72 nM (EC90) CXCL12, followed immediately with FLIPR detection of calcium flux. AMD3100 was tested at 3 µM for 100% antagonist activity.
CXCR4 Binding Assay
Kit components were purchased from CisBio (Bedford, MA; labeled CXCL12, cat. L0012REDTag-lite; Tag-lite Chemokine CXCR4 prelabeled cells, cat. C1TT1CXCR4; Tag-lite Labeling Medium, 100 mL, cat. LABMED). The manufacturer’s protocol was followed. 21
Assay Statistics
Z′ was calculated using the equation defined by Zhang et al. 22 : Z′ = 1 – [(3 × StdDevuntreated + 3 × StdDevAMD3100-treated)/(Meanuntreated – MeanAMD3100-treated)]. Standard deviation is abbreviated StdDev.
Results
Validation of Cell Lines
To generate a CXCR4-dependent cell fusion assay, two cell lines had to be developed: one expressing the T-tropic HIV envelope glycoprotein Env (effector cells) and one expressing the HIV coreceptors CD4 and CXCR4 (target cells).
For the development of the effector cells expressing T-tropic HIV Env, a BacMam virus was constructed containing the HIV strain NL4-3 gp160 envelope glycoprotein sequences (HXB2 reference sequences 5970–8795), which was used to transduce U2OS cells. MOI studies were performed in U2OS cells and visualized using Western blot analysis and a rabbit polyclonal antibody to HIV-1 gp120 Env ( Fig. 1A ). These results showed that increasing the MOI resulted in increasing the amount of immunoreactive species at approximately 160 kD and 120 kD, corresponding to the precursor Env protein gp160 and the mature gp120 Env, respectively. Compared with the gel-loading control of α-tubulin, increasing production of gp160 and gp120 was observed up to 1000 MOI.
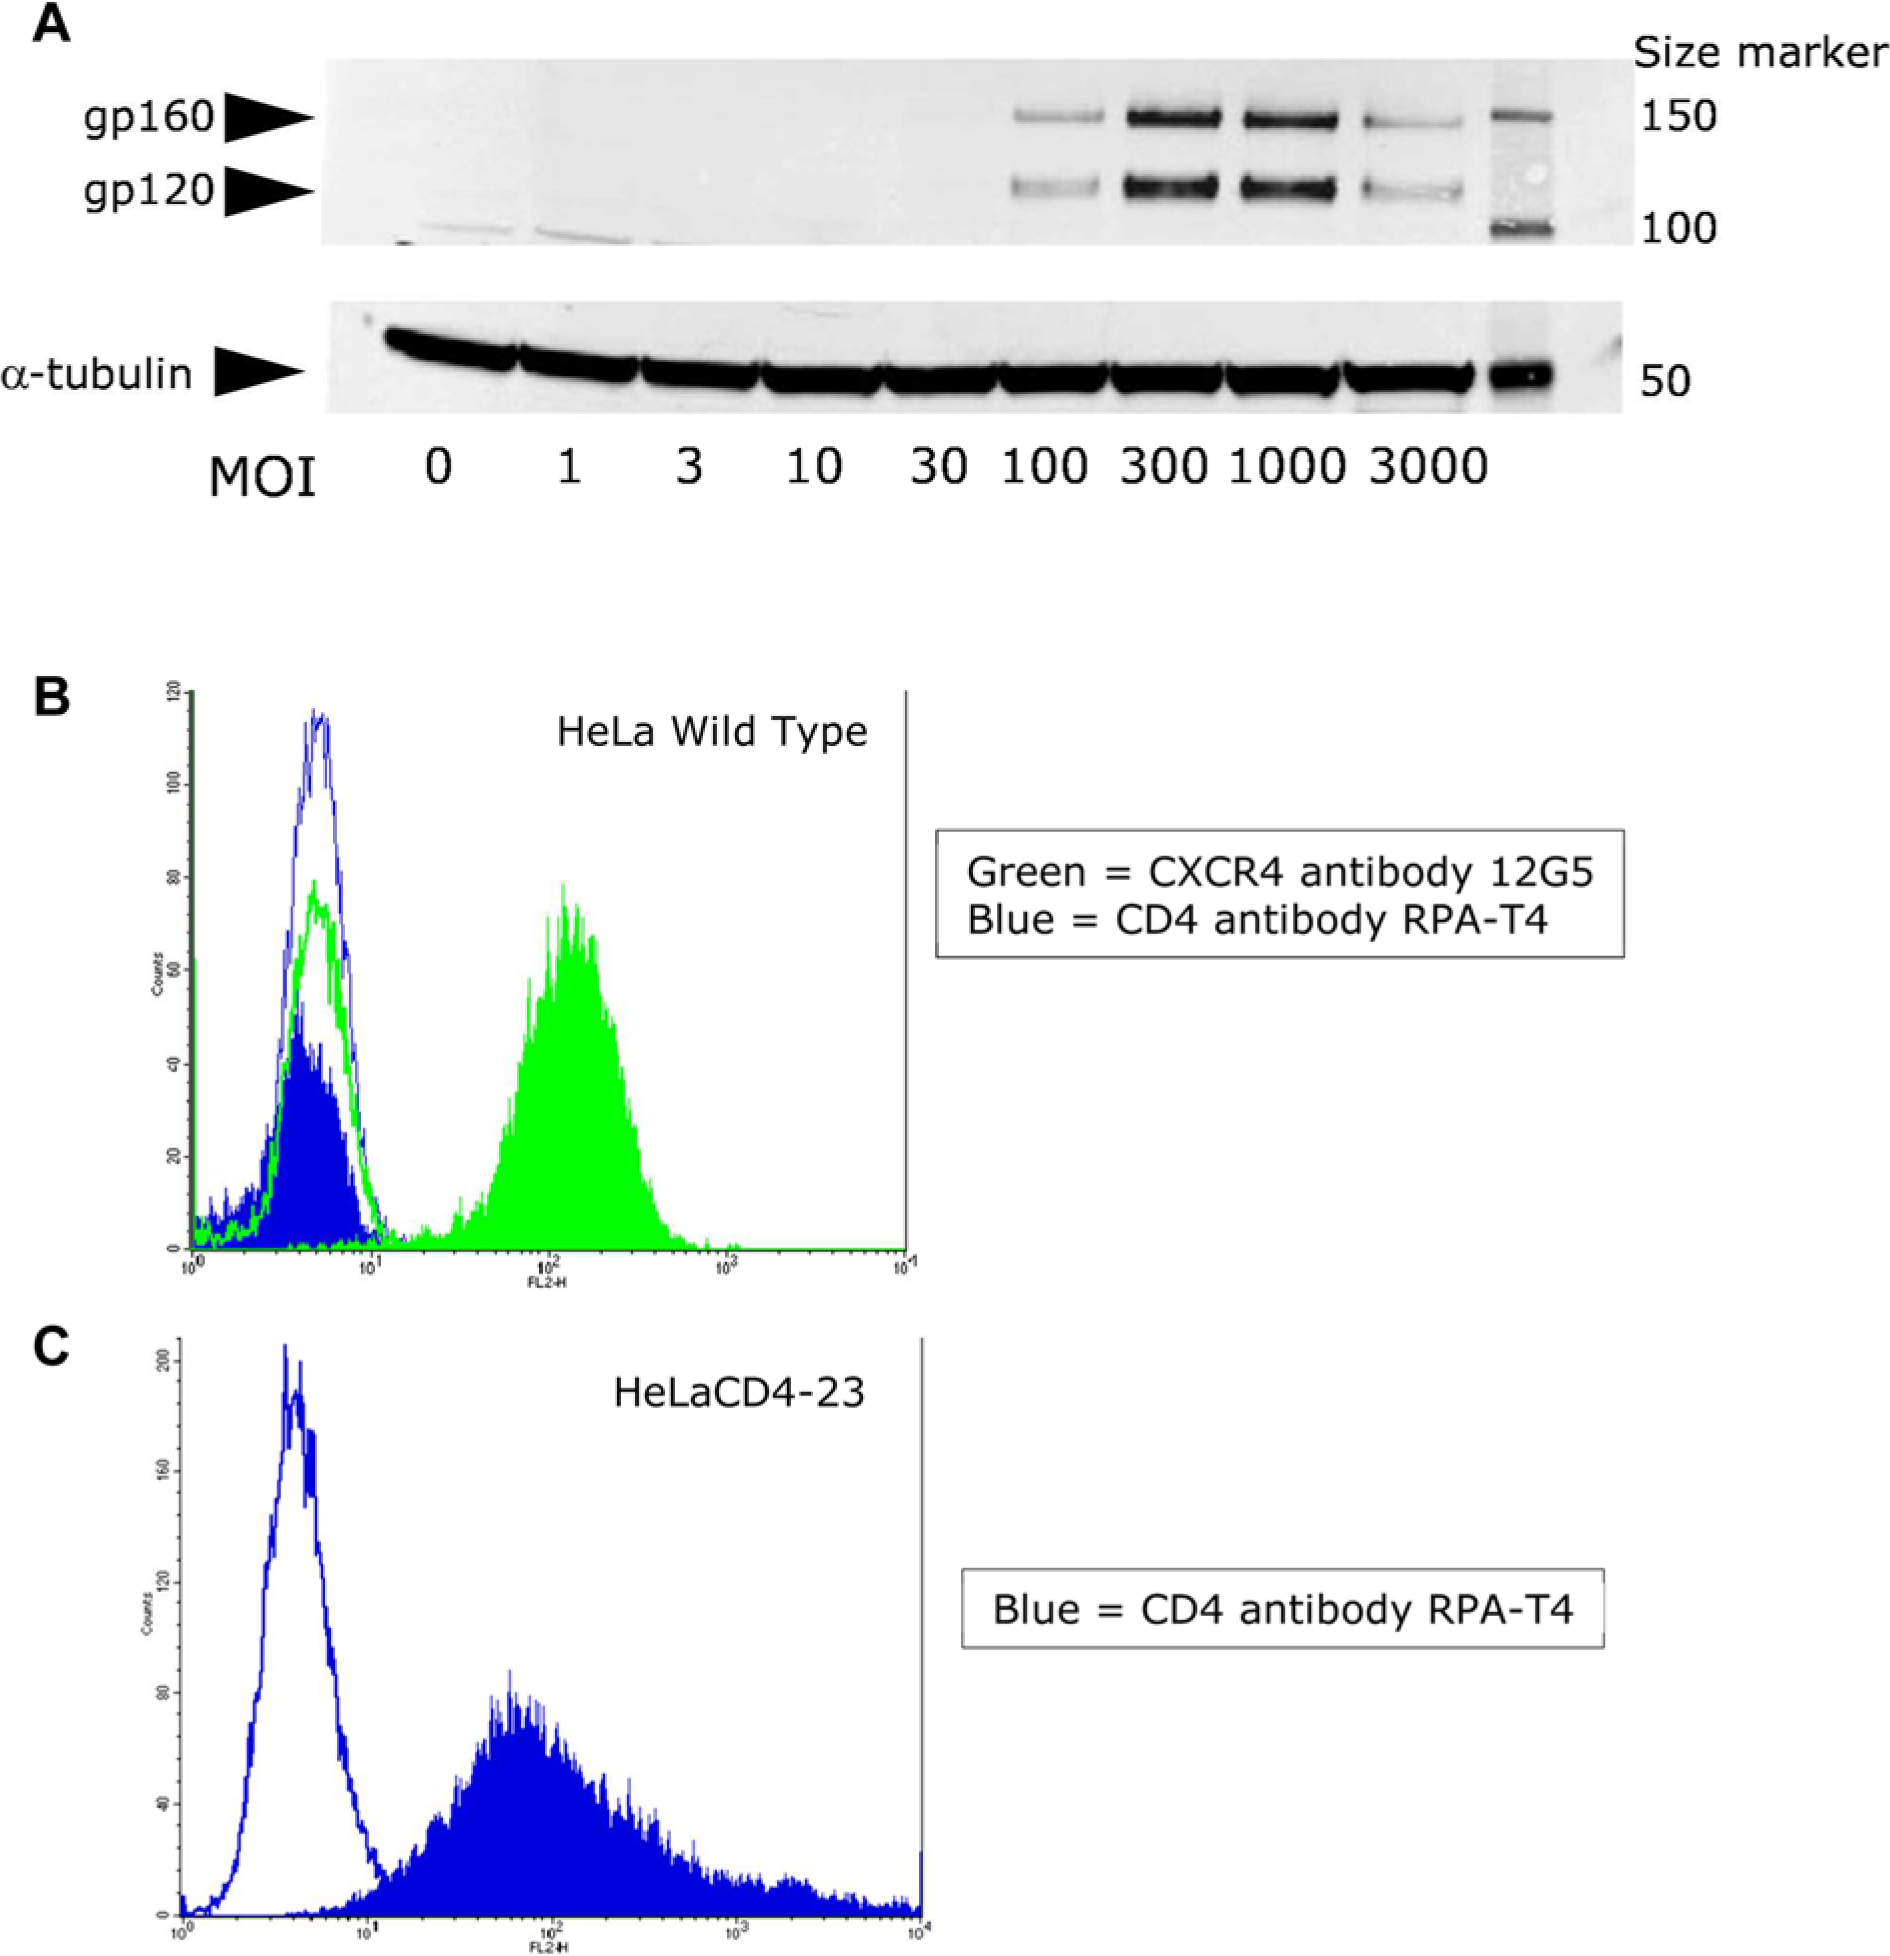
Effect of multiplicity of infection (MOI) on gp160/gp120 expression in U2OS effector cells and surface expression of CD4 and CXCR4 in HeLa target cells. (
For the target cells, HeLa cells were chosen since human CXCR4 is expressed endogenously. However, the primary HIV receptor CD4 was not expressed in wild-type HeLa, thus requiring expression of the CD4 gene. This was accomplished by using a lentivirus vector to establish stable expression of CD4 in HeLa cells. Cell surface expression of CD4 and CXCR4 was examined using immunofluorescence and flow cytometry, shown in Figure 1B , C . As expected, there was a 2-log shift in fluorescence in HeLa cells probed with the CXCR4-specific monoclonal antibody 12G5 compared with isotype controls, confirming high surface expression of CXCR4 in wild-type HeLa cells ( Fig. 1B ). No surface expression of CD4 was observed in wild-type HeLa. In Figure 1C , HeLaCD4-23 cells probed with CD4 antibody showed a 2-log shift in fluorescence, confirming good surface expression of CD4.
To detect successful cell fusion between target and effector cells, the Gal4-VP16 transcriptional activator was expressed in the HeLa target cells to drive transactivation of the β-lactamase gene in the effector U2OS cells. This was accomplished by another round of cell line isolation in HeLaCD4-23 cells. The final target cell line, HeLaCD4/VP16, was selected, which demonstrated strong induction of β-lactamase expression (data not shown).
To fully validate HeLaCD4-23 and HeLaCD4/VP16 as legitimate target cells of HIV entry via CD4 and CXCR4, we used HIV pseudovirus infection assays. As shown in Figure 2A , infection by pseudoviruses of T-tropic HIV HXB2 and NL4-3 were compared with a pseudovirus of the M-tropic HIV-1 stain ADA, in luciferase reporter gene infection assays. As expected, basal levels of luciferase signal were observed for infections with wild-type HeLa cells and with all three HeLa cell lines involving the pseudovirus of the M-tropic HIV-1 strain ADA, thus indicating unsuccessful entry. Increases in the luciferase signal were observed only in HeLaCD4-23 and HeLaCD4/VP16 for T-tropic pseudovirus HXB2 and NL4-3, where both CD4 and CXCR4 were expressed. Furthermore, AMD3100 was able to inhibit the HIV X4-Env interaction with host CD4 and CXCR4 in HeLaCD4-23 and HeLaCD4/VP16. Taken together, these results confirmed that HeLaCD4-23 and HeLaCD4/VP16 were valid target cells for a CXCR4-dependent HIV cell fusion assay.
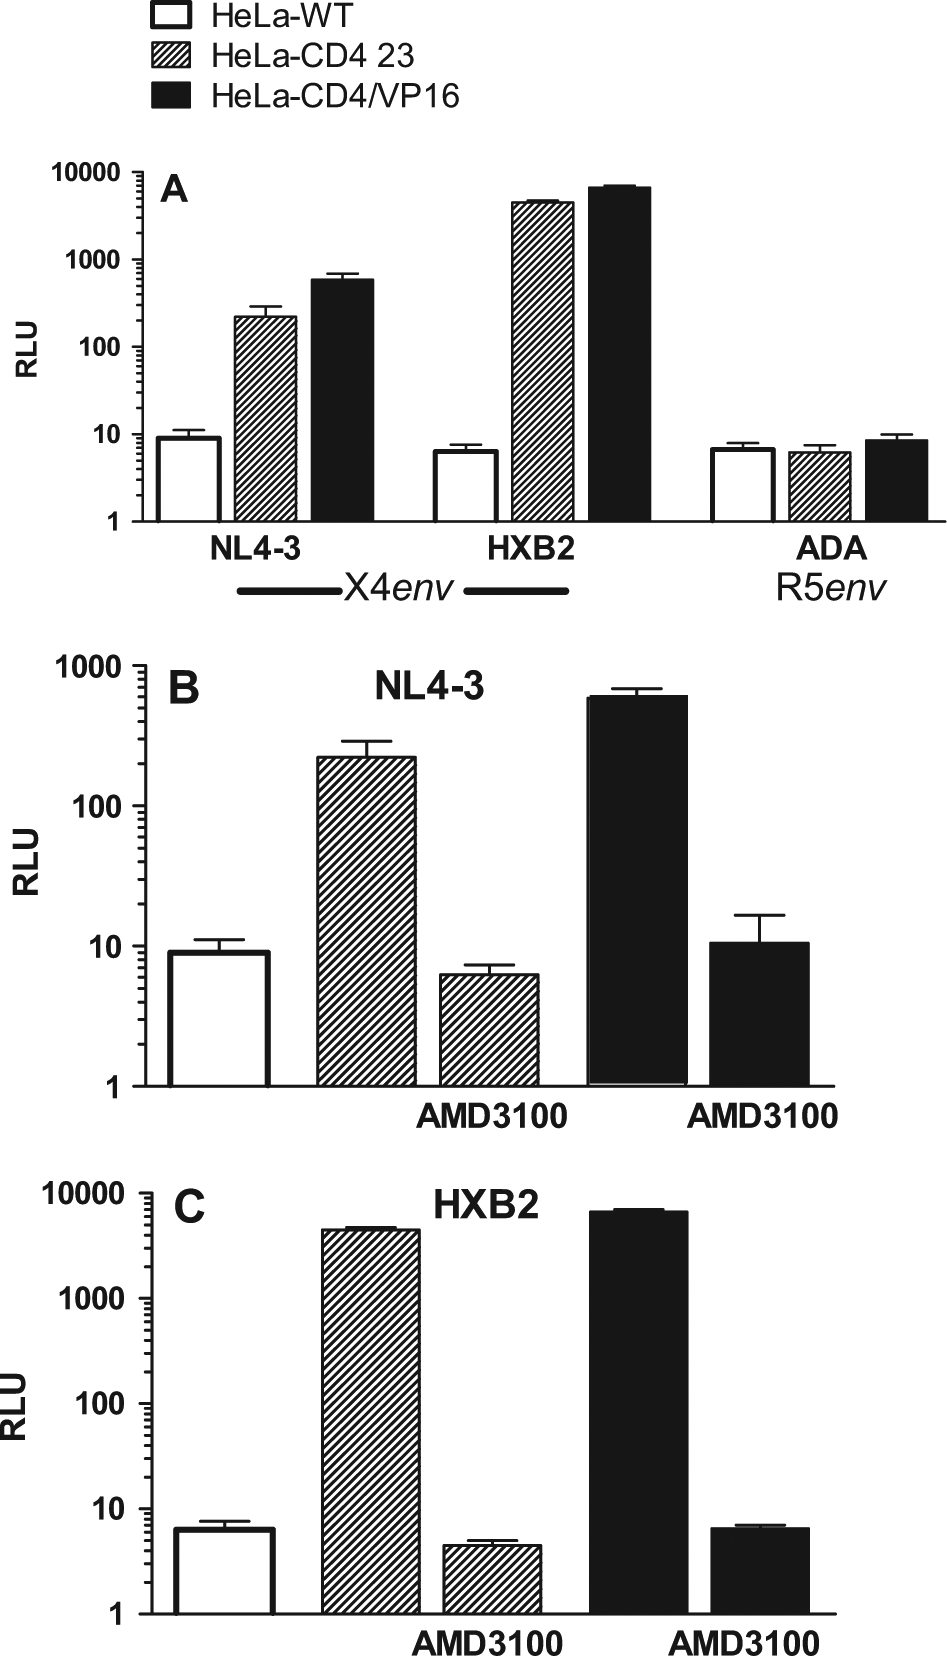
Pseudovirus entry assay results confirm specificity of HeLaCD4-23 and HeLaCD4/VP16 cell lines as target cells. Human immunodeficiency virus pseudoviruses from T-tropic viruses NL4-3 and HXB2 and M-tropic virus ADA were used in luciferase-based 96-well plate infection assays with HeLa wild type (HeLa-WT, open bars), HeLaCD4-23 (striped bars), and HeLaCD4/VP16 (solid black bars). Bars represent average relative light units (RLU) from eight wells, and AMD3100-treated well results are indicated. Results are representative of at least three independent experiments.
Assay Development
β-Lactamase detection was accomplished by measuring two fluorescent emission signals from CCF4/AM, which is a cell-permeable, FRET-based substrate dye. 19 Using a single excitation wavelength of 405 nm and dual detection of the intact substrate (520 nm) and measurement of β-lactamase cleavage product (447 nm), individual, intact live cells expressing β-lactamase were detected and quantified, as well as separated from nonexpressing cells. Examples of merged images of the cell fusion event are shown in Figure 3 , where pseudo-colored green cells were stained with substrate dye detected at 520 nm, and the pseudo-colored blue cells expressed β-lactamase, resulting in cleavage of the substrate and dye emission at 447 nm.
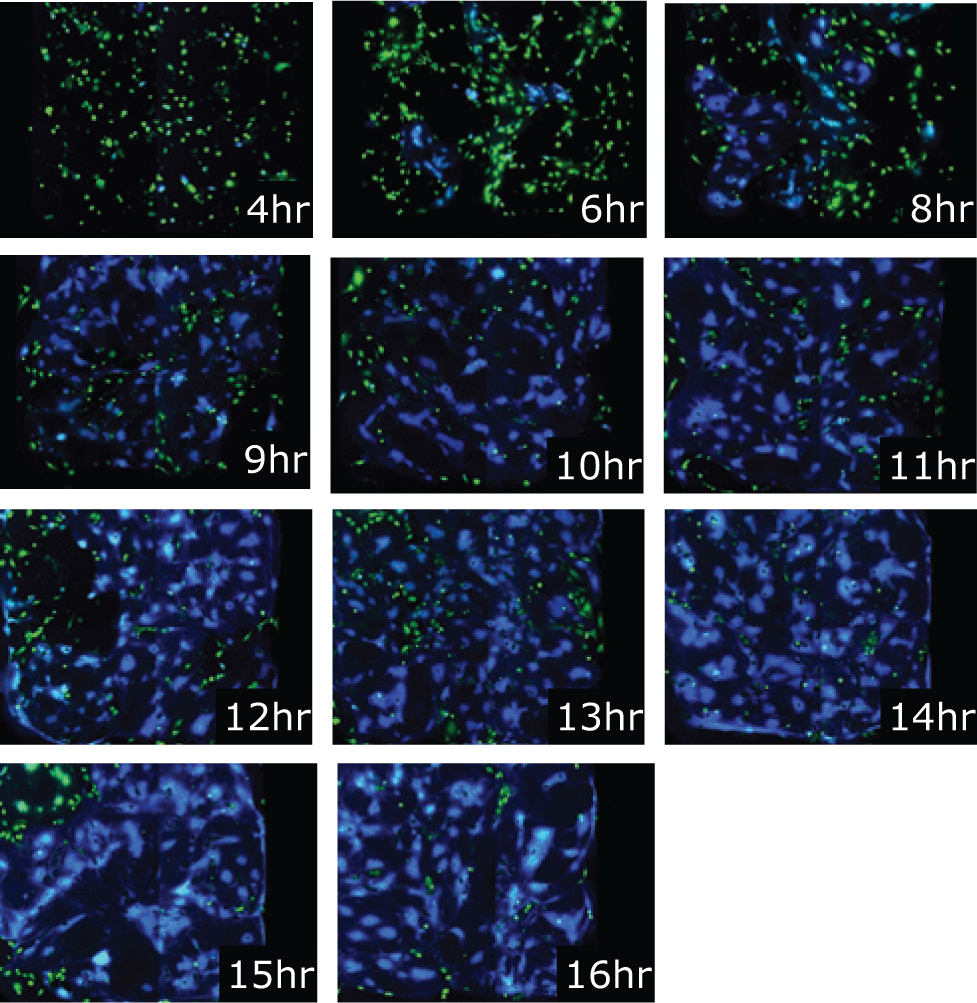
Image-based time course study of the β-lactamase human immunodeficiency virus cell fusion assay in a 1536-well plate. U2OS UASbla7 (HIVgp160 Env) cells were co-plated with HeLaCD4/VP16 and incubated for indicated times. Merged images were captured using the Pathway855.
Early assay development steps to optimize DMSO tolerance of the β-lactamase assay, as well as room temperature stability of the β-lactamase substrate reagent CCF4/AM, were performed. The assay tolerated DMSO levels as high as 4% (v/v), with no effect on the detection of fluorescent signal in either emission spectra (520 nm or 447 nm) (data not shown). All subsequent assay development experiments were carried out at 0.5% DMSO (v/v). CCF4/AM substrate was stable out to 24 h of testing and showed no decreases in signal intensity directly compared with freshly prepared substrate (data not shown).
Three instruments were evaluated for assay performance: the EnVision, the automated fluorescent microscope Pathway855, and the laser scanning plate cytometer Acumen eX3. Measurements made by the three instruments were compared using 384-well plate replicates, which were set up as a time course study over a 24-h period. Results are graphically represented in Figure 4 . β-Lactamase expression was best assessed by calculating the β-lactamase product-to-substrate emission ratios, which normalized variability due to cell number per well. For whole-well detection of β-lactamase activity by the EnVision, after background subtraction, RFU measured at 447 nm (blue) were divided by RFU at 520 nm (green) to generate a ratiometric measure (blue/green ratio) of β-lactamase expression. This blue/green ratio was also employed when analyzing data from the Pathway855 and Acumen eX3. After object segmentation algorithms were applied to separate and identify each cell, blue/green intensity ratios were calculated for each cell. Statistical analysis of the distribution of blue/green ratios in untreated versus AMD3100-treated populations helped guide the selection of a threshold ratio used to identify cells deemed positive for β-lactamase expression. In the case of the Acumen eX3, an additional criterion of cell area was applied to separate single cells from fused cells.
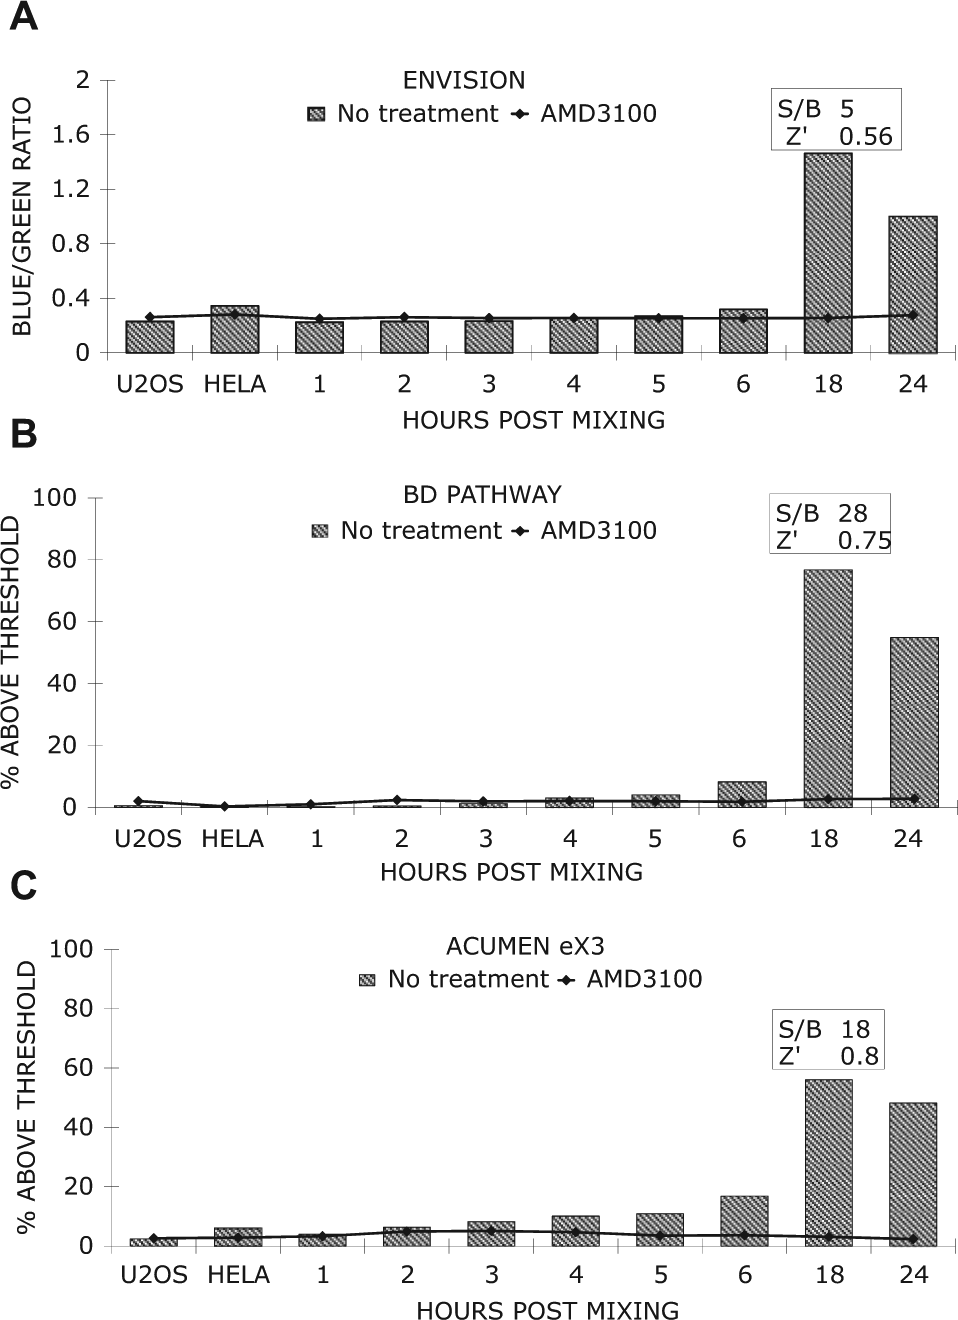
Direct comparison of fluorescent measurements of β-lactamase expression using three different instruments. U2OS UASbla7 (HIVgp160 Env) cells were co-plated with HeLaCD4/VP16 at indicated times in three identical 384-well plates. Graphical results are the average of 16 replicates of untreated wells (striped bars) or AMD3100-treated wells (solid line/squares). Calculated signal-to-background (S/B) results and Z′ values are derived from 16-well replicates at 18 h. Results are representative of at least three independent experiments.
Initial assay development studies were performed using 384-well plates, and the results are represented in the histograms in Figure 4 . As expected, conditions where target cells (HeLa) and effector cells (U2OS) were plated alone were equal to the AMD3100-treated wells. Results from all instruments demonstrated an increase in β-lactamase expression with time, peaking at 18 h after initial mixing of target and effector cells. At 18 h, the β-lactamase signal detected by the EnVision was 5-fold over the AMD3100-treated wells ( Fig. 4A ). In contrast, results from both the BD Pathway and the Acumen eX3 showed a larger signal fold-increase of 28 and 18, respectively ( Fig. 4B , C ).
To measure assay robustness, Z′ 22 was used to optimize assay conditions for HTS. As shown in Figure 4 , Z′ values of 0.80 and 0.75 were obtained in 384-well plates read by the Acumen eX3 and the BD Pathway, respectively, which were superior to the Z′ value of 0.56 derived from the EnVision results. On the basis of these results and additional ultra-HTS capabilities, we selected the Acumen eX3 to further optimize this assay for library screening using a 1536-well plate format.
For 1536-well plates, Z′ values from repeated experiments were consistently below 0.5 to 0.7, the generally accepted cutoff for compound library screening. To improve plate statistics for the 1536-well plate assay, we evaluated several readouts from the Acumen eX3, as shown in Figure 5 . After setting thresholds for selecting the fused cell population based on size and blue/green ratio for β-lactamase–positive cells, three parameter calculations were compared: percent positive β-lactamase (blue cells) of total cells, total blue cell area, and percent blue cell area of total cell area. Ten 1536-well plates in a single experiment were set up to include AMD3100 prepared in 10-point half-log dilutions using 24 replicates per concentration dose for potency determination. The worst Z′ values were observed using the percent positive large blue cells of total cells in each well, ranging from −0.10 to 0.05. Improvement in Z′ was obtained when incorporating the parameter of cell area: total blue cell area yielded Z′ values of 0.13 to 0.33, and percent blue cell area of total cell area yielded Z′ values of 0.16 to 0.36. Despite the low performance of this assay as evaluated by Z′ ( Figs. 5 and 6 ), reproducible dose-response curves were observed regardless of the parameter used for measuring successful cell fusion. As shown in Figure 5 , AMD3100 dose-response curves from ten 1536-well plates yielded pIC50 values of 7.73 ± 0.06 (mean +/- SEM) using percent blue cells, 7.59 ± 0.07 using blue cell area, and 7.73 ± 0.06 using percent blue cell area. A similar dose-response study was performed for CXCL12, using blue cell area for measurement of cell fusion, and the results yielded the expected mean potency of pIC50 6.75 ± 0.20 (dose-response curves not shown). These mean potency values and reproducible dose-response curves for AMD3100 and CXCL12 were consistent with values reported for other HIV activity assays, such as in vitro live virus infection assays and pseudovirus entry assays. 23 Furthermore, the CCR5 ligand RANTES (CCL5) and CCR5 antagonists, AD101 and SCH C, were tested and found to be inactive without cellular toxicity observed at the highest concentration tested (1 µM for CCL5 and 10 µM for the SCH compounds). These potency determinations in the cell fusion assay suggested that the assay would be suitable for the purposes of compound library screening using 1536-well plates.
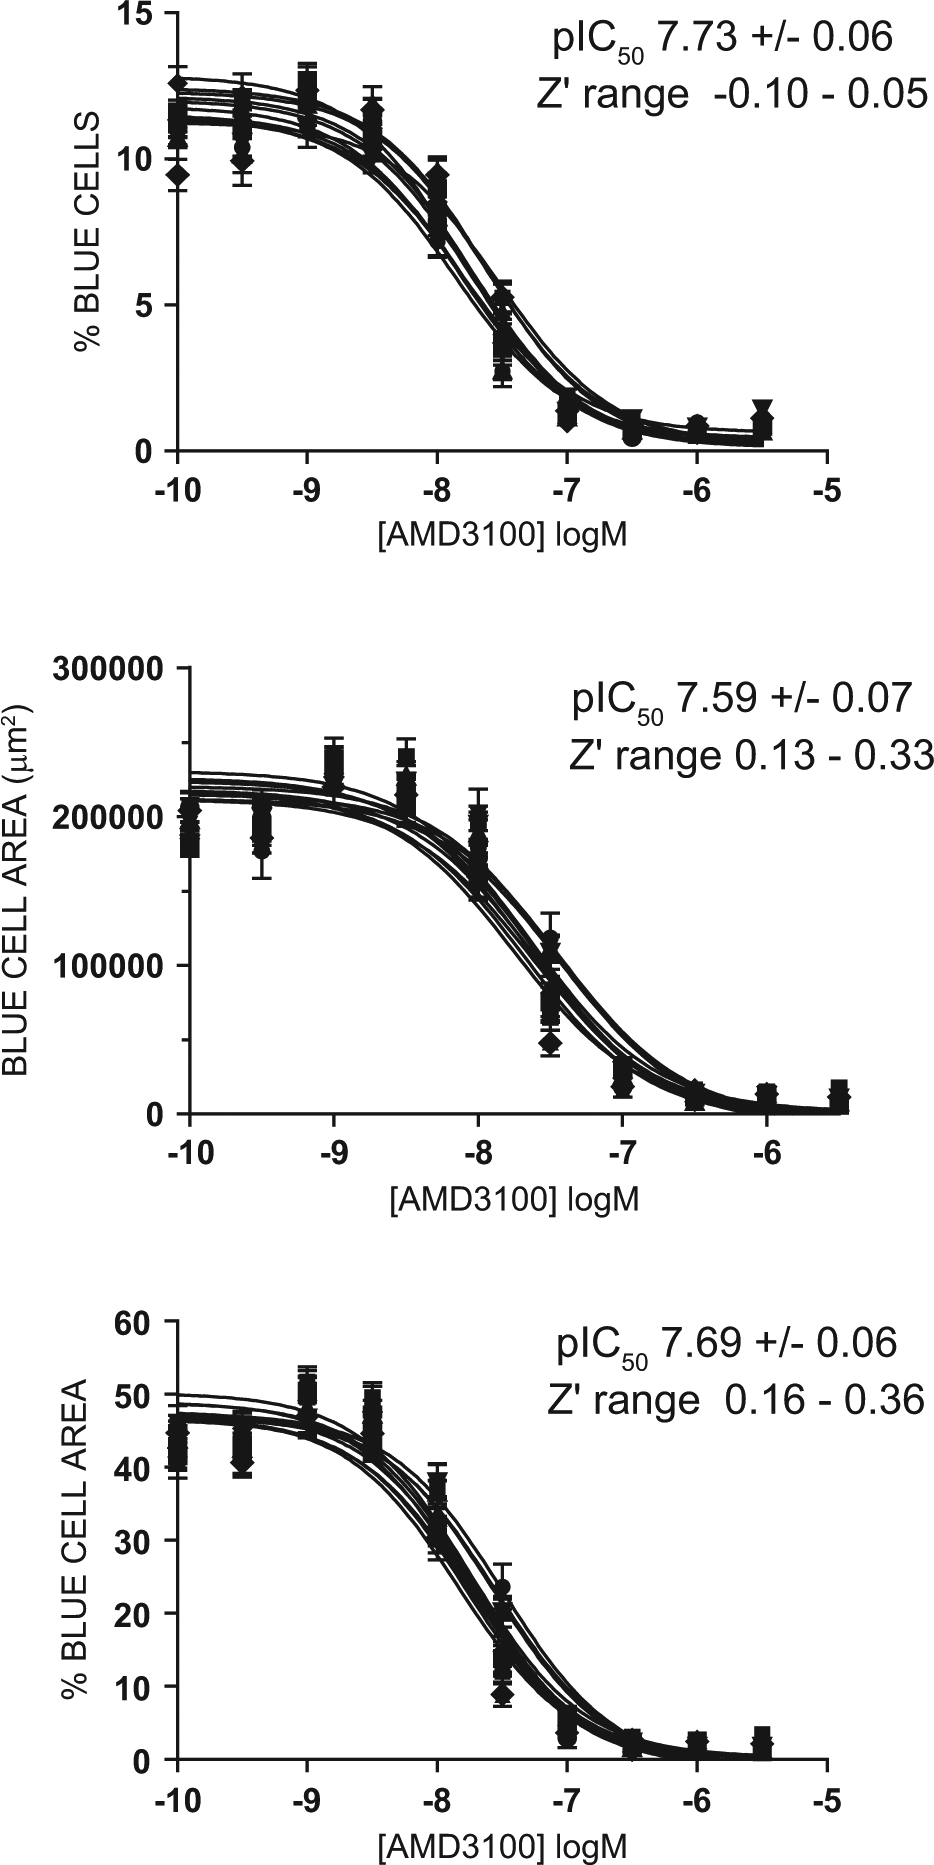
Acumen eX3 results from the analysis of ten 1536-well plates with concentration dose titrations of AMD3100. Each plate contained a concentration dose titration of AMD3100 using 24 replicate wells per dose. The pIC50 values in each graph represent the mean ± standard error.
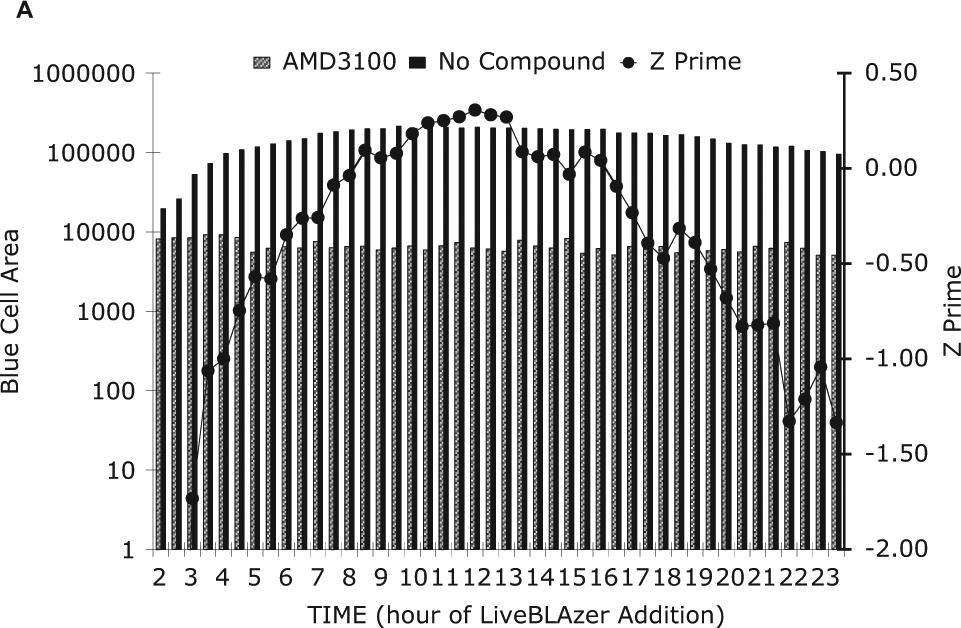
Acumen eX3 results of a time course study of the human immunodeficiency virus β-lactamase assay. Total blue cell area per well was used to determine Z′, and these results were plotted over a 24-h period. Values plotted represent mean blue cell area or Z′ (line with closed circles) derived from 128 wells of AMD3100 treatment (striped bar) or 128 untreated wells (solid bar).
Adaptation of the assay to a 1536-well plate format required a new time course to be conducted over a 24-h period. Sample merged images captured using the BD Pathway are shown in Figure 3 . The first indications of cell fusion were visually detectable starting at 4 h; however, instrument detection of the β-lactamase signals occurred earlier. As shown in Figure 6 , using AMD3100-treated cells as the background signal control, β-lactamase signal increases were detected starting at 2 h after mixing of target and effector cells. These signal increases continued to rise through 6 h, plateaued between 10 and 13 hours, and then began to decline for the duration of the 24-h period. Analysis of Z′ at each time point reflected this rise and fall of the β-lactamase signal, and the most robust assay measurements occurred between 10 and 13 h after mixing.
Screen Results
A homogeneous assay design was used for the primary screen: compounds were dispensed to empty 1536-well plates to achieve a final concentration of 7.5 µM in final 0.4% DMSO (v/v). Frozen assay-ready stocks of each cell line were dispensed to each well and then incubated 10 h at 37 °C in 5% CO2. CCF-4AM was subsequently dispensed, and plates were scanned using the Acumen eX3 1 h later. The total number of compounds assayed was 119,040 from a proprietary library, and compounds exhibiting a hit criterion of greater than 50% inhibition of the combined parameter of β-lactamase signal and fused cell area (blue cell area) were selected for subsequent testing. A total of 1467 compounds were thus selected and retested using a single concentration of 10 µM in the HIV cell fusion assay using a 384-well plate format. From this selected subset, 100 compounds were confirmed to exhibit at least 50% inhibition of the HIV cell fusion signal at 10 µM. This set of 100 compounds was subsequently tested for calcium signaling via CXCR4 by CXCL12 in a calcium flux assay using the FLIPR. We tested for both agonist activity of each compound, as well as antagonist activity against CXCL12, at concentrations as high as 50 µM and found that none of the compounds showed either agonist or antagonist activity. CXCL12 demonstrated expected EC50 agonist activity at 29.1 ± 5.7 nM (mean ± SEM); AMD3100 showed expected IC50 values of 3.27 ± 0.9 nM.
Subsequently, these compounds were tested for CXCR4 binding using Tag-lite technology. Four compounds showed competitive binding activity versus CXCL12, with a range of Ki values from 0.6 to 9.4 µM, compared with AMD3100 Ki of 50 nM. In addition, the selected set of 100 compounds was tested in the HIV pseudovirus assay, constructed by using the HIV envelope from T-tropic strain HXB2. As might be expected, the four compounds that demonstrated activity in the binding assay were also active in the HIV pseudovirus entry assay (IC50 values ranged from 2–8 µM). Interestingly, we found one compound that showed specific activity in the HIV pseudovirus entry assay with a potency of 0.6 µM, without any demonstrated activity in the FLIPR assay or binding assay. This single compound has the potential for fitting our desired profile; no agonist or antagonist signaling activity through CXCL12, as well as no competitive binding with CXCL12, yet showed activity in an HIV entry assay.
Discussion
The first HIV entry inhibitors discovered, developed, and proven to be clinically effective antiretroviral agents were antagonists of the CCR5 chemokine receptor. In 1996, when CCR5 was described as a coreceptor of HIV-1, the discovery of humans who were homozygous for a 32–base pair deletion in CCR5 and a nonfunctional CCR5 gene were shown not to be susceptible to HIV-1 infection. Notably, there was no serious phenotype associated with this deletion. 6 Since this knock-out mutation did not appear to have any deleterious effects, it followed that orthosteric antagonists of HIV entry via CCR5 could be expected to lack mechanism-based toxicity.
On the other hand, the coreceptor CXCR4 and its cognate ligand CXCL12 are known to be involved in a variety of important biological functions in both healthy and disease states. CXCL12 and CXCR4 gene-deleted mice, which display an identical, lethal phenotype, are characterized by deficient development of B lymphocytes and bone marrow cells and by abnormal neuronal and cardiovascular development.24 –27 CXCR4 and its single cognate ligand, CXCL12, are key components of B-cell lymphopoiesis, hematopoietic stem cell mobilization, and leukocyte migration. 28 Overexpression of CXCR4 and/or CXCL12 is associated with metastasis of lung, breast, and colon cancers; several leukemias; and WHIM (warts, hypogammaglobulinemia, immunodeficieny, myelokathexis) syndrome. 28 Taken together, the health and disease-related biology of CXCR4 complicates the search for an ideal drug candidate that targets HIV entry while sparing normal CXCR4 functions. Nevertheless, it may be possible to identify an allosteric modulator of CXCR4, which would block HIV entry yet spare the normal, healthy receptor-ligand interactions and functions.
The assay described in this report was developed as a broadly functional surrogate assay for viral entry such that small molecules could be identified that might act through multiple mechanisms. The validation of the cell line reagents showed specificity for HIV entry via the disease target CXCR4, but other mechanisms of inhibition will also be selected. Compounds that bind Env proteins gp41 or gp120 will be active, as well as inhibitors of gp120 and CD4 interaction. By bringing this phenotypic, functional assay to the primary stage of compound library screening, a diverse array of HIV entry-inhibiting compounds can be identified and subsequently assayed for CXCR4 binding and function (i.e., calcium signaling and chemotaxis). Using this approach, the probability of discovering allosteric modulators of CXCR4 is higher since other assays that measure orthosteric competition with CXCL12 binding or signaling do not necessarily detect tertiary structure modulation that may inhibit entry alone.
The current assay replaced live virus with a cell line that expresses the T-tropic HIV Env, as well as a transcriptionally silent reporter gene construct, with demonstrated specificity for HIV cell fusion limited to CXCR4 and not CCR5. Fusion of the HIV-surrogate effector cell with the target cell HeLa/CD4 allowed mixing of cytoplasm and enabled the transcriptional activator Gal4-VP16 to turn on expression of the reporter gene β-lactamase. The sensitivity of the assay design was based on both the fluorescent substrate for β-lactamase activity (blue/green ratio) and the morphological changes associated with cell fusion (i.e., increases in cell area). This additional layer of information based on morphology provided confirmation of the cell fusion event as well as compound cytotoxic effects, which improved the quality of the compounds identified.
In this study, three instruments were compared directly for measuring β-lactamase expression, and these instruments represent a wide range of capabilities for high-throughput assays. The EnVision measured whole-well fluorescence, which limited the information profile of the compounds in addition to having the least robust performance. In contrast, the high-resolution images of the Pathway855 were invaluable during the assay development stages, including the study of the assay kinetics and signal optimization. Comparison of the Pathway images with the Acumen eX3 classification schemes provided the validation necessary to link the biology of the assay with the numerical object data from laser scanning cytometer. The simplicity of the raw data files and the plate scanning speed of the Acumen eX3 made it a good choice for primary screening.
When evaluating the cell fusion assay in 384-well plates, Z′ values were in the 0.6 to 0.8 range, a well-accepted range for robust cell-based assays. However, since the goal of this assay was to screen large chemical libraries, we continued assay development in 1536-well plates. An increase in assay variability was observed while adapting this assay from 384-well plates to 1536-well plates. This increase in variability in the higher density plate format may be an inherent aspect of the cell fusion assay. In 384-well plates, 5000 cells were plated per well. Detection of successful cell fusion, after 18 h of coincubation of effector and target cells, resulted in a large reduction of cell object number per well, ranging from 300 to 500 objects (data not shown). On the other hand, in 1536-well plates, only 500 cells of each cell type were dispensed per well. When cell fusion occurred, the actual number of cells detected by either the Acumen eX3 or BD Pathway was greatly reduced to less than 100 cells per well. This number was probably below the critical number for supporting robust assay statistics and was reflected in lower Z′ values. Despite this poor Z′ result, we observed expected potencies for the CXCR4 active compounds, AMD3100 and CXCL12, and the potencies observed in the fusion assay were consistent with reported activity in other HIV assays. This boosted the confidence in using this assay for finding compounds in either format: 384-well or 1536-well.
We evaluated this phenotypic screen approach by using a randomly chosen subset of our proprietary chemical library, totaling 119,040 compounds. Following the primary cell fusion screen in a 1536-well format, 1467 compounds that exhibited greater than 50% inhibition of HIV cell fusion activity were selected for subsequent testing. Given the proven robustness of the 384-well plate assay, this format was chosen to test hit compounds, where 100 compounds were confirmed for inhibition of HIV cell fusion. These 100 compounds were then tested for specific CXCR4 activity with two assays: the CXCL12-stimulated calcium-flux assay and a CXCR4 binding assay, using AMD3100 as a reference compound. No compounds exhibited intrinsic CXCR4 agonist activity in the calcium-flux FLIPR assay, nor did we find any significant antagonist activity to CXCL12 signaling via CXCR4. Four compounds demonstrated inhibition of binding of CXCL12, with potencies in the single-digit micromolar range. Subsequent testing in live HIV pseudovirus entry assays produced a single compound with entry activity which did not have binding or calcium-flux activity. Four additional compounds showed both CXCR4 binding activity and HIV entry activity. More extensive testing would be required to determine the nature of this set of compounds and if they indeed interacted with CXCR4 and inhibited T-tropic HIV entry. It would not be unexpected that these compounds have activity outside of any interactions with the coreceptor CXCR4, but it seemed that our phenotypic screen design produced a set of compounds worth investigating.
Footnotes
Acknowledgements
We gratefully acknowledge Dr. Marvin Bayne’s unwavering support, vision, and leadership.
Declaration of Conflicting Interests
The authors declared no potential conflicts of interest with respect to the research, authorship, and/or publication of this article.
Funding
The authors received no financial support for the research, authorship, and/or publication of this article.