
Abstract
Cancer cell proliferation is regulated by oncogenes, such as c-Myc. An alternative approach to directly targeting individual oncogenes is to target IMP-1, an oncofetal protein that binds to and stabilizes messenger RNAs (mRNAs), leading to elevated expression of c-Myc and other oncogenes. Expression of IMP-1 is tightly correlated with a poor prognosis and reduced survival in ovarian, lung, and colon cancer. Small-molecule inhibitors of IMP-1 have not been reported. We established a fluorescence anisotropy/polarization microplate assay (FAMA) for analyzing binding of IMP-1 to a fluorescein-labeled 93 nucleotide c-Myc mRNA target (flMyc), developed the assay as a highly robust (Z′ factor = 0.60) FAMA-based high-throughput screen for inhibitors of binding of IMP-1 to flMyc, and carried out a successful pilot screen of 17,600 small molecules. Our studies support rapidly filtering out toxic nonspecific inhibitors using an early cell-based assay in control cells lacking the target protein. The physiologic importance of verified hits from the in vitro high-throughput screen was demonstrated by identification of the first small-molecule IMP-1 inhibitor, a lead compound that selectively inhibits proliferation of IMP-1–positive cancer cells with very little or no effect on proliferation of IMP-1–negative cells.
Introduction
The oncofetal messenger RNA (mRNA) binding protein IMP-1/CRD-BP/IGF2BP1 is a multifunctional mRNA binding protein with important roles in mRNA degradation,1–3 translation, 4 and localization. 5 Overexpression of IMP-1 results in enhanced cell proliferation, 6 suppression of apoptosis, 7 and resistance to taxanes and other anticancer drugs.8,9 Kaplan-Meier plots show that expression of IMP-1 is tightly correlated with a poor prognosis in ovarian, colon, and lung cancer.10–12 Consistent with an important role in tumor growth and progression, IMP-1 expression is upregulated by c-Myc 13 and β-catenin, 14 and it is a major regulatory target of let-7 microRNA. 15 IMP-1, through its capacity to bind to and stabilize mRNAs, increases expression and activity of key oncogenes, including c-Myc, K-Ras, and ERK ( Fig. 1 ).
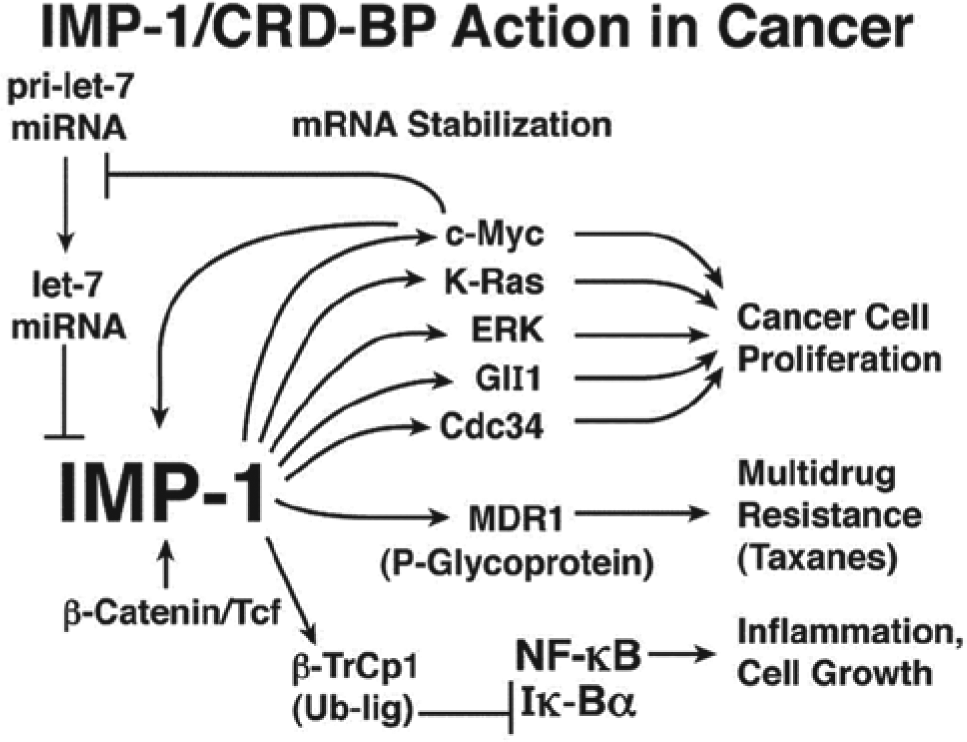
Schematic representation of IMP-1 action in stabilizing messenger RNAs important in cancer.
IMP-1 binds to a specific sequence that regulates the stability of c-Myc mRNA, stabilizing c-Myc mRNA, increasing levels of c-Myc mRNA and protein and increasing cell proliferation.12,13 RNA interference (RNAi) knockdown of IMP-1 in cell lines from several types of cancers reduces c-Myc levels, inhibits cell proliferation, and triggers apoptosis.12,14 In addition, IMP-1 binds to MDR1 (multidrug resistance protein 1/P-glycoprotein) mRNA, stabilizing MDR1 mRNA, leading to overexpression of MDR1 and resistance to anticancer drugs.1,8,9 RNAi knockdown of IMP-1, or expression of let-7 miRNA, reduces the level of IMP-1, destabilizes and downregulates MDR1, and increases sensitivity of cancer cells to killing by therapeutically relevant concentrations of taxol, vinblastine, and other anticancer drugs.8,9 Despite its emerging role in both tumor cell proliferation and multidrug resistance, small-molecule modulators of IMP-1 have not been reported.
To establish a quantitative real-time assay for binding of IMP-1 to target RNAs that could be developed for high-throughput screening (HTS), we developed a fluorescence anisotropy microplate assay (FAMA). Using this assay, test compounds were evaluated for their ability to inhibit binding of IMP-1 to a 93-nucleotide fluorescein-labeled c-Myc mRNA binding site (flMyc). 16 Because the 93-nucleotide c-Myc RNA binding site was too large to synthesize commercially, we developed simple methods for in vitro synthesis and fluorescein labeling of the RNA.
Assays based on fluorescence anisotropy/polarization have emerged as alternatives to earlier assays such as electrophoretic mobility shift assays (EMSA) that can be difficult to adapt for high throughput. These assays are based on changes in fluorescence polarization/anisotropy on binding of a protein to a labeled RNA. When polarized light excites a fluorophore, such as the fluorescein-labeled c-Myc RNA (flMyc), the relatively small fluorescein-labeled RNA (flRNA) usually undergoes rotational diffusion more rapidly than the time required for light emission ( Fig. 2A ). Therefore, the position of the flRNA at the time of light emission is largely randomized, resulting in depolarization of most of the emitted light. In contrast, when a protein such as IMP-1 binds to the flRNA, the larger size and volume of the protein-flRNA complex cause rotation to be slower, increasing the likelihood that the protein-flRNA complex will be in the same plane at the time of light emission as it was at the time of excitation. Therefore, the emitted light remains highly polarized ( Fig. 2A ). FAMA is ideal for HTS because it is a homogeneous, real-time assay that can be used to rapidly assess binding in solution. Fluorescence polarization/anisotropy methods recently have been successfully used in HTS to identify small-molecule inhibitors of biologically relevant RNA-protein interactions involved in diseases such as influenza and Rift Valley fever virus.17,18
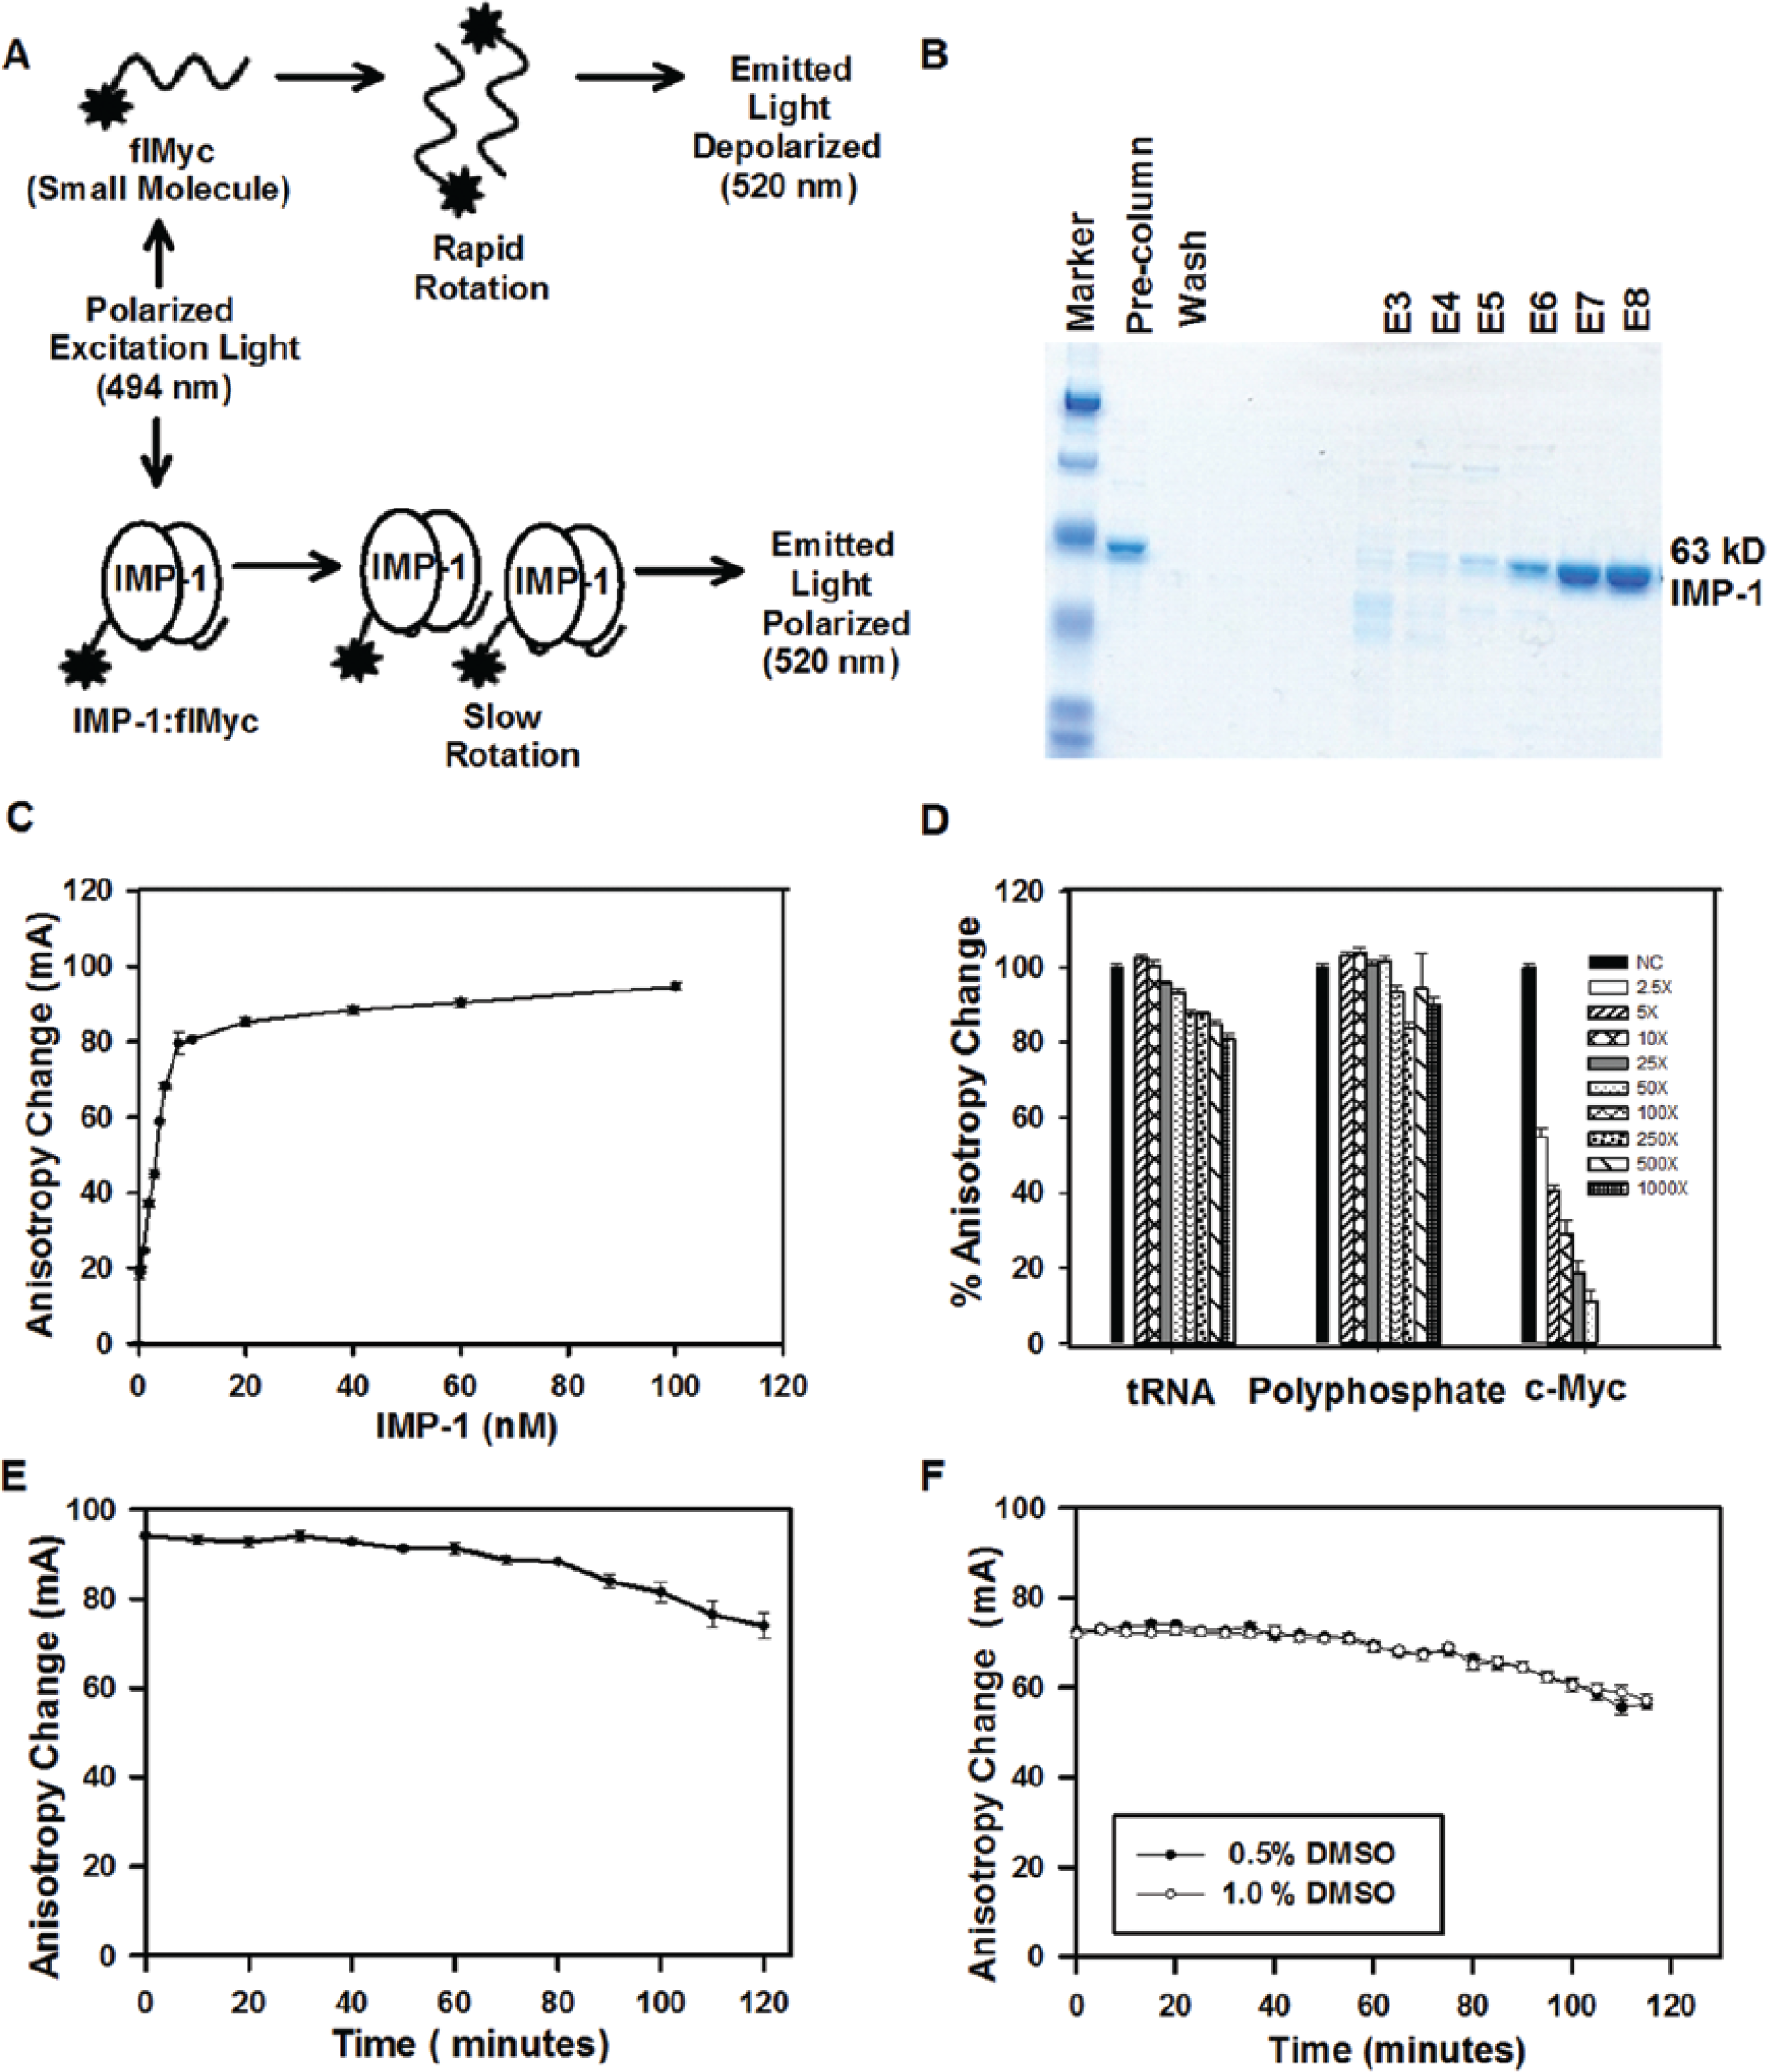
Development of fluorescence anisotropy microplate assay (FAMA) for high-throughput screening to identify inhibitors of IMP-1 binding to the flMyc. (
In this study, we carried out an unusual purification that selects for biological activity of purified IMP-1, developed the flMyc RNA probe, and performed a pilot screen of 17,600 small molecules from a compound library in the University of Illinois High Throughput Screening Center. From the pilot screen, we identified 33 verified hits that inhibited binding of IMP-1 to flMyc and met fluorescence intensity cutoffs. Since our primary screen was for inhibition of binding of IMP-1 to flMyc, it did not exclude toxic compounds. We retested the hits for specificity by evaluating their ability to inhibit binding of the steroid hormone receptor, progesterone receptor (PR), to its fluorescein-labeled DNA binding site (fluorescein-labeled progesterone response element [flPRE]). This specificity test was only moderately successful in filtering out compounds that subsequently proved toxic in IMP-1–negative cells. Although previous pilot screens often used orthogonal validation assays such as EMSA and filter binding, these methods may not fully recapitulate the complex milieu of living cells. Therefore, we assessed how effectively and selectively the hits inhibited a key activity of IMP-1: stimulation of cell proliferation. To establish a cell-based assay to filter the hits, we used RNAi knockdown of IMP-1 to confirm that IMP-1 expression was essential for proliferation of IMP-1–positive cells and that IMP-1 RNAi knockdown had no effect on the proliferation of IMP-1–negative cells. The cell-based assay identified a substantial number of hits as toxic in the IMP-1–negative cells. This suggests that an early assay in cells that lack the target protein provides a rapid filter to eliminate small molecules exhibiting nonspecific binding and toxicity. Our work suggests a screening strategy in which an initial biochemical screen using purified protein identifies hits that target the desired protein-RNA interaction and an early follow-on cell-based assay filters out nonspecific and toxic hits. This approach allowed us to identify a lead as the first selective small-molecule inhibitor of IMP-1.
Materials and Methods
Unless otherwise stated, average ± SEM is reported for experiments where SEM equals σ/√n, where σ represents the population standard deviation and n is the sample size.
Compound Libraries
The pilot screen chemical library used part of a library of commercially available small molecules from the Chembridge Microformat Library that is maintained in the University of Illinois High Throughput Screening Center. Compounds are stored at −20 °C and arrayed in 384-well plates at concentrations of 1 or 10 mM in DMSO.
Protein Purification
IMP-1 was purified as described by Nielsen et al. 19 with minor modifications, mostly suggested by Dr. J. Christiansen (Department of Biology, University of Copenhagen). Untagged full-length IMP-1 in PET42a (Novagen, Darmstadt, Germany) was expressed in a strain of BL21DE3pLysS-expressing plasmid-encoded transfer RNAs (tRNAs) for rare Arg, Ile, and Leu codons (a generous gift of Dr. J. Christiansen). Following protein expression, cells were harvested and broken by sonication in 20 mM Tris-HCl (pH 7.8), 5 mM MgCl2, 100 mM KCl, 1 mM dithiothreitol (DTT), and 1.4 µg/mL aprotinin; Triton X-100 was added to 0.4%; and cell debris was removed by centrifugation at 8000 rpm at 4 °C for 10 min. The supernatant was made up to 10% in glycerol and layered on a sucrose cushion consisting of 1.1 M sucrose, 20 mM Tris-HCl (pH 7.8), 5 mM MgCl2, 100 mM KCl, 1 mM DTT, and 0.1% Triton X-100 and centrifuged for 2 h at 4 °C at 40,000 rpm. The resulting pellet contained IMP-1 bound to polysomal mRNA. The pellets were washed in 20 mM Tris-HCl (pH 7.8), 5 mM MgCl2, 100 mM KCl, 1 mM DTT, and 0.1% Triton X-100. IMP-1 was dissociated from polysomal mRNA by resuspending the pellets in 20 mM Tris-HCl (pH 7.8), 5 mM MgCl2, 650 mM KCl, 1 mM DTT, and 0.1% Triton X-100. The suspension was centrifuged for 1 h at 4 °C at 40,000 rpm. The supernatant was adjusted to 200 mM KCl and 10% glycerol before it was applied to a 2-mL Heparin-Sepharose column (Amersham Biosciences, Little Chalfont, UK) equilibrated in 20 mM Tris-HCl (pH 7.8), 5 mM MgCl2, 200 mM KCl, 1 mM DTT, 0.1% Triton X-100, and 10% glycerol. After washing with the equilibration buffer, the protein was eluted by the same buffer containing 350 mM KCl. As shown in Figure 2B , the indicated eluted fractions (E, elution) were resolved on a 10% sodium dodecyl sulfate–polyacrylamide gel electrophoresis (SDS-PAGE) gel and visualized by Coomassie blue staining. Purified IMP-1 from fractions E7 and E8 was near homogeneous and used in our studies.
Full-length FLAG-epitope tagged human PR-b (120 kDa) was purified from baculovirus-infected insect cells produced at a 5L BioReactor scale in a facility at the University of Colorado Health Sciences Center facility 20 and was a generous gift from Prof. S. Nordeen.
Synthesis of Fluorescein-Labeled c-Myc RNA Probe
The flMyc probe was produced essentially as we describe, 16 with the minor modification of using the MEGAscript kit (Ambion, Austin, TX) for in vitro transcription.
Standard palindromic cPRE/GRE (5′-f-CTAGATTAC
Fluorescence Anisotropy Assays
The FAMA buffer was modified from our earlier assay. 16 Anisotropy change represents the difference between the anisotropy measured at each concentration of IMP-1 and the anisotropy value measured in the absence of IMP-1 (flMyc RNA alone). In competition experiments, unlabeled competitors were premixed with the fluorescein-labeled RNA probe before IMP-1 was added. The anisotropy change for IMP-1 binding to flMyc-RNA with no competitor was set to 100%. Percent anisotropy change was calculated as follows: [anisotropy change (plus competitor)/anisotropy change (no competitor)] × 100.
FAMA for HTS was performed in 384-well low-volume, flat-bottom microplates (Greiner Bio-One, Monroe, NC). The optimum IMP-1 protein (10 nM) and flMyc RNA (1 nM) concentrations for the assay were chosen because they result in approximately 90% of maximal binding. Assays contained 20 mM Tris-HCl (pH 8.0), 150 mM KCl, 1 mM EDTA, 1 ng/µL tRNA, 1 ng/µL heparin, 0.4 U/µL RNasin, and 500 ng/µL RNase-free bovine serum albumin (BSA). A sequential protocol was used to assess changes in anisotropy, intrinsic fluorescence of test compounds, the compounds’ influence on the anisotropy signal of the probe alone, and the ability of compounds to inhibit binding of IMP-1 to flMyc. First, plates were loaded with 10 µL binding buffer containing fluorescein-labeled c-Myc RNA probe (2-fold in binding buffer) with a Matrix PlateMate Plus dispenser (Thermo Scientific, Waltham, MA) in every well. Then, 100 nL of each test compound from the 1-mM compound plates was transferred to each well of the test plates using the Matrix PlateMate Plus robotic pin transfer apparatus. Next, fluorescence polarization/anisotropy (FP/FA) was determined using an Analyst HT Plate Reader (Molecular Devices, Sunnyvale, CA). FITC FP 480 (excitation) and 535 (emission) filters were used. Then, 10 µL of binding buffer and IMP-1 protein (final assay concentration 10 nM) was added to each well except control wells, which received 10 µL of binding buffer. FP/FA for each well was measured after 15 min, when the assay had reached equilibrium as determined from kinetic studies of the ON and OFF rate of IMP-1 binding to flMyc. Thus, in the final assay, compounds were tested at 5 µM for their ability to inhibit binding of 10 nM IMP-1 to 1 nM flMyc RNA probe. Columns 23 and 24 on each plate contained DMSO and no test compounds, and these wells served as screening controls.
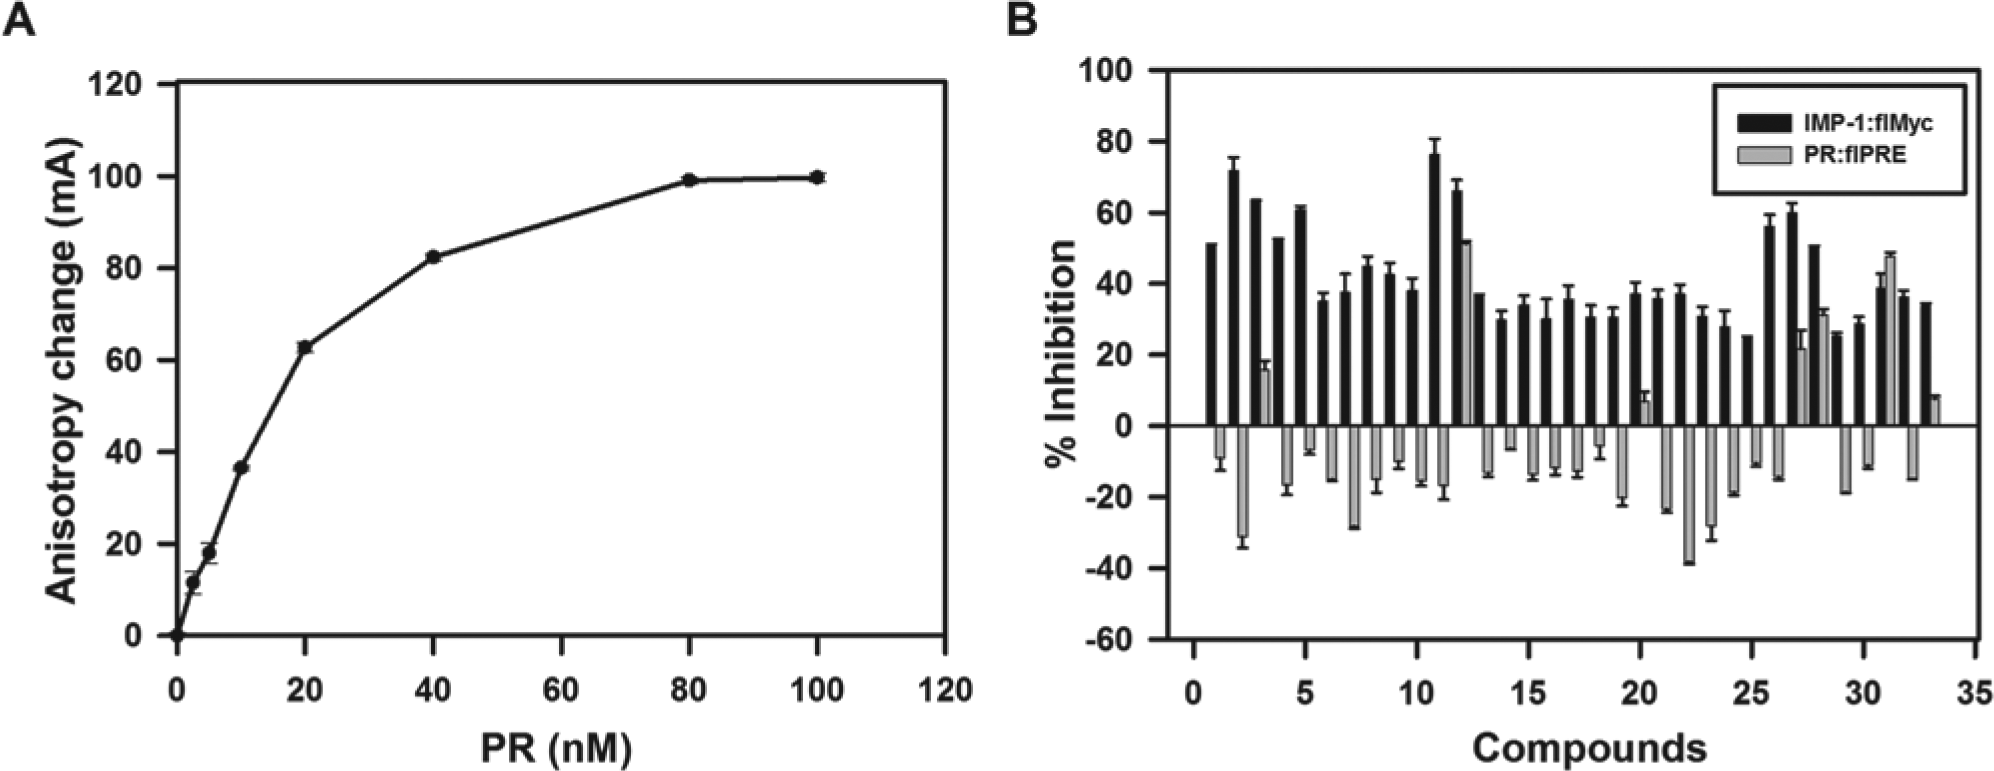
For follow-on tests for specificity, flPRE was diluted to 1 nM in a binding buffer containing 15 mM Tris-HCl (pH 7.9), 100 mM KCl, 1 mM DTT, 5% glycerol, 0.05% Nonidet P-40 (NP-40), 100 ng poly dI:dC (nonspecific competitor), and 250 ng/µL BSA. The protocol for assessing change in anisotropy was similar to the one described above for the IMP-1:flMyc experiments, except that compounds were tested at a final concentration of 10 µM for their ability to inhibit binding of PR to the flPRE DNA probe. The concentration of PR used in the follow-on assay, 35 nM, is not saturating and is highly responsive to inhibition.
Data Analysis and Hit Scoring
To determine the robustness of our screening assay, the Z′ factor for each plate was calculated as previously described. 22 A Z′ factor greater than 0.5 describes a robust assay suitable for HTS. 22 The results from the pilot screen were further analyzed using a simple program we developed to evaluate and score different parameters and identify the most promising compounds from HTS. Initially, compounds that altered the overall fluorescence intensity by ≥30% compared with control wells were considered either enhancers or quenchers and were excluded from further analysis. The remaining compounds were evaluated for percent inhibition, which was calculated relative to the assay plate control wells, where % inhibition = {1 – [(mAComp – mAMin)/( mAMax – mAMin)]} × 100, where the assay minimum (mAMin) is flMyc RNA alone and the assay maximum (mAMax) is flMyc with IMP-1 protein. Although there is no universally accepted standard of what change in signal constitutes a “hit” suitable for further evaluation, some researchers consider that any small molecule that results in a change of more than three standard deviations (SD) from the mean is appropriate for further study. The mean ± SD change in anisotropy for the compounds in the pilot HTS was 86.7 ± 6.7 mA. The SD is 7.7% (6.7/86.7), and 3× SD is ~25%. We therefore carried out further analysis of small molecules that, when present at 5 µM, altered the average change in anisotropy for binding of IMP-1 to flMyc by at least 25%. Compounds that met fluorescence intensity criteria and the percent inhibition cutoff were considered primary hits and cherry-picked for follow-on assays.
Cell Culture and siRNA Transfection
IMP-1–positive IGROV-1 ovarian cancer cells and IMP-1–negative PC-3 prostate cancer cells were used in cell-based experiments. IGROV-1 cells were maintained in phenol red–free RPMI 1640 with 10% fetal bovine serum (FBS), and PC-3 cells were maintained in Dulbecco’s modified Eagle’s medium (DMEM)–F12 with 10% FBS. Cells were grown in a monolayer and were maintained at 37 °C with 5% CO2. IGROV-1 and PC-3 cells were plated in 96-well plates at a density of 1000 cells/well and transfected with an IMP-1 small interfering RNA (siRNA) SMARTpool (Dharmacon, Lafayette, CO) or a noncoding control siRNA using Dharmafect 1 transfection reagent (Dharmacon, Lafayette, CO) according to the supplier’s protocol. Five days after transfection, cell viability was determined using CellTiter 96 Aqueous One Solution Reagent (Promega, Madison, WI). For both cell lines, relative cell proliferation was calculated as previously described. 23
Testing Hits for Inhibition of Cell Proliferation
IGROV-1 and PC-3 cells were maintained and plated in 96-well plates as described above. Each cell line was plated in growth medium 24 h before treatment. Treatment medium contained either 0.4% DMSO (vehicle) or inhibitor compounds at a final concentration of 20 µM in DMSO. After 3 days, cell viability was determined using Promega CellTiter 96 Aqueous One Solution Reagent (MTS). For each compound, percent inhibition of cell proliferation was calculated relative to assay plate DMSO controls, which were set to 0% inhibition. Small molecules were considered potential leads if percent inhibition of proliferation of the IMP-1–positive IGROV-1 cells was at least 3-fold higher than percent inhibition of the control IMP-1–negative PC-3 cells.
Western Blots
Cells were trypsinized, resuspended in their respective culture media, and plated into 6-well plates at a density of 300,000 cells/well. Cells were harvested and washed in ice-cold phosphate-buffered saline (PBS), and whole-cell extracts were prepared in lysis buffer containing 1× radioimmunoprecipitation assay (RIPA) buffer (Millipore, Billerica, MA), 1 mM EGTA, 30 mM NaF, 2.5 mM sodium pyrophosphate, 1 mM sodium orthovanadate, 1 mM β-glycerol phosphate, 1 mM phenylmethylsulfonyl fluoride, and 1 tablet of protease inhibitor cocktail (Roche, Indianapolis, IN). Cells were collected, and debris was pelleted by centrifugation at 15,000 g for 10 min at 4 °C. The supernatants were collected and stored at −20 °C. Then, 20 µg total protein was loaded onto 10% (v/v) SDS-PAGE gels, separated, and transferred to nitrocellulose (GE Healthcare, Piscataway, NJ). IMP-1 protein was detected using IMP-1 antibody sc-21026 (Santa Cruz Biotechnology, Santa Cruz, CA), and β-actin internal standard was detected using antibody A1978 (Sigma, St. Louis, MO).
Results
Validation of the HTS Assay
We developed the FAMA for analyzing the interaction of RNA and DNA binding proteins with their recognition sequences.16,21 In demonstrating the utility of FAMA for analysis of RNA-protein interactions, we examined the ability of CRD-BP/IMP-1 expressed in Escherichia coli and renatured from inclusion bodies to bind to a fluorescein-labeled c-Myc (flMyc) RNA binding site. Binding was low affinity with an apparent KD of several hundred nanomolar. 16 Nielsen and coworkers 24 reported that epitope-tagged IMP-1 binds poorly to RNAs and developed an expression system for recombinant untagged IMP-1 using E. coli stably expressing several rare tRNAs and a purification protocol that selects for biologically active IMP-1. 19 We expressed and purified IMP-1 using an update of this expression-purification system and obtained purified untagged IMP-1 that was >90% homogeneous ( Fig. 2B ).
To identify small-molecule inhibitors that target IMP-1, we used modified binding conditions and a far more active IMP-1 preparation to update and improve our earlier assay for IMP-1 binding to flMyc. 16 Purified untagged recombinant IMP-1 exhibited saturable high-affinity binding to the fluorescein-labeled 93-nucleotide (nt) c-Myc RNA site (starting at nt 1705), which contains the IMP-1 binding site ( Fig. 2C ). Under these binding conditions, the apparent Kd (the protein concentration at which 50% of the probe was bound) for IMP-1 binding to the flMyc was ~3 nM. Based on the binding data ( Fig. 2C ), we selected 10 nM IMP-1 for screening, which yields approximately 90% of maximum binding to flMyc, resulting in a large anisotropy change (ΔmA) and a robust assay while remaining highly responsive to inhibition by small molecules. In this assay, small-molecule inhibitors will reduce the anisotropy change seen on binding of IMP-1 to flMyc ( Fig. 2A ).
Binding of IMP-1 to the flMyc RNA is sequence and structure specific. Because IMP-1 binds unstructured single-stranded RNA, we tested the possibility that IMP-1 primarily interacts with the charged phosphate backbone. With the identification of an important role for polyphosphate in blood clotting, 25 polyphosphate with a length similar to the flMyc RNA became available to us for testing. Even at 1000-fold molar excess, polyphosphate does not compete for IMP-1 binding ( Fig. 2D ). Therefore, interaction with the charged phosphate backbone is not responsible for high-affinity binding of IMP-1 to RNAs. Binding of IMP-1 to flMyc was specific, as tRNA, even at 1000-fold molar excess, had minimal ability to compete for binding ( Fig. 2D ). Addition of the unlabeled c-Myc RNA resulted in a concentration-dependent reduction in binding. A 2.5-fold molar excess of the unlabeled c-Myc RNA reduced binding of IMP-1 to flMyc by approximately 50% ( Fig. 2D ).
The performance of the optimized binding assay was evaluated for its stability. Under our assay conditions, binding of IMP-1 to flMyc is highly stable at room temperature and insensitive to changes in DMSO concentration. Using 10 nM IMP-1 and screening conditions, after 60 min at 25 °C, activity was 97% of the initial activity (ΔmA at 60 min was 91.1 ± 1.3 vs. initial ΔmA of 94.1 ± 0.3; Fig. 2E ). DMSO at the concentration to be used in the screen, as well as at twice that concentration, had no effect on binding of IMP-1 to flMyc ( Fig. 2F ). Thus, our assay had the requisite qualities for evaluation in a medium-scale pilot screen.
Pilot Screen for IMP-1 Inhibitors
To validate the assay and identify small molecules that inhibit binding of IMP-1 protein to flMyc RNA, we carried out a pilot screen using 17,600 compounds (plates 1–50) from the Chembridge Microformat Library. The performance of the optimized binding assay for use in HTS was evaluated for robustness by calculating the Z′ factor for each of the 50 plates screened. The assay demonstrated robust performance, with a mean ± SD Z′ factor of 0.60 ± 0.06 ( Fig. 3A ) and a signal-to-noise (S/N) ratio of 12.4. The mean ± SD change in anisotropy for the compounds in the pilot screen was 86.7 ± 6.7 mA. The pilot screen statistical parameters are summarized in Table 1 .
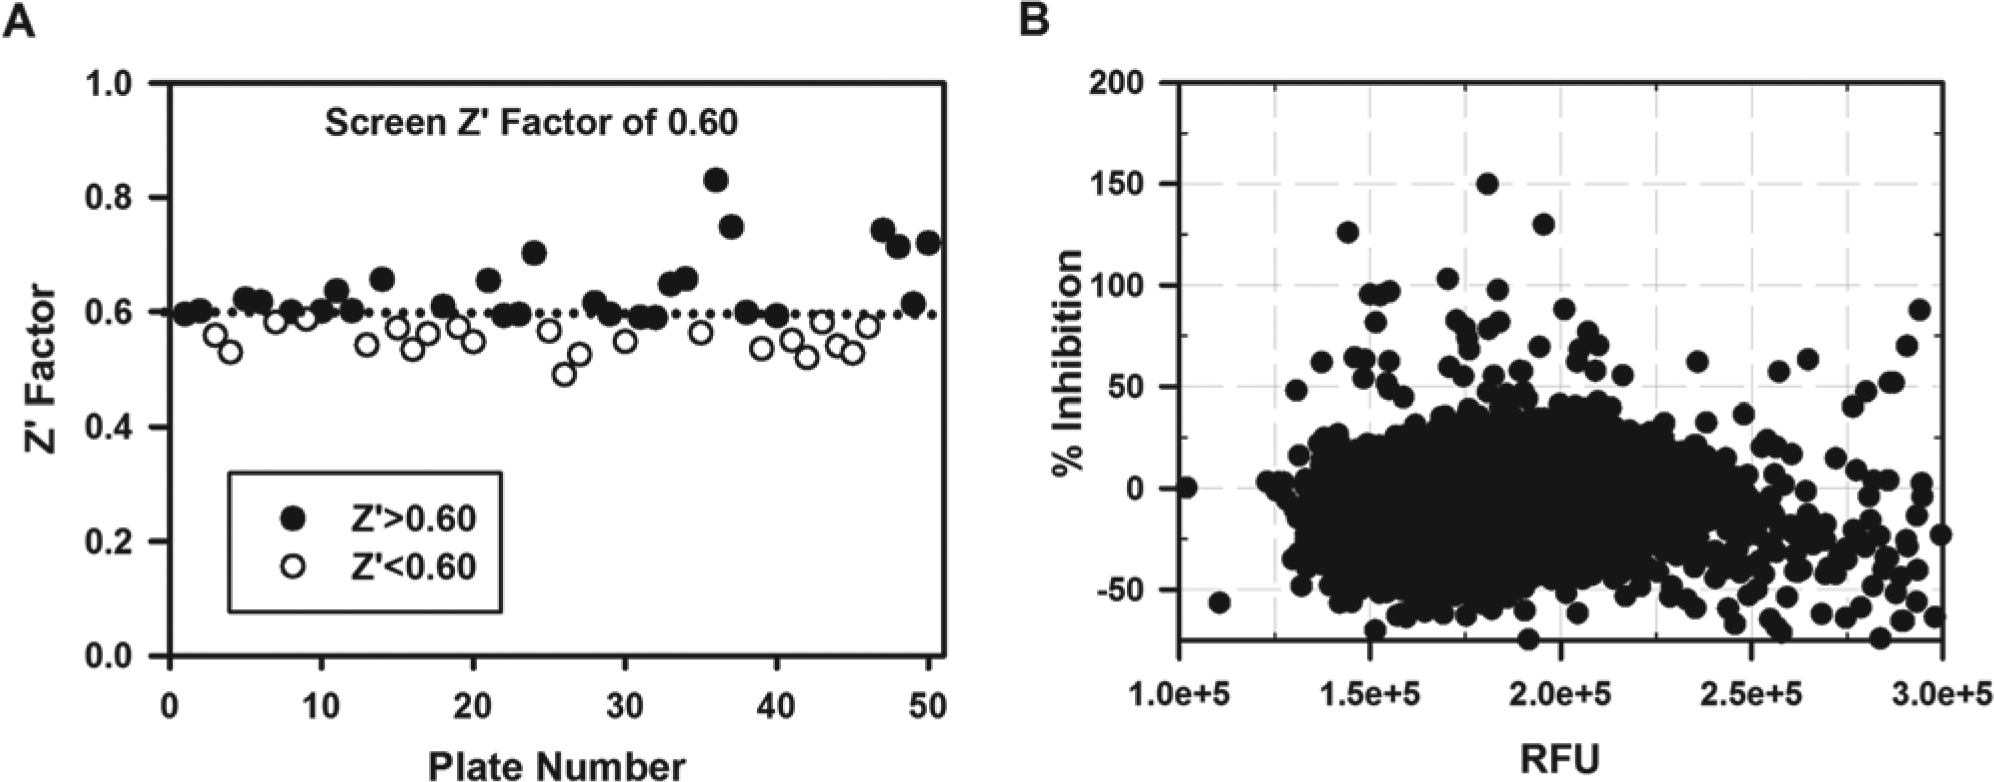
Assay validation and high-throughput screening (HTS) results. (
Summary of Statistical Data from the Pilot Screen.
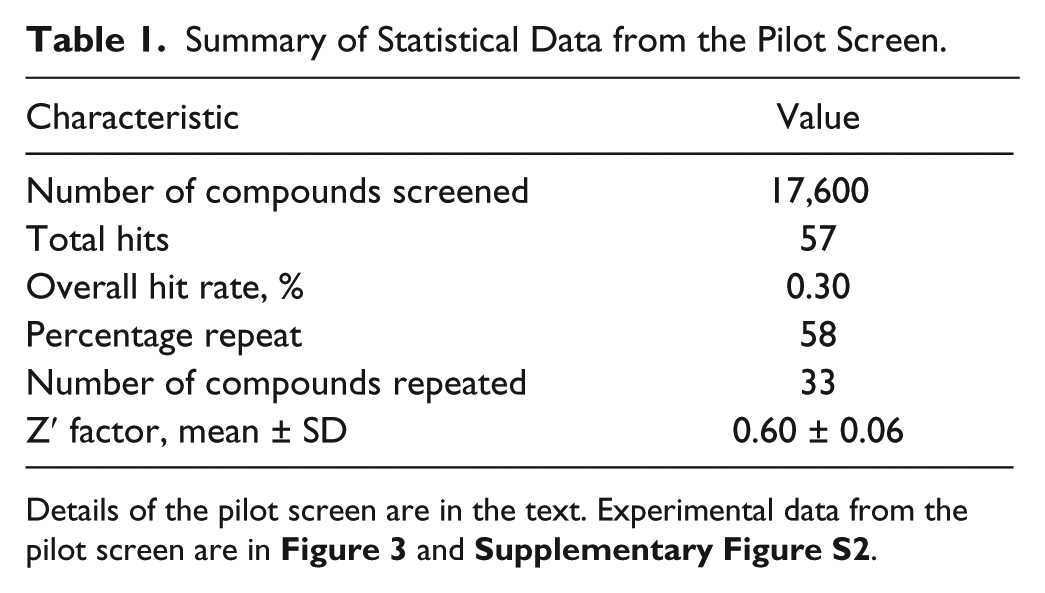
Details of the pilot screen are in the text. Experimental data from the pilot screen are in
Figure 3
and
For the primary screen, compounds exhibiting increases or decreases ≥30% in total fluorescence intensity compared with controls were considered either enhancers or quenchers and were excluded from analysis. Similar cutoffs have been used on other FP/FA screens.26,27 For the remaining compounds, we chose a cutoff of at least 25% inhibition (which is ~3× SD) at a final compound concentration of 5 µM and identified 57 primary hits (hit rate 0.32%, 57/17,600). Figure 3B is a scatterplot for the 17,600 compounds from the pilot screen.
To validate the 57 hits, we compared their ability to inhibit a control protein–nucleic acid interaction—binding of PR, a steroid hormone receptor, to its DNA binding site, the flPRE ( Fig. 4A )—with their ability to inhibit IMP-1 binding to flMyc. Triplicate assays in small-volume 384-well plates used the same method described for the primary screen. At 5 µM, 33 compounds inhibited binding of IMP-1 to flMyc by >25% ( Fig. 4B ). Our counterscreen for specificity used binding of PR to the flPRE in part because it exhibits a change in anisotropy whose magnitude is similar to that seen for the primary assay using IMP-1 and flMyc ( Fig. 4A ). Our aim was to quickly identify potential false positives that displayed high affinity for nonspecific nucleic acid sequence or binding proteins rather than for the IMP-1:cMyc interaction and to identify small molecules that display a high affinity for DNA, such as ethidium bromide and other DNA intercalators. To provide a stringent test for specificity, we evaluated the ability of the verified hits to inhibit binding of PR to the flPRE at 10 µM, twice the concentration used in the IMP-1 screen and verification assays. As shown in Figure 4B , only 3 of the 33 verified hits exhibited greater than 25% inhibition of PR:flPRE binding.
Evaluation of hits for potency and specificity. Hits from the primary screen were verified and evaluated for specificity in follow-on assays. (
Evaluating Hits for Inhibition of Cell Proliferation
Elevated expression of IMP-1 in cancer cells is associated with increased cell proliferation, which likely stems from stabilizing c-Myc and other oncogene mRNAs (
Fig. 1
). Evaluating the ability of verified hits that inhibit binding of IMP-1 to c-Myc to also inhibit effects of IMP-1 on cell proliferation provides a critical test of their effect on a key cancer-related function of IMP-1. To establish the cell proliferation assay, we carried out RNAi knockdown of IMP-1 in IMP-1–positive IGROV-1 ovarian cancer and in IMP-1–negative PC-3 prostate cancer cells (
We evaluated the effects of all the verified inhibitors from the in vitro pilot screen in cell proliferation assays in IMP-1–positive IGROV-1 cells and IMP-1–negative PC-3 cells. Our recent study identifying a small-molecule inhibitor of androgen receptor confirms that PC-3 cells are a suitable toxicity control and are quite sensitive to small molecules exhibiting nonspecific toxicity.
28
Data are shown for a lead inhibitor and for representatives of the other classes of small molecules (
Fig. 5
). The lead small molecule inhibits proliferation of IMP-1–positive IGROV-1 cells, with very little or no effect on IMP-1–negative PC-3 cells (
Fig. 5
). Our lead small molecule inhibited binding of IMP-1 to flMyc (72% ± 3.6% inhibition at 5 µM) and did not inhibit binding of PR to the flPRE (−31% ± 3.2% inhibition at 10 µM). Thus, the lead compound demonstrated efficacy and selectivity both in the in vitro assays using purified proteins and in the cell-based assays. Additional evidence of the robust nature of our screen is shown by the fact that the lead inhibitor had a Z score of −6.8 and was clearly differentiated from the other compounds on its HTS plate (
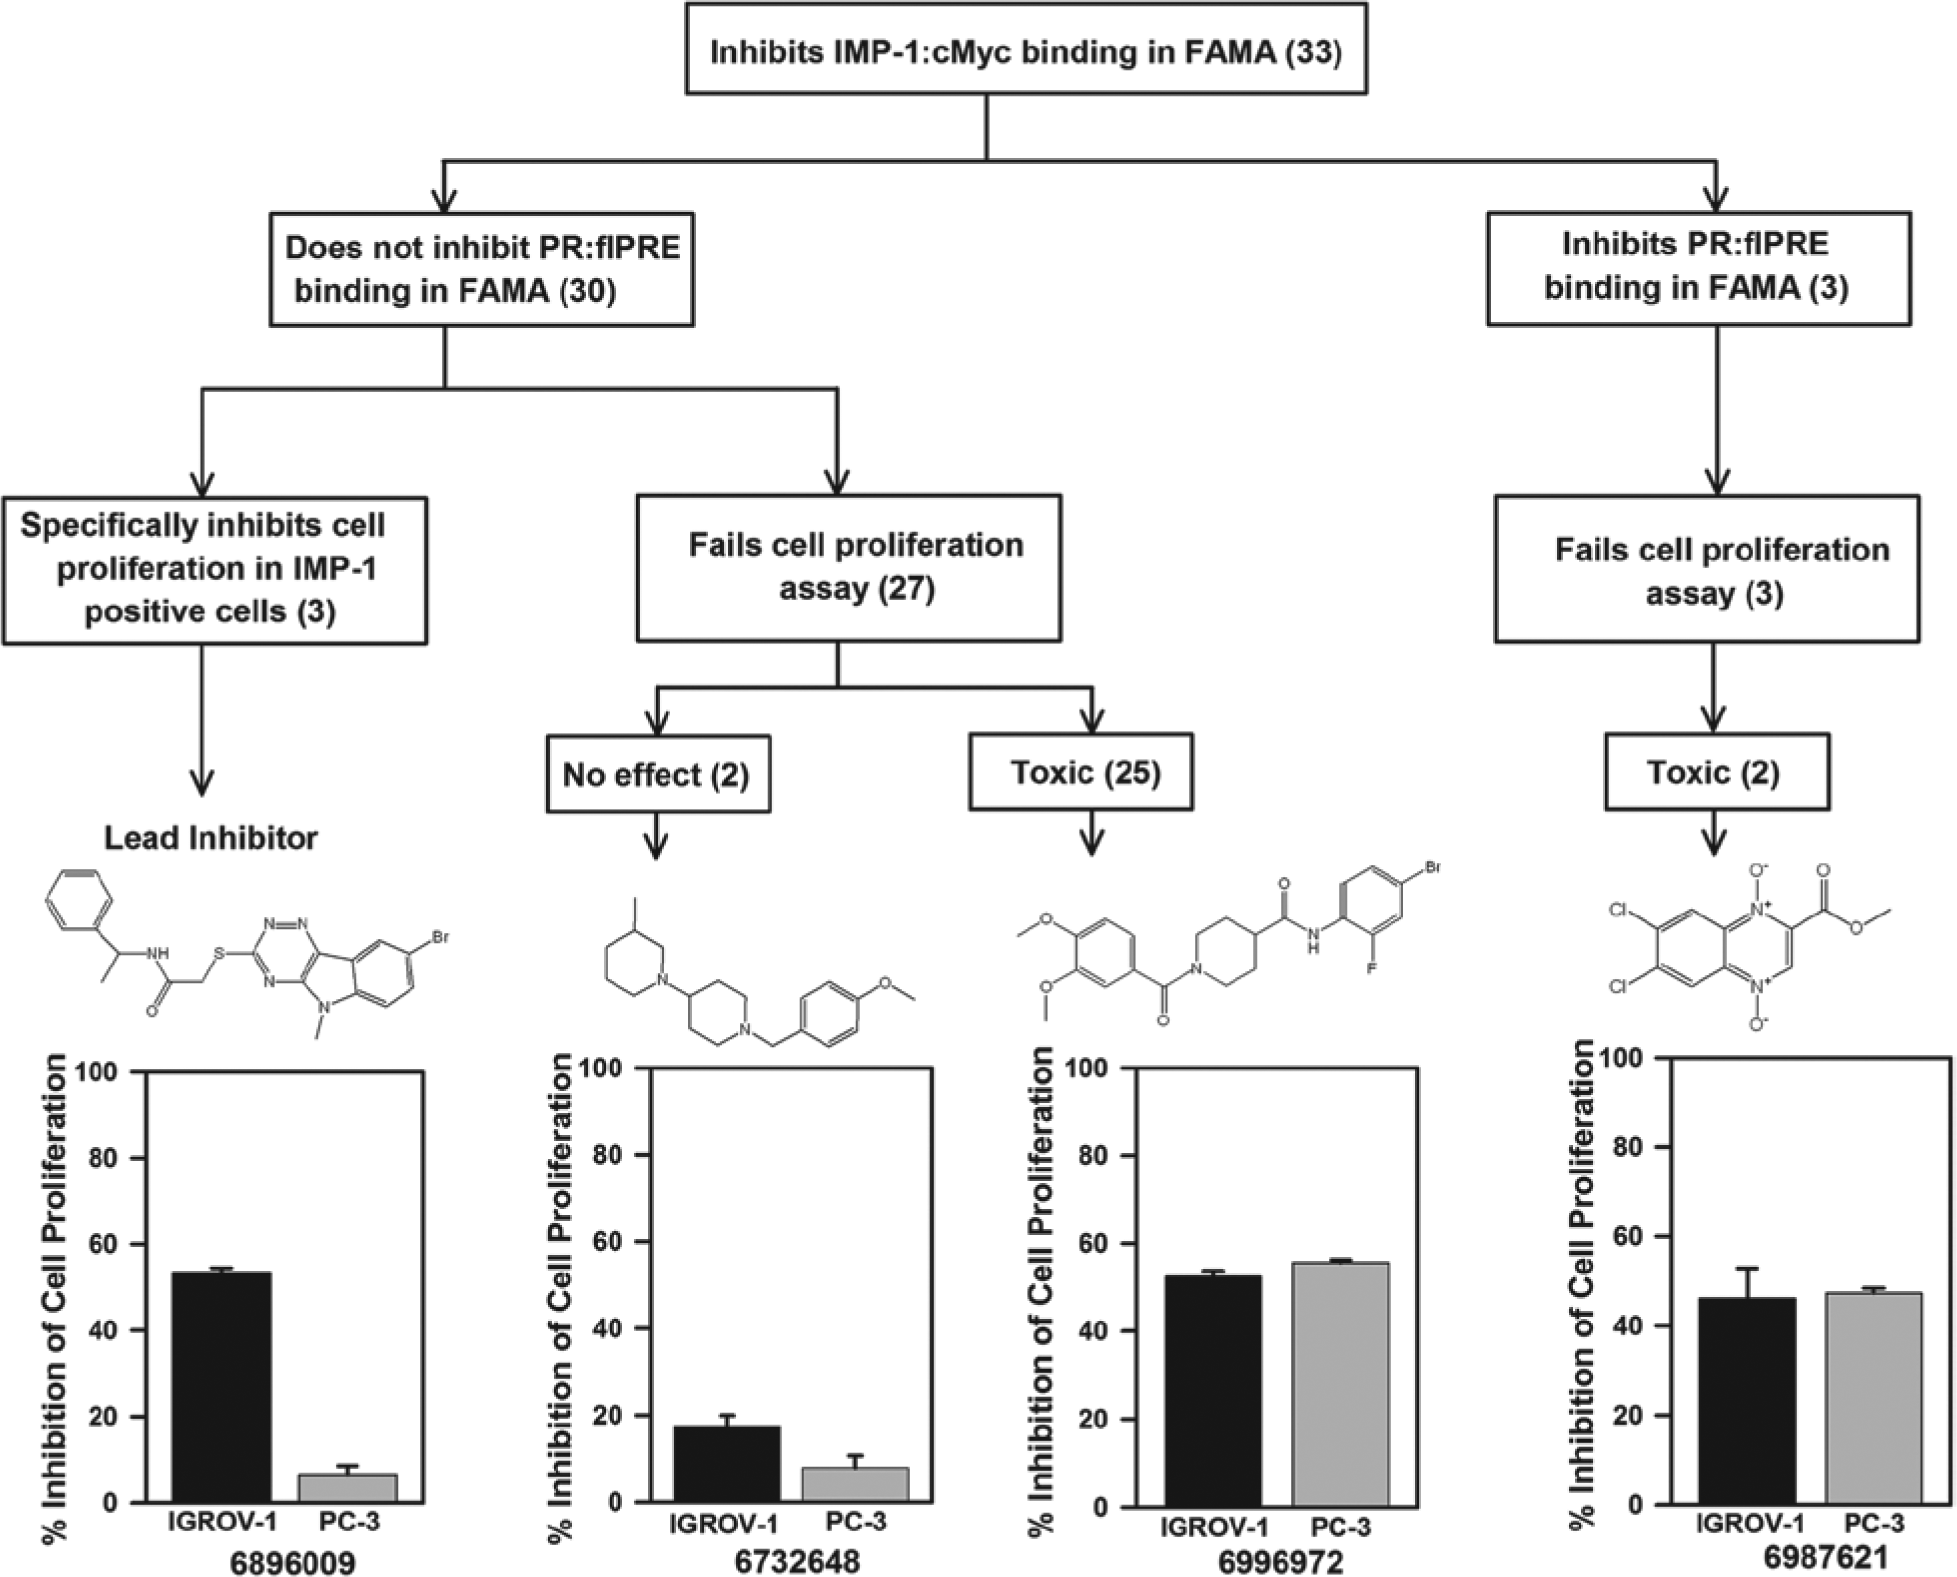
Scheme for categorizing representative compounds from the pilot screen. Compounds were categorized based on their properties in the fluorescence anisotropy microplate assay (FAMA) and cell proliferation studies. Cell proliferation data for representative compounds in each category are presented below their structures and the Chembridge number is shown. Compounds were assayed at 20 µM in IMP-1–positive IGROV-1 cells and in IMP-1–negative PC-3 cells. The four categories (from left to right) are the lead IMP-1 inhibitor, a compound that passed the IMP-1 inhibition and PR inhibition assays but did not inhibit proliferation of either cell line, a compound that passed the IMP-1 and PR assays and exhibits nonspecific toxicity because it inhibits proliferation of both the IGROV-1 cells and the IMP-1–negative PC-3 cells, and a compound that failed the specificity test because it inhibited progesterone response (PR) binding to the progesterone response element (PRE) and also was toxic to the PC-3 cells. Set to 100% was cell proliferation for each cell line treated with DMSO vehicle. The data represent the average ± SEM (n = 4).
Discussion
Expression of IMP-1 is implicated in several human cancers. While Kaplan-Meier survival plots show a tight correlation between IMP-1 expression and survival (p < 0.05 for ovarian, lung, and colon cancer), IMP-1 is also strongly implicated in melanomas6,8,29 and other cancers. IMP-1 is an oncofetal protein expressed in fetal cells and cancer cells and nearly absent in most somatic cells.30,31 Thus, IMP-1 is an excellent therapeutic target. Although a high-affinity binding site for IMP-1 that is implicated in the regulation of c-Myc mRNA degradation was identified a number of years ago, small-molecule biomodulators to probe the actions of IMP-1 and inhibit its activity in cancer cells have not been described. The substantial >90 nucleotide size of the high-affinity IMP-1 binding site in c-Myc mRNA, the lack of a clear consensus IMP-1 RNA binding site,32,33 and wide variations in the affinity of observed IMP-1 preparations for RNA1,16,19 all complicate development of a high-throughput screen. We show that purified IMP-1 binds with high affinity and specificity to the c-Myc binding site. Even at a 1000-fold molar excess, tRNA and polyphosphate had very little ability to compete with flMyc for IMP-1 binding ( Fig. 2D ). Thus, binding of IMP-1 to flMyc exhibited the requisite specificity for HTS.
Our primary screen used an in vitro assay for inhibition of binding of purified IMP-1 to flMyc rather than an assay for inhibition of cell proliferation for several reasons. In our hands, it is difficult to obtain the requisite reproducibility in cell-based assays for proliferation inhibitors in 384-well plates. More important, the in vitro assay using purified IMP-1 provides direct evidence that the primary hits actually inhibit the desired target—the IMP-1:flMyc interaction. Although recent studies show that IMP-1 stabilizes numerous mRNAs, 32 we focused on identifying small-molecule inhibitors of IMP-1 binding to c-Myc mRNA because the specific sequence on c-Myc mRNA, the coding region determinant (starting at nt 1705), is the best defined and most extensively studied IMP-1 binding site. For other oncogene mRNAs stabilized by IMP-1, the IMP-1 binding sites are poorly defined.1,3 We performed a pilot screen of 17,600 small molecules and identified 30 compounds that showed selective inhibition of IMP-1 binding to flMyc RNA and did not inhibit binding by the control DNA binding protein, PR to its DNA binding site, the PRE. We further evaluated the candidate compounds in physiologically relevant assays that are important to IMP-1’s function by assessing cell proliferation in IMP-1–positive and IMP-1–negative control cells. By complementing in vitro assays to analyze specific inhibition of IMP-1:c-Myc binding with cell-based assays that evaluate an important biological end point in cancer cells, we identified a lead small-molecule inhibitor of IMP-1.
Identifying inhibitors of RNA binding proteins is challenging.34,35 Interestingly, we found that most of the compounds identified from our in vitro studies did not fail to work in intact cells; rather, they were toxic in a control cell line. This suggests that future HTS campaigns to identify inhibitors of RNA binding proteins may benefit from initial use of biochemical assays to identify specific inhibitors with early follow-on cell-based filtering assays to evaluate toxicity. This approach not only identifies specific inhibitors using in vitro binding but also characterizes a subset of those compounds exhibiting an important physiological function.
This work represents a promising start toward identification of small-molecule inhibitors of IMP-1 and describes a path for HTS to identify additional small-molecule IMP-1 biomodulators. The lead inhibitor we describe represents an important initial biomodulator for laboratory studies and further characterization; it is a candidate for structure-activity relationship studies and medicinal chemistry optimization to evaluate its ultimate therapeutic potential.
Footnotes
Acknowledgements
We are most grateful to Dr. J. Christiansen for the IMP-1 expression plasmid, the modified E. coli strain for expressing IMP-1, and for information on IMP-1 purification and to Dr. S. Nordeen for the purified PR.
Declaration of Conflicting Interests
The authors declared no potential conflicts of interest with respect to the research, authorship, and/or publication of this article.
Funding
The authors disclosed receipt of the following financial support for the research, authorship, and/or publication of this article: Supported by institutional funds and in part by National Institutes of Health (NIH) DK-017909 and NIH R21CA173527.
References
Supplementary Material
Please find the following supplemental material available below.
For Open Access articles published under a Creative Commons License, all supplemental material carries the same license as the article it is associated with.
For non-Open Access articles published, all supplemental material carries a non-exclusive license, and permission requests for re-use of supplemental material or any part of supplemental material shall be sent directly to the copyright owner as specified in the copyright notice associated with the article.