
Abstract
Cancer cells in vivo are coordinately influenced by an interactive 3D microenvironment. However, identification of drug targets and initial target validations are usually performed in 2D cell culture systems. The opportunity to design 3D co-culture models that reflect, at least in part, these heterotypic interactions, when coupled with RNA interference, would enable investigations on the phenotypic impact of gene function in a model that more closely resembles tumor growth in vivo. Here we describe a high-throughput–compatible method to discover cancer gene functions in a co-culture 3D tumor microtissue model system composed of human DLD1 colon cancer cells together with murine fibroblasts. Strikingly, DLD1 cells in this model failed to expand upon siRNA-mediated depletion of Kif11/Eg5, a member of the mitotic kinesin-like motor protein family. In contrast, these cancer cells proved to be more resistant to Kif11/Eg5 depletion when grown as a 2D monolayer. These results suggest that growth of certain cancer cells in 3D versus 2D can unveil differential dependencies on specific genes for their survival. Moreover, they denote that the high-throughput–compatible, hanging drop technology-based 3D co-culture model will enable the discovery, characterization, and validation of gene functions in key biological and pathological processes.
Introduction
Modulation of gene function using RNA interference (RNAi) technology with arrayed small interfering RNA (siRNA) or small hairpin RNA (shRNA) in mammalian tissue culture cells has been successfully applied for systematic genome-wide studies in high-throughput screens to elucidate cell signaling mechanisms and identify novel drug targets and genetic vulnerabilities.1–3 Although many potential drug targets have been discovered with this approach, most of them did not turn out to be robust enough to withstand rigorous validation in subsequent preclinical models. 4 One difficulty that limits the robustness of such findings in subsequent validation studies relates to clear differences between the behavior and response of cells grown in 2D monolayers versus their growth in vivo upon perturbation of gene function(s). In vivo, cancer cells are embedded in an interactive 3D microenvironment and therefore get continuously influenced by multiple factors such as noncancer cells, tumor stroma, the mechanical and chemical properties of the surrounding extracellular matrix, and systemic and local regulators. Therefore, providing a cellular model system that allows the application of high-throughput screening and represents closer the key features of cancer cell growth in vivo is expected, in the long run, to effectively reduce the high attrition rate of potential drug targets during the validation phase.
The 3D culturing of cells has been shown to resemble morphologically but also, in terms of gene expression patterns, more closely the state in living organisms. 5 Therefore, performing genetic as well as chemical screens in 3D tissue culture models is expected to foster discovery of novel targets that better withstand testing in animal models with higher success rates, as is currently the case. 4 Although a recent siRNA knockdown study of Sdccag8 in a 3D epithelial microtissue model has highlighted the role of this gene product in perturbing lumen formation in renal epithelial cells, 6 most of the current scaffold- and hydrogel-based 3D technologies prevent routine implementation into standardized screening setups mainly due to automation and high-throughput incompatibility. The production and assaying of multicellular microtissues allow adaptation of existing screening protocols with only marginal adaptations. 7 Moreover, multiple cell types can be implemented into a 3D microtissue model similar to the cell populations that are found in the tumor environment such as cancer and endothelial cells.8–10 Here we describe a high-throughput–compatible method to perform target identification and validation using RNAi in a 3D co-culture tumor microtissue (TMT) model produced with the hanging drop technology. The colon cancer cell line DLD1, stably engineered to express enhanced green fluorescence protein (EGFP) as a fluorescent reporter, was grown in combination with mouse NIH3T3 fibroblasts. The impact of siRNA-mediated depletion was assessed by measuring fluorescence intensity and phenotypic changes over time. Interestingly, whereas depletion of Kif11/Eg5 did not strongly affect DLD1 cell growth in 2D monolayer cultures, strong growth inhibitory effects were observed in the 3D co-culture TMT model.
Materials and Methods
Generation and Maintenance of Cell Lines
DLD1 cells (Sigma-Aldrich, St. Louis, MO) were maintained in RPMI 10% fetal calf serum (FCS). Stable transfection of cells with lentiviral vectors has been described previously. 11 DLD1 cells were infected with pLentipuro vectors (#17452; Addgene, Cambridge, MA) expressing EGFP (DLD1-EGFP) or DsRed-IRES-EGFP reporter cassette with EGFP, d4EGFP, or d1EGFP to create DLD1 cell pools that express from the same transcript DsRed as well as EGFP fusions with mutants of the ornithine decarboxylase (ODC) degron that confer different half-lives (d1EGFP, t1/2 = 1 h; d4EGFP, t1/2 = 4 h12) (gift from Stephen Elledge, HMS, Boston, MA). Infected DLD1 cells were selected in growth medium containing puromycin (2 µg/mL). NIH3T3 (ATCC) and NIH3T3-RFP (Sirion Biotech, Munich, Germany) cells were maintained in Dulbecco’s modified Eagle’s medium (DMEM) 10% FCS.
siRNA-Mediated Gene Depletions
For knockdown studies in 3D microtissues and 2D cultures, cells were reverse transfected in 96-well microplates with siRNAs (Dharmacon, Lafayette, CO) against EGFP (siEGFP, P-002048-01-20), Kif11 (M-003317-01), and a nontargeting control pool (D-001206-14-05) or a biotinylated siRNA against EGFP (TMOSLR-000556) for histology experiments. A mix was prepared in 20 µL OptiMEM containing 2 pmoles siRNA and 0.2 µL Dharmafect 2 and incubated for 20 min at room temperature before adding 10,000 cells in 100 µL growth medium.
3D Co-culture Microtissue Formation
Microtissues composed of DLD1 and NIH3T3 cells and the various fluorescent protein-expressing derivates were produced in 96-well hanging drop microplates (GravityPLUS; InSphero AG, Zurich, Switzerland) in 3D microtissue cell line formation medium (3D InSight, Cell Line Maintenance Medium; InSphero AG). DLD1 and NIH3T3 cells were mixed at indicated ratios and cultivated for 3 days until cells assembled to a compact spheroid. After 3D microtissue formation, spheroids were transferred into the assay plates (GravityTRAP; InSphero AG) and cultivated in cell line maintenance medium (serum-containing DMEM based without phenol red; InSphero AG) for a total of 10 days. Medium was refreshed at days 2 and 4 posttransfer to assay plates.
Fluorescence Intensity and Growth Monitoring of 3D and 2D Cultures
Microtissue as well as cell growth in monolayers was monitored by measuring EGFP, red fluorescent protein (RFP), or DsRed signal intensities with a plate reader (Infinity M200pro or M1000pro; TECAN, Männedorf, Switzerland), with relative fluorescence units (RFU) background subtracted if not otherwise stated: for mono-cultures, a “medium blank” signal served as background, whereas for co-cultures with NIH3T3 cells, the signal of “NIH3T3” cells served as background. Fluorescence imaging of 3D microtissues was performed at day 6 or 10 with a Zeiss Axiovert 200m microscope (Carl Zeiss, Oberkochen, Germany). Bright-field microscopy images to determine microtissue size and morphology over time were acquired with a Zeiss Axiovert 25 microscope (Carl Zeiss). Microtissue diameter was assessed by an image-based determination of average diameter (ellipse fit) using ImageJ software (National Institutes of Health, Bethesda, MD). 13
Immunofluorescence on Cryosections
Microtissues were harvested, washed once with phosphate-buffered saline (PBS), and fixed for 1 h at room temperature with 4% paraformaldehyde (PFA). The tissues were equilibrated in 30% sucrose/PBS overnight followed by embedding in Tissue Tek OCT compound and molds (Sakura, Alphen aan den Rijn, the Netherlands). Embedded tissues were processed with a CryoStar NX70 (Carl Zeiss) into 5-µm-thin slices for immunofluorescence. Slices on glass slides were washed in PBS and incubated 2 min in EtOH and washed again in PBS before blocking for 1 h in blocking solution (PBS, 5% bovine serum albumin, 5% goat serum, 0.05% Tween-20, and 0.025% TX-100). Detection of biotinylated siEGFP was performed with streptavidin-Cy3 (Biolegend, San Diego, CA) diluted 1:600 in blocking solution. Slides were embedded with vectashield-DAPI (Vector Laboratories, Burlingame, CA). Images were acquired with a Zeiss Axioplan 2 microscope (Carl Zeiss).
Transcription Analysis with qPCR
Transcription analysis was performed on total RNA isolated 48 h after reverse transfection with corresponding siRNAs as described, 14 with normalization done against GAPDH. The following primer pairs were used: Kif11,a (5′-TCCCTTGGCTGGTATAATTCCA-3′; 5′-GT-TACG-GGGATCATCAAACATCT-3′), Kif11,b (5′-TGTTTGAT-GATCCCCGTAACAAG-3′; 5′-CT-GAGTGGGAACGACT AGAGT-3′), and GAPDH (5′-GAAGGTGAAGTTC GGAGTC-3′; 5′-GAAGAT- GGTGATGGGATTTC-3′).
Statistical Analysis
Statistical comparisons were performed using a two-sample t test. Nominal significance level of each univariate test was 0.05. A Z′ factor was calculated as described in Zhang et al.,
15
with the formula
Results and Discussion
For establishing a co-culture 3D tumor spheroid-based siRNA validation and screening system, we designed and followed the experimental outline illustrated in
Initially, we evaluated three versions of EGFP with different stabilities each expressed from plasmids that transcribe Discosoma species red (DsRed) fluorescent complementary DNA (cDNA) linked to an internal ribosomal entry site (IRES), followed by various EGFP cDNAs (DsRed-IRES-EGFP). EGFP is expressed as wild type and derivatives of it, where the EGFP protein is fused to different versions of the ODC degron, leading to different EGFP half-lives (EGFP, t1/2 ~24 h; d4EGFP, t1/2 ~4 h; and d1EGFP, t1/2 ~1 h). 12 The 3D TMTs were generated with DLD1 cell lines each stably expressing one of these plasmids, and the intensity of the EGFP signal was followed over the indicated time. As shown in Figure 1A , the wild-type form of EGFP demonstrated an abundant signal over background, and the signal increased over time as the 3D TMTs grew, indicating that it is suitable as a readout to monitor growth of TMTs. Measurements of the DsRed signal produced by the various constructs show equal signals over time ( Fig. 1A ). Even though initial TMT size on day 4 was the same ( Fig. 1B ), the signals produced by the EGFP derivatives with reduced half-lives (d4 and d1) failed to reach levels above background ( Fig. 1A ) and thus were not further considered for growth profiling with this assay. Consistent with this, when TMTs expressing the various DsRed/EGFP derivatives were treated with staurosporine (STS) to induce apoptosis, we observed a decline in the EGFP signal that correlated with a reduction in TMT size ( Fig. 1C ). This decline was observed only in the case of the stable EGFP variant, whereas the DsRed signal produced by all three variants showed a measurable decline ( Fig. 1C ). These results further emphasize the applicability of the stable wild-type EGFP as a sensitive reporter to monitor TMT size changes over time.
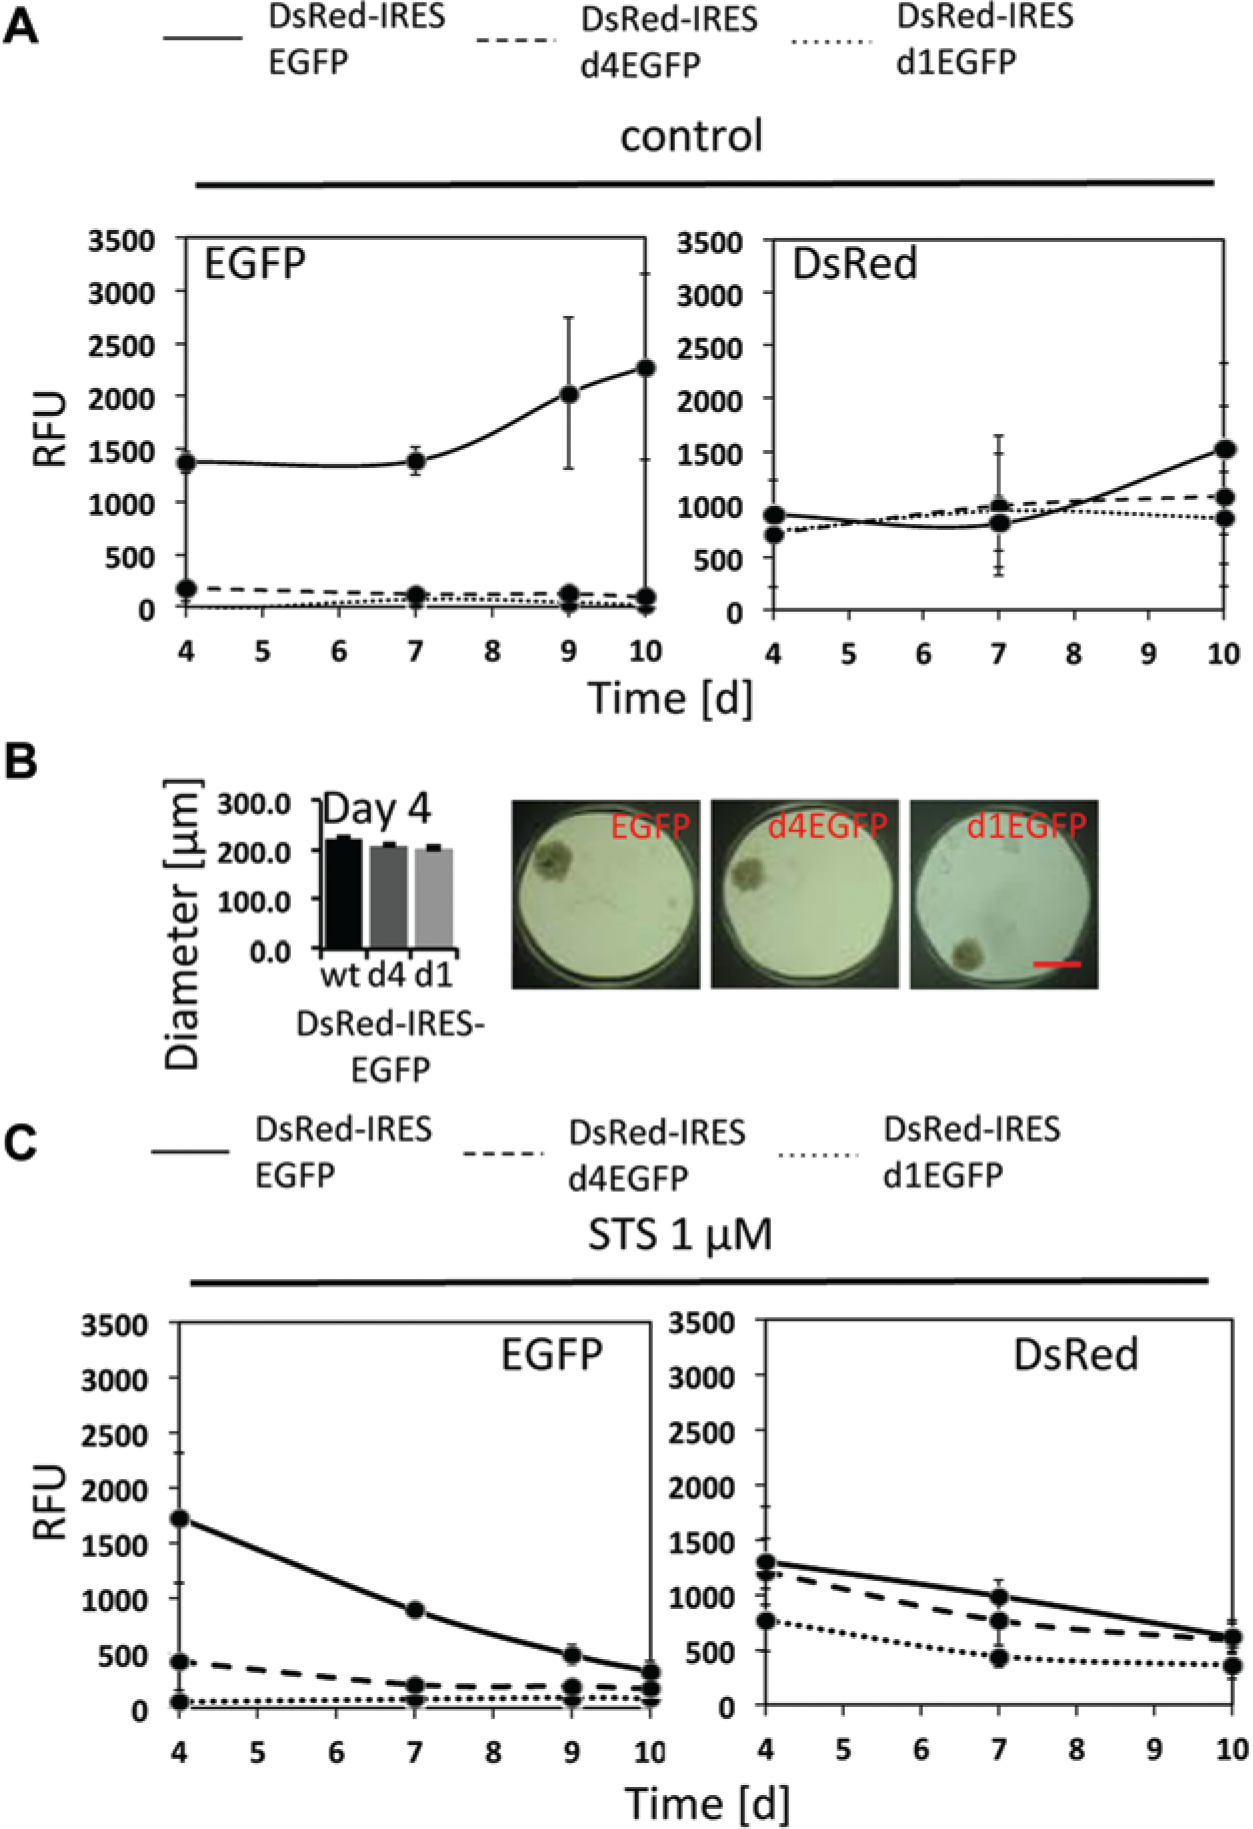
Evaluation of different enhanced green fluorescent protein (EGFP) stability variants as proxy for tumor microtissue (TMT) size. (
Prevailing evidence suggests that in vivo, cancer-associated fibroblasts interact with cancer cells to promote cancer growth and survival. 16 To mimic such interactions in vitro, DLD1-EGFP cells were grown together with mouse NIH3T3 or NIH3T3-RFP fibroblasts. For simplicity reasons, we have chosen for the development of this assay NIH3T3 fibroblasts as they have been successfully applied in co-culture experiments. 17 Parallel measurements of both RFP and EGFP signals were performed to monitor the expansion of each of these cell types in 3D co-culture TMTs and to define the optimal cancer cell to fibroblast ratios for co-culturing. As shown in Figure 2A , there was no increase in RFP signals detectable over 10 days of measurements, indicating that the fibroblasts did not proliferate as a microtissue either in co-culture or as a monoculture. A stable RFP signal over time indicated that these cells arrested and did not undergo cell death ( Fig. 2A ) as opposed to 2D mono- and co-cultures where NIH3T3 fibroblasts remained proliferative. In contrast, DLD1-EGFP cells proliferated as TMTs under both experimental conditions, as mono- and as co-culture, leading to elevated levels of EGFP fluorescence intensity over time ( Fig. 2A ). A representative image of a co-culture TMT composed of DLD1-EGFP and NIH3T3-RFP is given in Figure 2B . Since in co-cultures, the RFP signal did not measurably change over time, we mixed DLD1-EGFP cells with NIH3T3, which did not contain the RFP reporter at different ratios, and assessed the increase of EGFP signals in the co-culture TMTs ( Fig. 2C ). Optimal growth conditions were observed at a ratio of 1:2 between DLD1-EGFP and NIH3T3 cells ( Fig. 2C ). The presence of NIH3T3 fibroblasts in co-culture experiments does not contribute to a measurable extent to the EGFP signals when compared with medium control ( Fig. 2D ). Accordingly, all subsequent experiments were performed under these experimental conditions.
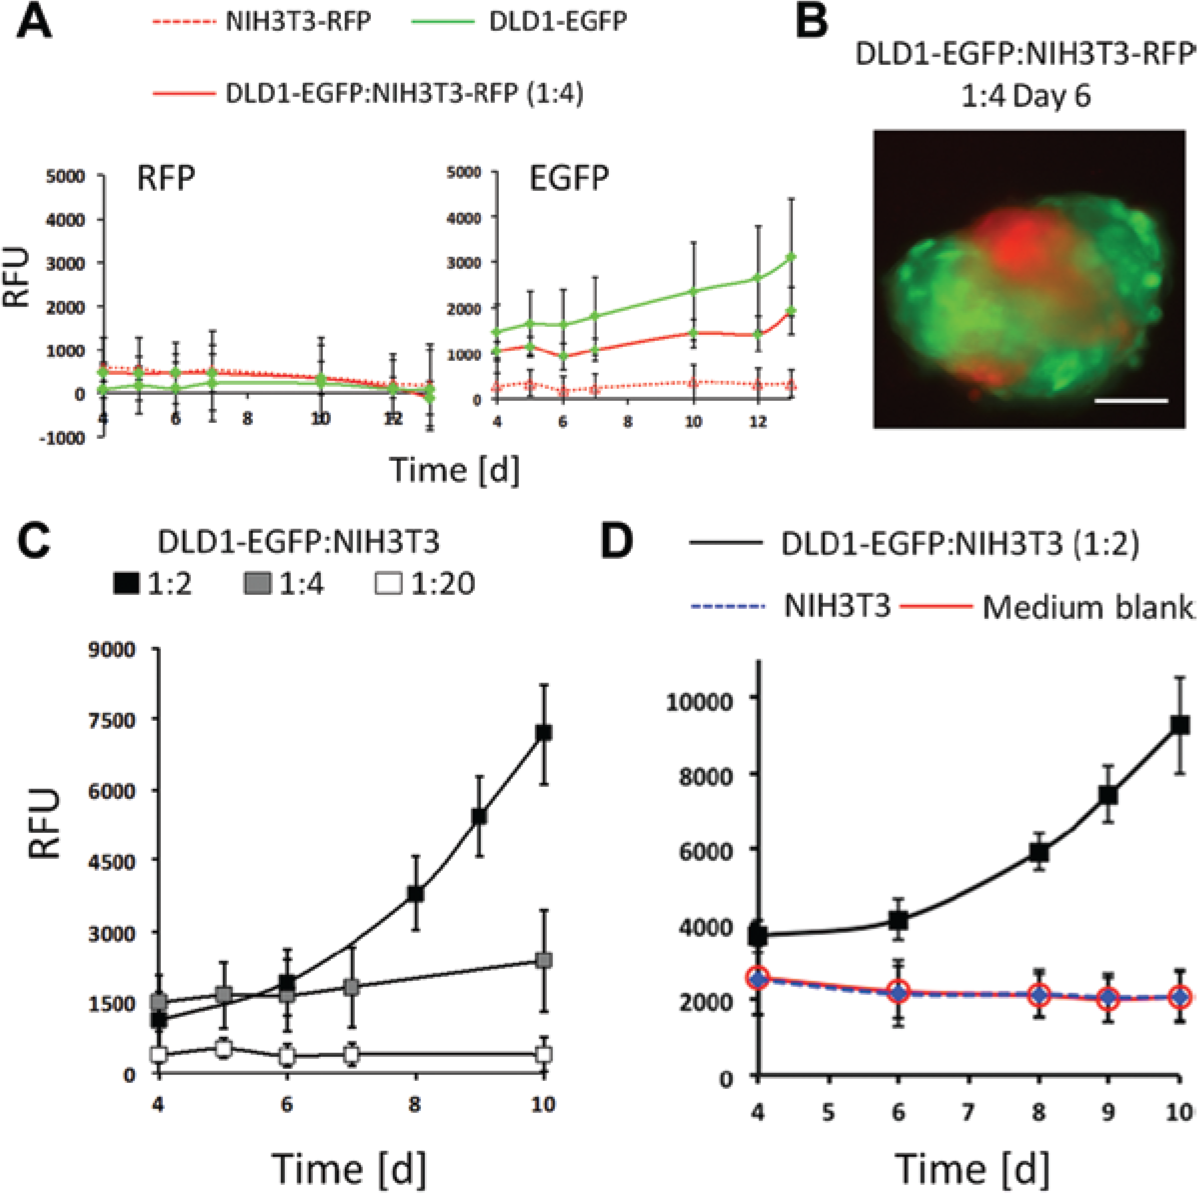
Characterization of co-culture tumor microtissues (TMTs). (
Having established the optimal conditions for growing and monitoring 3D co-culture TMTs, we further assessed the impact of siRNA transfection and monitored siRNA stability in TMTs over time. To this end, we employed siRNAs targeting EGFP (siEGFP). Transfection of DLD1-EGFP cells with siEGFP or control siRNA (sictrl) prior to co-culturing with fibroblasts in 3D TMTs revealed a reduction of EGFP signal by more than 75% on day 4 (
Fig. 3A
). The ratio between RFU between siEGFP- and sictrl-treated DLD1-EGFP cells raised continuously over time, implying a time-dependent dilution of the siRNA due to DLD1-EGFP cell proliferation, resulting in TMT growth (
Fig. 3A
). TMT growth monitoring by measurement of TMT diameter showed no differential effects on growth between siEGFP, sictrl or transfection reagent alone (ctrl) treated TMTs, as expected (
Fig. 3B
). Monitoring of the EGFP signal over the indicated time period revealed initially a low EGFP signal in siEGFP-treated cells, suggesting a high transfection efficiency (
Fig. 3C
). Importantly, this signal increased faster than the EGFP signal derived from both control cell lines (
Fig. 3C
). This rebound of the EGFP signal from siEGFP-treated cells demonstrated that the siRNA transfection did not affect TMT growth rates (see
Fig. 3B
) and that siEGFP was diluted over time due to cell proliferation (see
Fig. 3A
,
C
). Fluorescence imaging of the corresponding TMTs taken at day 6 shows that siEGFP- or sictrl-treated DLD1-EGFP cells form TMTs of similar size but differ in their EGFP signal intensity, in line with the fluorescence measurements (
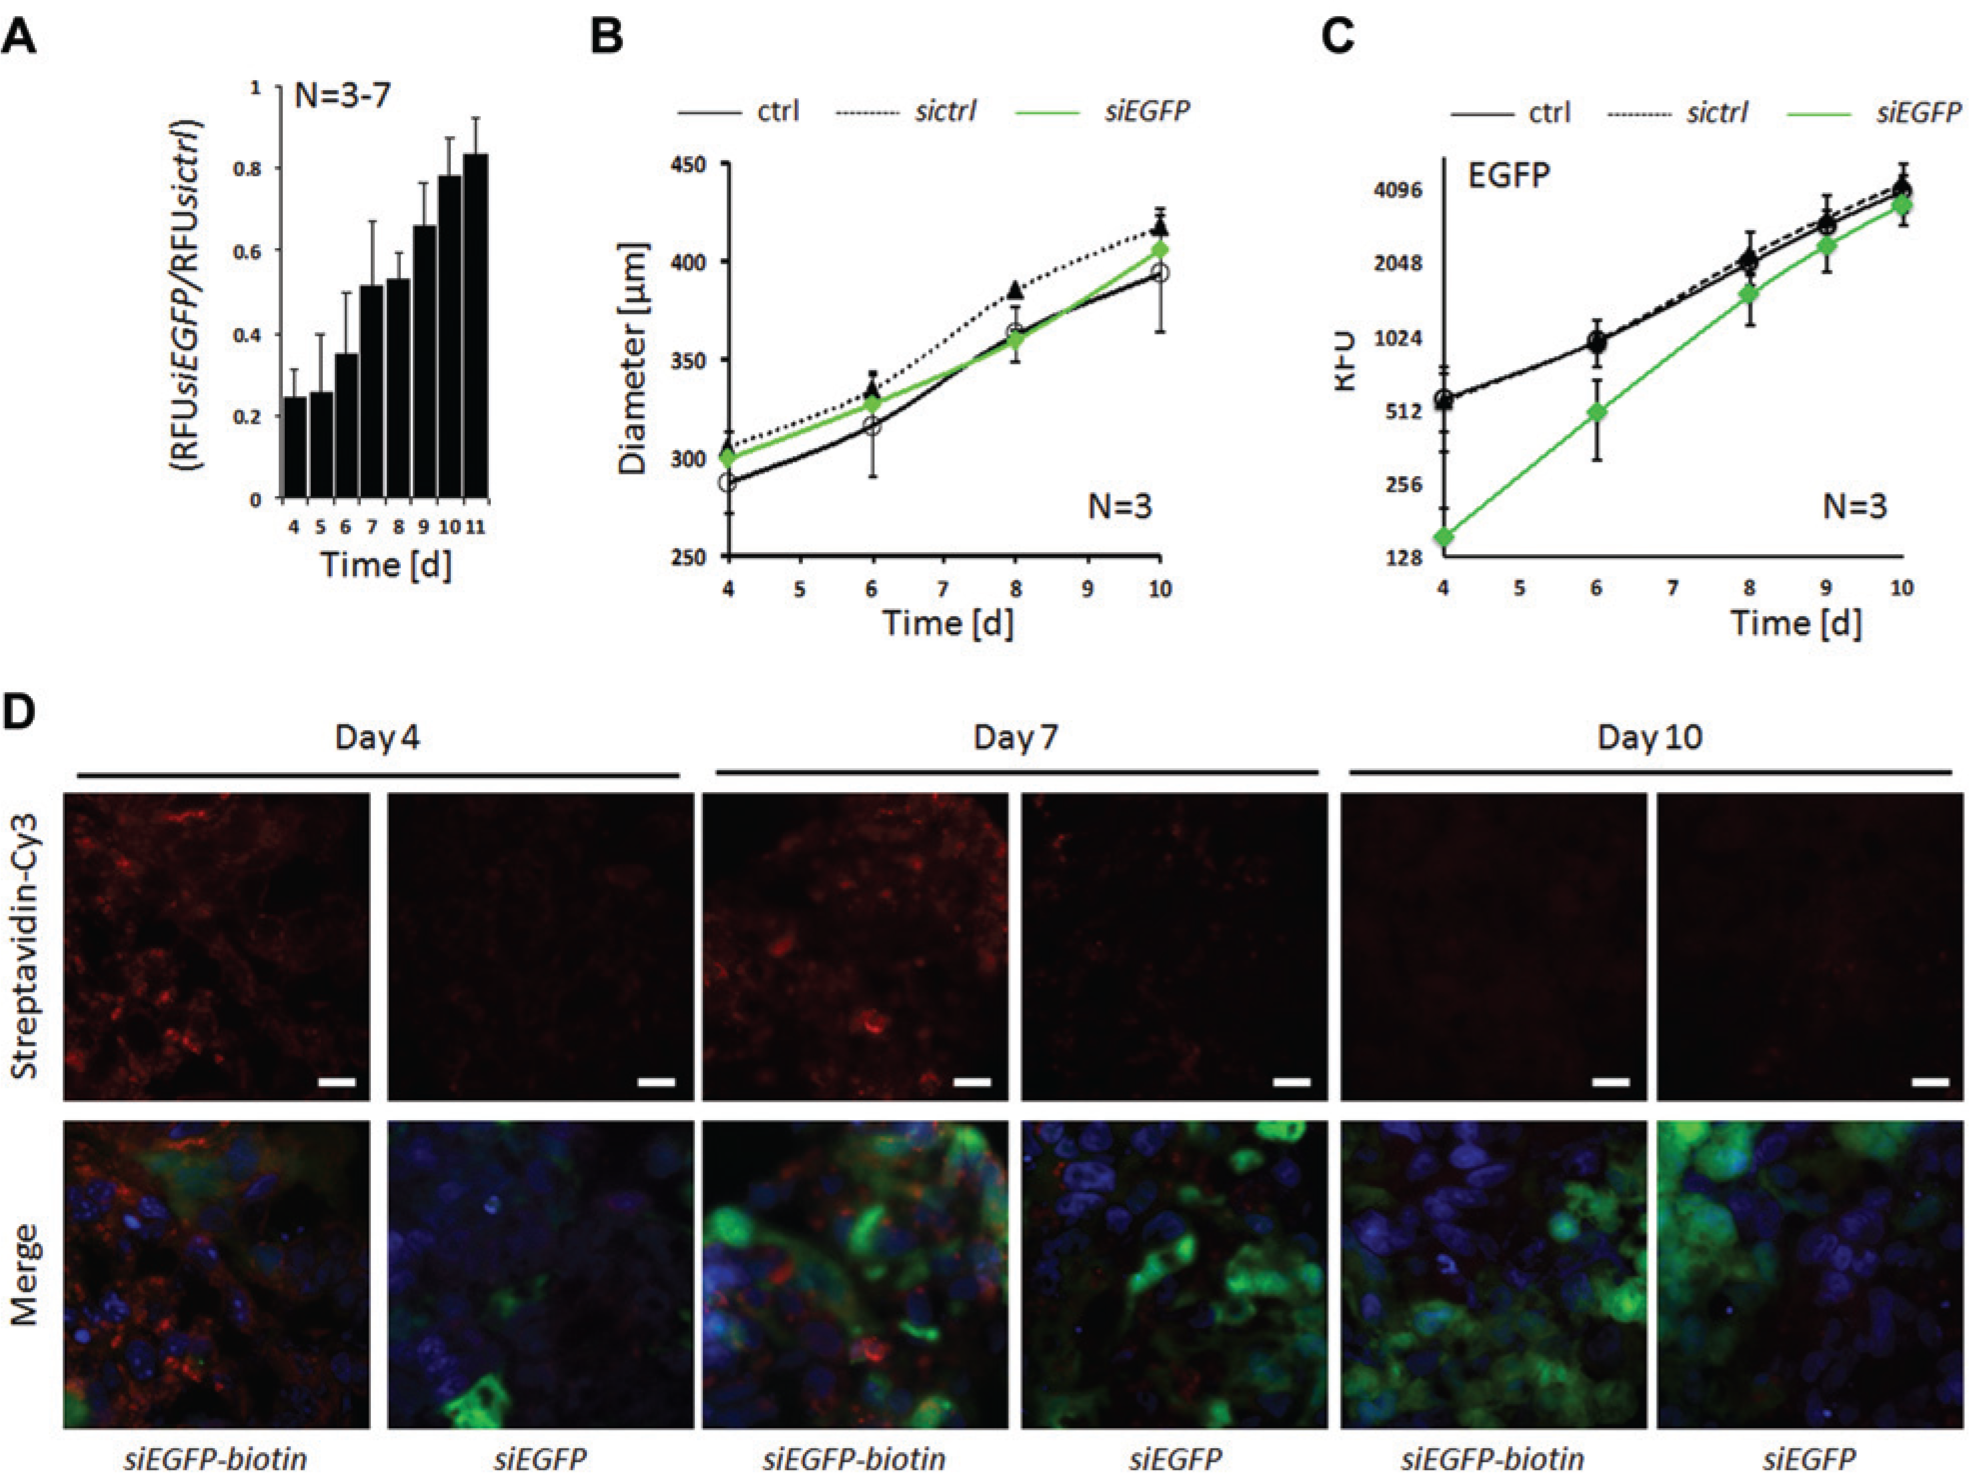
Characterization of siRNA knockdown efficiency and stability in co-culture tumor microtissues (TMTs). (
To evaluate the siRNA dilution effect directly, DLD1-EGFP cells were transfected with siEGFP or a biotinylated version of it (siEGFP-biotin); 3D co-culture TMTs were prepared and harvested on days 4, 7, and 10; and siEGFP-biotin was probed with streptavidin-Cy3 for immunofluorescence microscopy on cryosections. As illustrated in Figure 3D , the siEGFP-biotin signal was strongest on day 4 and progressively declined thereafter. The dark patches on the Cy3 channel images at various time points reflect NIH3T3 fibroblasts when no EGFP signal is visible on the merge. No streptavidin-Cy3 signal was detected in the siEGFP-treated control sections. Finally, the EGFP signal increased over time in both samples, which further confirms efficiency and dilution over time of both siEGFP species. Notably, when using siEGFP, we were able to monitor initial transfection efficiency as well as follow siRNA reduction over time in DLD1-EGFP cells. Therefore, gene depletions that block proliferation or induce cell death are most probably still observable at later time points since dilution effects do not account for siRNA reduction.
After successful establishment of the boundary assay conditions, functional siRNA knockdown was performed targeting the human mitotic kinesin Kif11 (also known as hsEg5), a promoter of bipolar spindle assembly during mitosis.
18
Depletion or inhibition of Kif11 leads to mitotic arrest and subsequently to apoptosis in several cell types.19,20 Reverse transfection of siKif11 resulted in about a 5-fold reduction of Kif11 messenger RNAs, as measured by quantitative reverse transcription PCR 48 h after transfection (
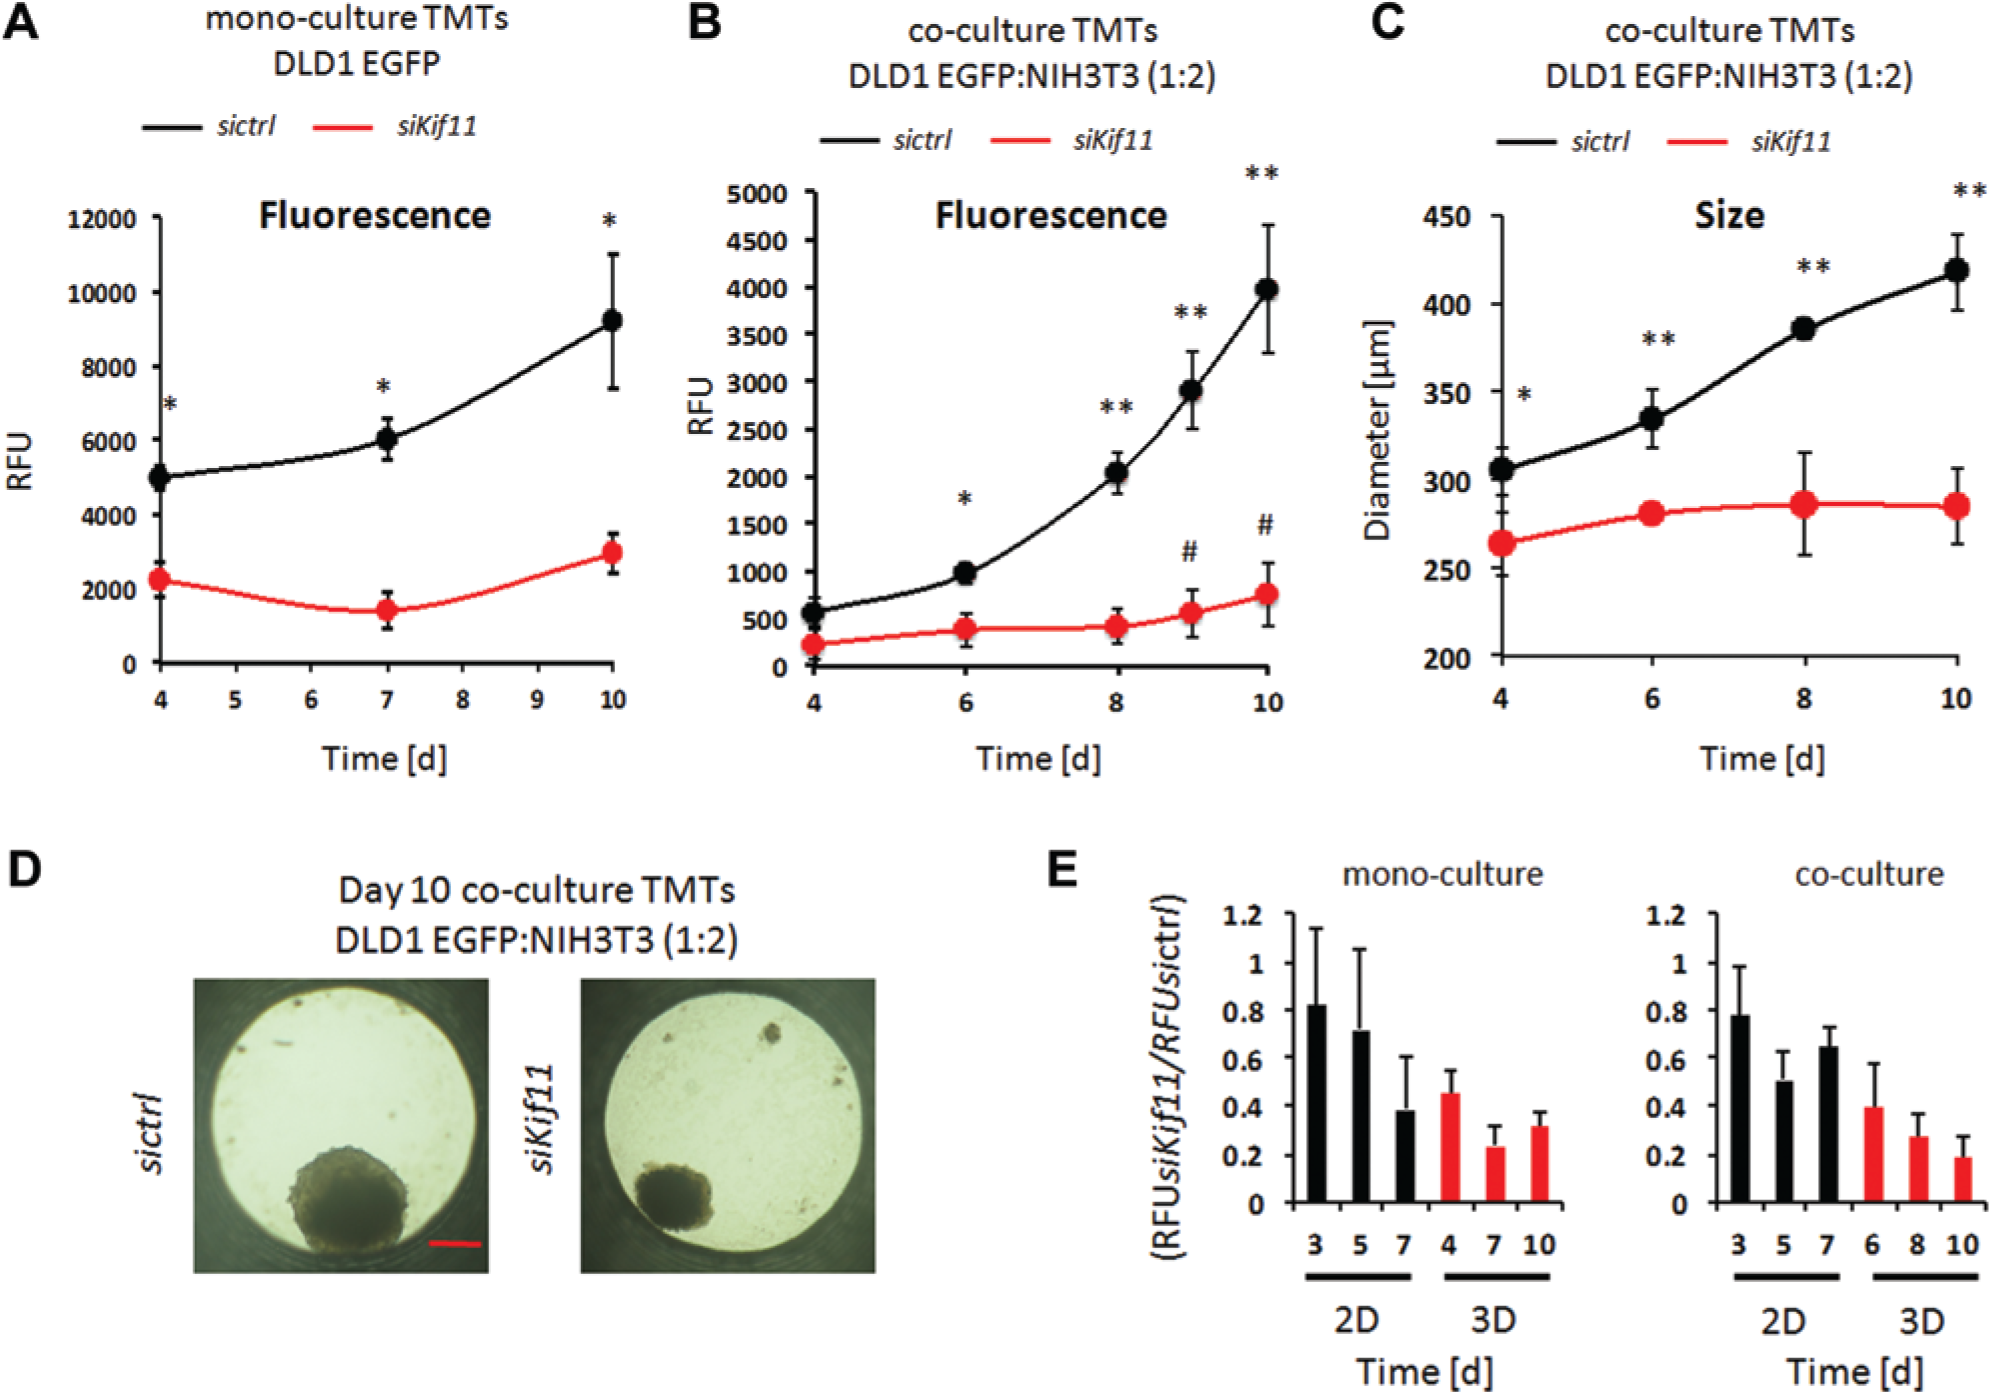
Comparison of Kif11 depletion in 2D versus 3D mono- and co-culture models. (
In summary, we have established a 3D microtissue model system in a 96-well format that enables the detection of phenotypic growth effects of siRNA-mediated gene depletions. Genetic depletion of the mitotic kinesin Kif11/Eg5 in DLD1 colon cancer cells provides a striking example of the phenotypic differences produced in 2D versus 3D tissue culture models. This finding extended also to fibroblasts that likewise displayed a different behavior in 2D and 3D co-cultures. Interestingly, mitotic kinesins are emerging as potential drug targets for cancer cells (reviewed in Rath and Kozielski 21 ), with Kif11 of particular interest, 22 and inhibitors have been developed and entered clinical trials. In this case, the 3D co-culture TMT model demonstrated its potential as a valid predictor for a potent target, at least in DLD1 colon cancer cells. Therefore, functional gene analysis using automation-compatible 3D cell culture models have a high potential to discover novel target genes or lead compounds for further drug development as well as for in vitro validation studies of potential hits from 2D high-throughput screening campaigns.
Footnotes
Acknowledgements
We thank all members of our laboratories for helpful discussions. The authors are grateful to Stephen J. Elledge for providing DsRed-IRES-EGFP constructs.
Declaration of Conflicting Interests
The authors declared no potential conflicts of interest with respect to the research, authorship, and/or publication of this article.
Funding
The authors disclosed receipt of the following financial support for the research, authorship, and/or publication of this article: This work was supported in part by a grant from the Swiss National Science Foundation to WK.
References
Supplementary Material
Please find the following supplemental material available below.
For Open Access articles published under a Creative Commons License, all supplemental material carries the same license as the article it is associated with.
For non-Open Access articles published, all supplemental material carries a non-exclusive license, and permission requests for re-use of supplemental material or any part of supplemental material shall be sent directly to the copyright owner as specified in the copyright notice associated with the article.