
Abstract
Despite key advances in cancer therapies, malignant tumors, such as melanoma, continue to be one of the leading causes of mortality. Recent debate on whether cancer can originate from a tumor-initiating subpopulation has permeated oncology and stem cell research. It has been well established that primary and immortalized tumor cells consist of heterogeneous cell populations. The profound effect of tumor heterogeneity on tumor growth and drug resistance remains elusive, but it is highly likely that subpopulations of cancer cells have different capabilities of self-renewal and drug resistance. Discrepancies between excellent in vitro potency and efficacy and poor patient response have been observed on multiple cancer therapeutics. Although this observation can be attributed to many factors, a better understanding of the contribution from subpopulations within a cancer will help bridge the gap between in vitro assay results and patient prognosis. To comprehend this impact, it is critical to isolate and characterize cancer subpopulations that possess higher growth and drug resistance properties so that novel therapeutics can be developed to eventually eradicate all cancer cells. In this article, we describe a method to enrich a subpopulation, CB4, from the melanoma cell line WM115. CB4 exhibited higher anchorage-independent growth, higher survival under serum starvation condition, and lower drug sensitivity to commonly used melanoma treatment compared with WM115. Details of functional properties and gene expression of CB4 compared with WM115 are reported. Our study demonstrates that it is feasible to isolate and enrich a subpopulation that exhibits higher growth capacity and treatment resistance from an immortalized tumor cell line.
Introduction
Diagnosis and prognosis of cancer have been drastically improved over the years. Even though innovative therapies become more and more readily available to patients, cancer relapse still occurs at a disappointing frequency. It is increasingly believed that the heterogeneity in cancer cells that arises from genetic diversity, epigenetic variance, and tumor micro-environments is a major factor in tumors’ evasion of common chemotherapy and causes tumor relapse. 1 Numerous efforts have been spent isolating cells responsible for the undesired outcome of cancer treatment so that novel antitumor drugs can be developed to eradicate these cells and improve cancer prognosis. 2
Malignant melanoma is well known for its tendency to develop drug resistance, become metastatic, and bear poor prognosis. 3 Multiple methods isolating cells that are responsible for melanoma relapse from primary melanoma and immortalized melanoma cell lines have been reported. Because it is hypothesized that cancer stem cells can be largely responsible for the poor prognosis, current methods rely primarily on using cancer stem cell markers either to isolate these subpopulations by fluorescence activated cell sorting (FACS)4,5 or to confirm their identity after a cancer stem cell population is established. 6 However, multiple groups have reported overlapping but different sets of melanoma cancer stem cell markers. Reliable markers for melanoma cancer stem cells continue to be an issue of debate. Thus, it is challenging to use FACS as a tool to consistently isolate these cells from different tissue sources.
In this study, we attempted multiple culture methods and successfully isolated and enriched an expandable subpopulation, CB4, from the WM115 melanoma cell line, which displays the following functional properties: 1) higher anchorage-independent growth, 2) higher survival under serum starvation condition, and 3) lower sensitivity to standard-of-care melanoma treatment in both two-dimensional (2D) and three-dimensional (3D) culture conditions. The long-term self-renewal properties of these cells remain to be determined in vivo with serial recipients. In this report, we describe the development and validation of the method used to successfully generate CB4. In vitro functional properties and gene expression of CB4 will be compared with WM115. In addition, the potential application of CB4 in drug discovery will be discussed.
Materials and Methods
Cell Lines and Culture Conditions
WM115 (BRAFV600D), a human metastatic melanoma cell line, was purchased from American Type Culture Collection (ATCC; Manassas, VA) and licensed from the Wistar Institute (Philadelphia, PA). WM115 was cultured in Eagles minimum essential media (ATCC) with 10% qualified fetal bovine serum (FBS; Life Technologies, Carlsbad, CA), 1% penicillin-streptomycin-glutamine (PSG; Life Technologies), and 1% sodium pyruvate (Life Technologies) as recommended by ATCC. The medium is designated as WT growth medium.
Isolation and Expansion of Subpopulation, CB4, from WM115
To isolate and enrich subpopulations that display distinct features from WM115, WM115 were cultured on a Matrigel (Corning, Corning, NY)–coated six-well tissue culture (TC) plate at a density of 0.5 million cells per well in mTeSR1 (STEMCELL Technologies, Vancouver, Canada) containing 1% PSG (CSC growth medium) with daily medium change for up to 3 months or until individual colonies were visible. These colonies were isolated and expanded in CSC growth media with Matrigel coating. Daily medium change was performed during cell culture. Cells were passaged when they reached 80% confluence. Selected clones were cryopreserved in PRIME-XV FreezIS (Irvine Scientific, Irvine, CA). Clone CB4 was chosen for detailed characterization in this study.
Genotyping and Karyotyping
WM115 and CB4 cells were grown in WT growth medium and in CSC growth medium with Matrigel coating to approximately 50% confluence, respectively. Karyotyping and genotyping of WM115 and CB4 were carried out at Cell Line Genetics (Madison, WI). Genotyping was determined by short tandem repeat profile assays using the Powerplex 16 (Promega, Madison, WI) kit according to the manufacturer’s recommendations. Karyotyping was determined by cytogenetic analysis using G-banding. Leishman staining was performed on the cells to identify homologous chromosomes and to detect numerical and structural chromosome aberrations. 7 All assays were run in duplicate and blinded to the interpreter for data interpretation.
Anchorage-Independent Cell Growth
WM115 and CB4 were harvested and seeded in an ultra-low-attachment (ULA) 384-well plate (Cat. No. 3810, Corning) in WT and CSC growth media, respectively. The cells were seeded at 1000, 500, 250, 125, 63, 31, 16, 8, 4, 2, 1, and 0.5 cells per well in 50 µL of media in alternating wells to avoid cross-talk when cell growth was measured by luminescence signal. Each cell density had 16 replicates in each run. WM115 was tested nine times, and CB4 was tested 13 times using cells from various passages. Cell plates were centrifuged at 230 relative centrifugal force (RCF), and cells were allowed to grow for 21 d in a 37°C TC incubator with 5% CO2 and 90% humidity. At day 21, the spheroids were imaged using BZ-9000 BioRevo (Keyence, Osaka, Japan). The degree of cell growth was determined using the CellTiter-Glo 3D viability assay (Cat. No. G9681, Promega) according to the instructions. Briefly, 25 µL of Cell Titer Glo 3D reagent was added to all wells. The bottom of the cell plate was covered with black adhesive tape to avoid cross-talk prior to measuring luminescence signal in Envision (PerkinElmer, Waltham, MA). Signals from medium-only wells were used as background to determine whether appreciable cell proliferation had occurred in neighboring wells in the following manner: signals from four medium-only wells surrounding a cell-populated well were averaged as the background, and their standard deviation was calculated. If the signal from a cell-populated well is higher than the average plus three standard deviations of its background wells, this cell-populated well is designated as positive on colony formation. Positive wells from each cell density of WM115 and CB4 were counted. A two-tailed paired t test was performed to determine the significance of difference between WM115 and CB4 at each cell density.
Monitoring the Effect of FBS on Cell Growth in 2D Culture by Cellular Imaging
For 2D cell culture, WM115 and CB4 were seeded in 96-well plates at 10,000 cells per well in either CSC growth medium with Matrigel coating or WT growth medium. When seeded in WT growth medium, cells were grown in medium containing 0%, 2.5%, 5%, 7.5%, or 10% FBS. Cell growth was monitored in an IncuCyte ZOOM (Essen Biosciences, Ann Arbor, MI). The CSC medium was replenished daily, and the WT growth medium was replenished every 5 to 7 d. To test the potential of reviving cells initially cultured in serum-free WT growth medium, WT growth medium containing 10% FBS was used to replace serum-free medium 4 wk after cell seeding.
Determination of Compound Effect in 2D and 3D Culture Using CellTiter-Glo
For compound effect on 2D cell culture, WM115 and CB4 were seeded in a 384-well plate (Cat. No. 3712, Corning) at 1250 cells per well in WT growth medium or CSC growth medium with Matrigel coating, respectively. Cell plates were centrifuged for 5 min at 230 RCF and allowed to attach overnight in a 37°C TC incubator. Melanoma standard of care (mSOC) compounds were purchased from Selleckchem (Houston, TX). Dacarbazine, 8 Dabrafenib, 9 Trametinib, 10 Vemurafenib,11,12, and a combination of Dabrafenib and Trametinib were serially diluted 1:2, 22 times in 100% DMSO starting from 10 mM in columns 1 to 22 in the assay plate. In columns 23 and 24, 100% DMSO was added as controls. The serially diluted compounds were further diluted 1:20 in intermediate plates in either WT or CSC growth medium. mSOC compounds were added onto their respective cell plates 24 hours post cell seeding at an additional 1:5 dilution. The final compound concentration on cells ranged from 4.8 pM to 100 µM, and the final DMSO concentration was 1%. Compound treated cell plates were incubated in a 37ºC TC incubator for seven days.
For compound effect on these cells in 3D culture, WM115 and CB4 were seeded in 384-well ULA plates at 10,000 cells per well in WT growth medium and CSC growth medium, respectively. The cell plates were centrifuged for 5 min at 230 RCF. Cells were allowed to form spheroids in a 37 °C TC incubator for 48 h before they were treated with compounds in the same manner as described previously in 2D cell culture.
After 7 d of compound treatment in both 2D and 3D cultures, cell density was determined using CellTiter-Glo (Cat. No. G7571, Promega). The bottom of the cell plate was covered with black adhesive tape to avoid cross-talk before the luminescence signal was measured in the Envision.
To calculate IC50 values, primary results were normalized against DMSO controls to calculate percentage of control. Percentage-of-control values from multiple tests of a given compound were plotted against compound concentration and fitted globally into a four-parameter logistic nonlinear regression model to calculate IC50 and 95% confidence range.
FACS and Flow Cytometry
For FACS and flow cytometry experiments, WM115 was grown to 80% confluence in WT media and dissociated using enzyme-free Cell Dissociation buffer (Cat. No. 13151014; Life Technologies). The cells were resuspended in WT growth medium and centrifuged at 230 RCF at room temperature. Cell pellets were resuspended at a concentration of 5 million cells per milliliter and incubated with mouse anti-human CD20 FITC and CD271 AF647 at 5 µL per 1 million cells on ice for 1 h. Both antibodies were purchased from BD Biosciences (San Jose, CA). The cells were washed and resuspended at a final concentration of 5 million cells per milliliter. The cells were sorted in an Aria FACS sorter (BD Biosciences). The CD271+/CD20+ population was collected, confirmed by flow cytometry immediately after sorting, and expanded several weeks for further characterization. Expanded CD271+/CD20+ cells were analyzed by flow cytometry on an LSR II flow cytometer (BD Biosciences) using the same method described above. We also sorted and analyzed cells using other markers, such as CD44, CD133, and ABCB5, using the same staining method but incorporating specific antibodies against these markers.
Gene Expression Analysis
WM115 and CB4 were cultured in WT growth medium and CSC growth medium with Matrigel coating, respectively, to ~80% confluent. Cells were harvested using TrypLE Express Enzyme (Cat. No. 12605010; Thermo Fisher Scientific, Waltham, MA), and cell pellets containing approximately 2 to 7 million cells per vial were flash-frozen in liquid nitrogen. Three independent cultures and harvests of each cell types were performed. RNA was isolated from cell pellets (~5 million cells/pellet) by Q2 Solutions (Morrisville, NC) using the RNeasy Kit (Qiagen, Venlo, the Netherlands). cDNA libraries were generated with oligo dT primers and hybridized to Affymetrix GeneChip Human Genome U133 Plus 2.0 arrays according to the manufacturer’s protocol. CEL files (GEOXXXX) were analyzed using the “affy” package from Bioconductor software in R. RMA normalization was performed, and the “limma” package was used to define differential expression.
Results
Selection and Expansion of CB4 Subpopulation from the WM115 Cell Line
We first attempted to isolate a distinct subpopulation from the WM115 cell line using commonly reported cancer stem cell markers, such as CD271
13
and CD20.
14
However, a distinct population of CD271+/CD20+ was not observed. In addition, after the CD271high/CD20high population was sorted by FACS, we were unable to maintain the high expression for both markers after a limited number of passages during cell culture (
One method employed polydimethylsiloxane (PDMS) as a surface to select cells with unique morphology from WM115 cells and demonstrated that the selected cells display higher anchorage-independent proliferation. 18 However, we were unable to reproduce consistently the population with unique morphology because of variations in the curing process of PDMS (data not shown).
We also tried to culture WM115 in 3D using either neural crest conditions 19 or Cancer Stem Premium medium (ProMab Biotechnologies, Richmond, CA). Although we were able to expand cells under both conditions, cells cultured under these conditions did not show appreciable difference in anchorage-independent growth or sensitivity to mSOC compared with WM115 (data not shown).
The cell culture methods described above were attempted in both normoxia (21% O2) and hypoxia (5% O2) conditions, but neither of them produced expandable cell populations that showed consistent differences in functional properties compared with WM115.
After these failed results, we seeded WM115 on a Matrigel-coated surface at 80% to 90% confluence and cultured the cells in mTeSR1 medium with daily medium change. Massive cell loss was observed at the beginning. After 2 mo, less than 1% of the entire population survived the selection and formed individual colonies. We isolated and cryopreserved seven colonies ( Fig. 1 ). All colonies propagated slowly with doubling time at or beyond 96 h. Our effort in this report focused on one of the clones that was expanded within 3 mo, clone CB4.
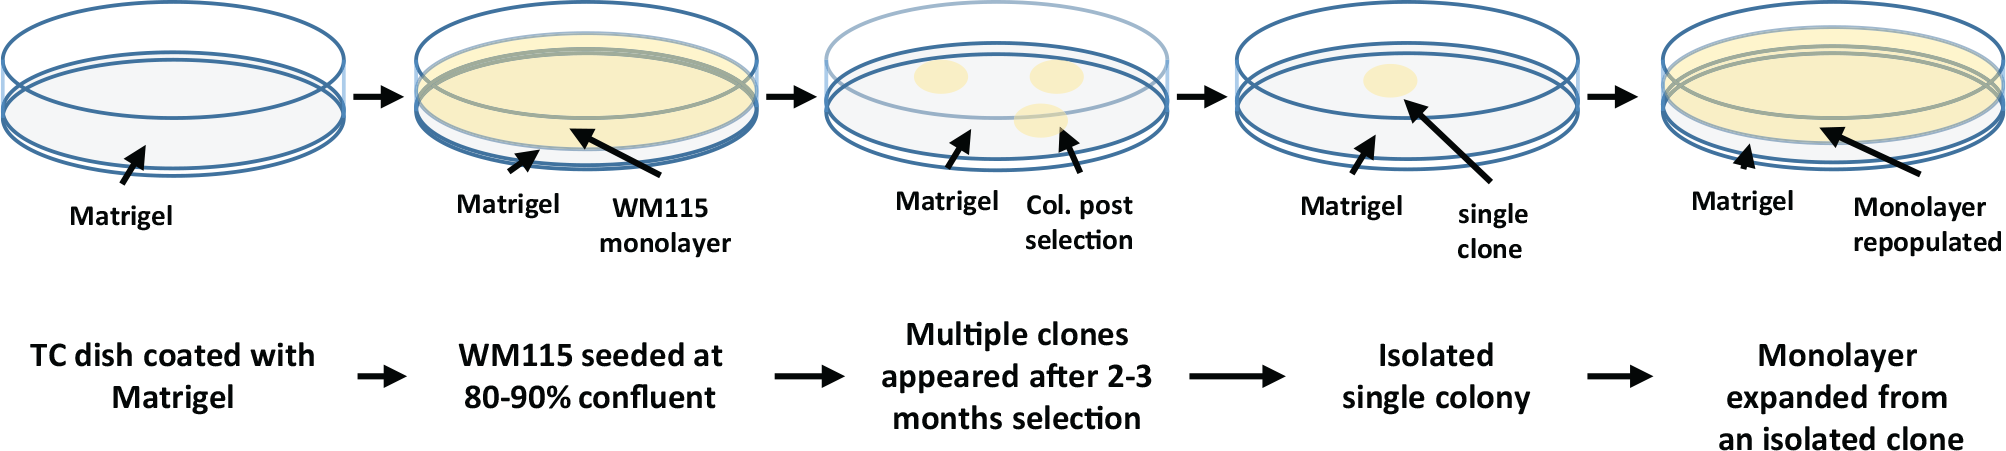
Scheme of CB4 selection and expansion using mTeSR1/Matrigel. Ten-centimeter tissue culture (TC) dishes were coated with Matrigel. WM115 was seeded at 80% to 90% confluence and grew in mTeSR1 medium with daily medium change. After 2 to 3 mo, most WM115 went through cell death, and only a few colonies formed in each 10-cm TC dish. Seven colonies, including CB4, were isolated, expanded, and cryopreserved.
Once established, CB4 and WM115 were genotyped to confirm CB4 was indeed derived from WM115 (
CB4 Displayed Higher Survival under Serum-Starved Conditions and Increased Anchorage-Independent Growth at Low Seeding Density Compared with WM115
We compared the growth properties of WM115 and CB4 in WT growth medium supplemented with FBS at a range of concentrations and CSC growth medium with Matrigel coating. Serum concentration from 2.5% to 10% did not play a significant role on the proliferation rate of either CB4 or WM115 (
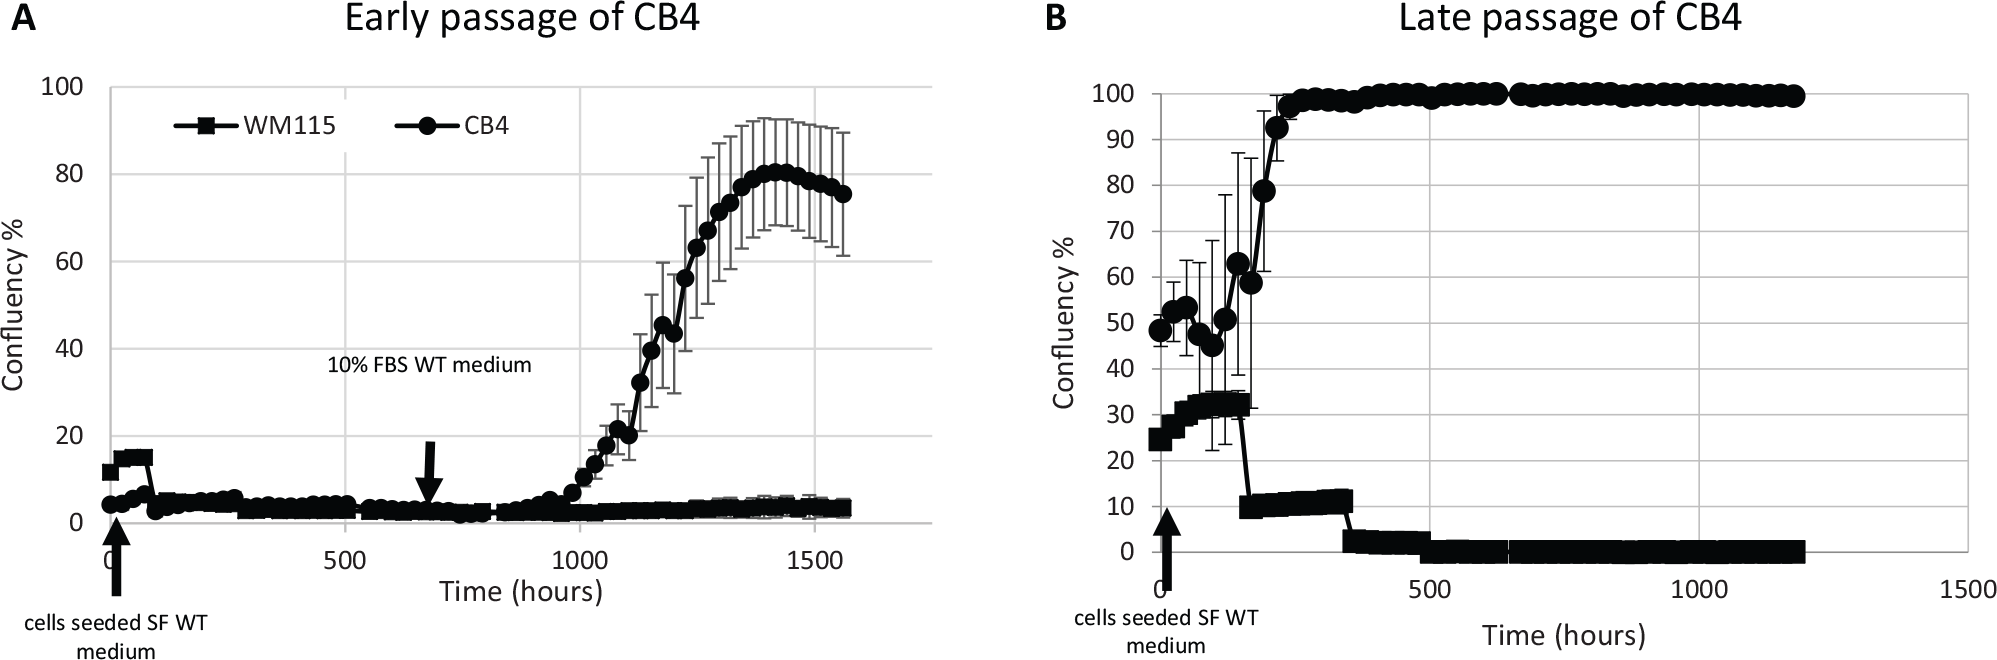
CB4 displayed higher survival under serum-free growth condition compared with WM115. WM115 and CB4 at early (p20–10) and late (>p70) passages were cultured in WT growth medium without fetal bovine serum (FBS) for 4 wk. Then, serum-free medium was replenished with WT growth medium containing 10% FBS. (
Anchorage-independent cell growth has been used as an in vitro surrogate readout to measure the self-renewing capacity of cancer stem cells.
20
However, commonly used methods requiring cell seeding at low density (1–2 cells per well) in suspension or semisoft growth medium are laborious, highly variable, and not well suited for drug discovery. Therefore, we used the CellTiter-Glo luciferase assay to determine the occurrence of colonies when CB4 and WM115 cells were seeded in a series of cell densities in ULA plates in their respective growth medium, as described in the Materials and Methods section. The results of the clonogenic assay demonstrated that at high cell-seeding densities, both parental and CB4 formed 3D spheroid. However, at 16, 8, 4, and 2 cells per well, CB4 showed a significantly higher tendency to form spheroids, with a p value <0.01 at 16 cells per well, <0.0001 at 8 and 4 cells per well, and <0.05 at 2 cells per well (
Fig. 3
). At 1 cell per well, CB4 showed a higher tendency to form spheroid than WM115, although the difference is not statistically different, with a p value of 0.058. Similar results were observed for cell density at 0.5 cells per well, with an even higher p value of 0.42. We believe the lack of significance observed at the two lowest cell-seeding densities is a result of increased variability as seeding density decreased. This degree of variability requires a larger sample size to reveal significance. CB4 generated smaller but more compact spheroids with clear borders at seeding densities below 16 cells per well when visualized under 10 phase contrast using BZ-9000 BioRevo (
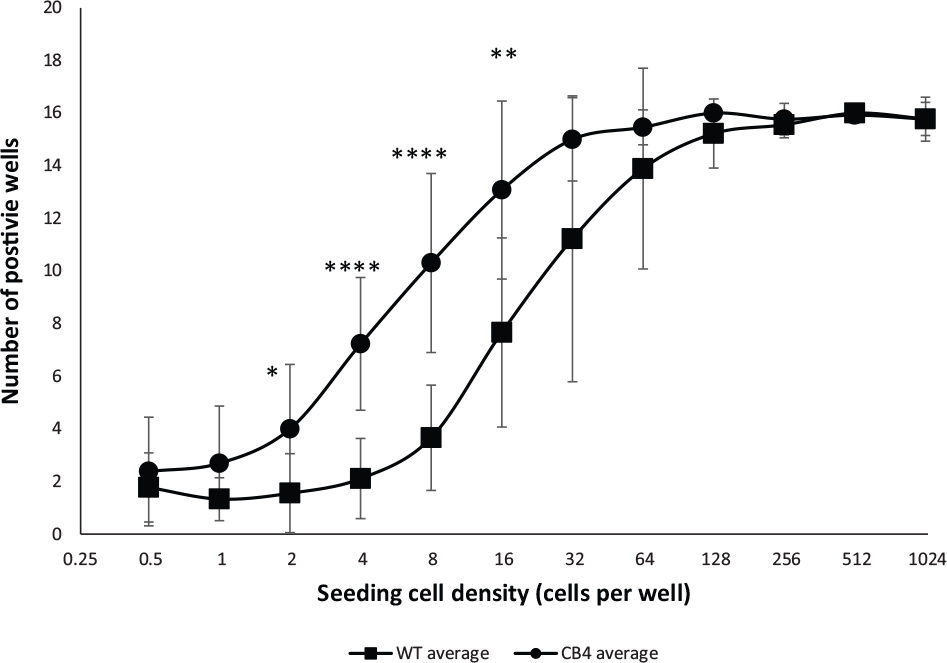
CB4 displayed higher anchorage-independent growth at low cell-seeding density compared with WM115. Anchorage-independent growth of WM115 and CB4 were determined as described in the Materials and Methods section. Each cell-seeding density had 16 replicates in each run. The colony formation activity of CB4 was determined in 16 independent experiments. Colony formation of WM115 was determined in nine experiments. Error bars represent the standard deviations of 16 and 9 experiments for CB4 and WM115, respectively. *p < 0.05; **p < 0.01; ****p < 0.0001.
CB4 Cultured in 2D and 3D Conditions Exhibited Lower Sensitivity to Melanoma Standard-of-Care Compounds
Although recent development in cancer drug discovery has resulted in several novel kinase inhibitors with improved efficacy and specificity compared with the nonspecific treatment, Dacarbazine, melanoma still causes a high fatality rate because of development of resistance to chemotherapy.21,22 The growth of melanoma cells that developed drug resistance to a single treatment can be inhibited by a combination of treatments interfering with different pathways. 23 Thus, we decided to determine the drug sensitivity of CB4 and WM115 to commonly used melanoma standard-of-care small molecules, Dacarbazine, Trametinib, Vemurafenib, Dabrafenib, and the combination of Trametinib and Dabrafenib, under both 2D and 3D culture conditions over a 7-d period. The potencies of all five treatments on WM115 under 2D culture conditions are within similar range to previously reported values on other BRAFV600 cell lines.23–25 The IC50 results showed no significant differences between 2D and 3D cultures for Vemurafenib, Dabrafenib, Trametinib, and the combination of Dabrafenib and Trametinib ( Fig. 4A , B ; Table 1 ). About fourfold weaker potency was observed for Dacarbazine under the 3D condition compared with the 2D condition ( Table 1 ).
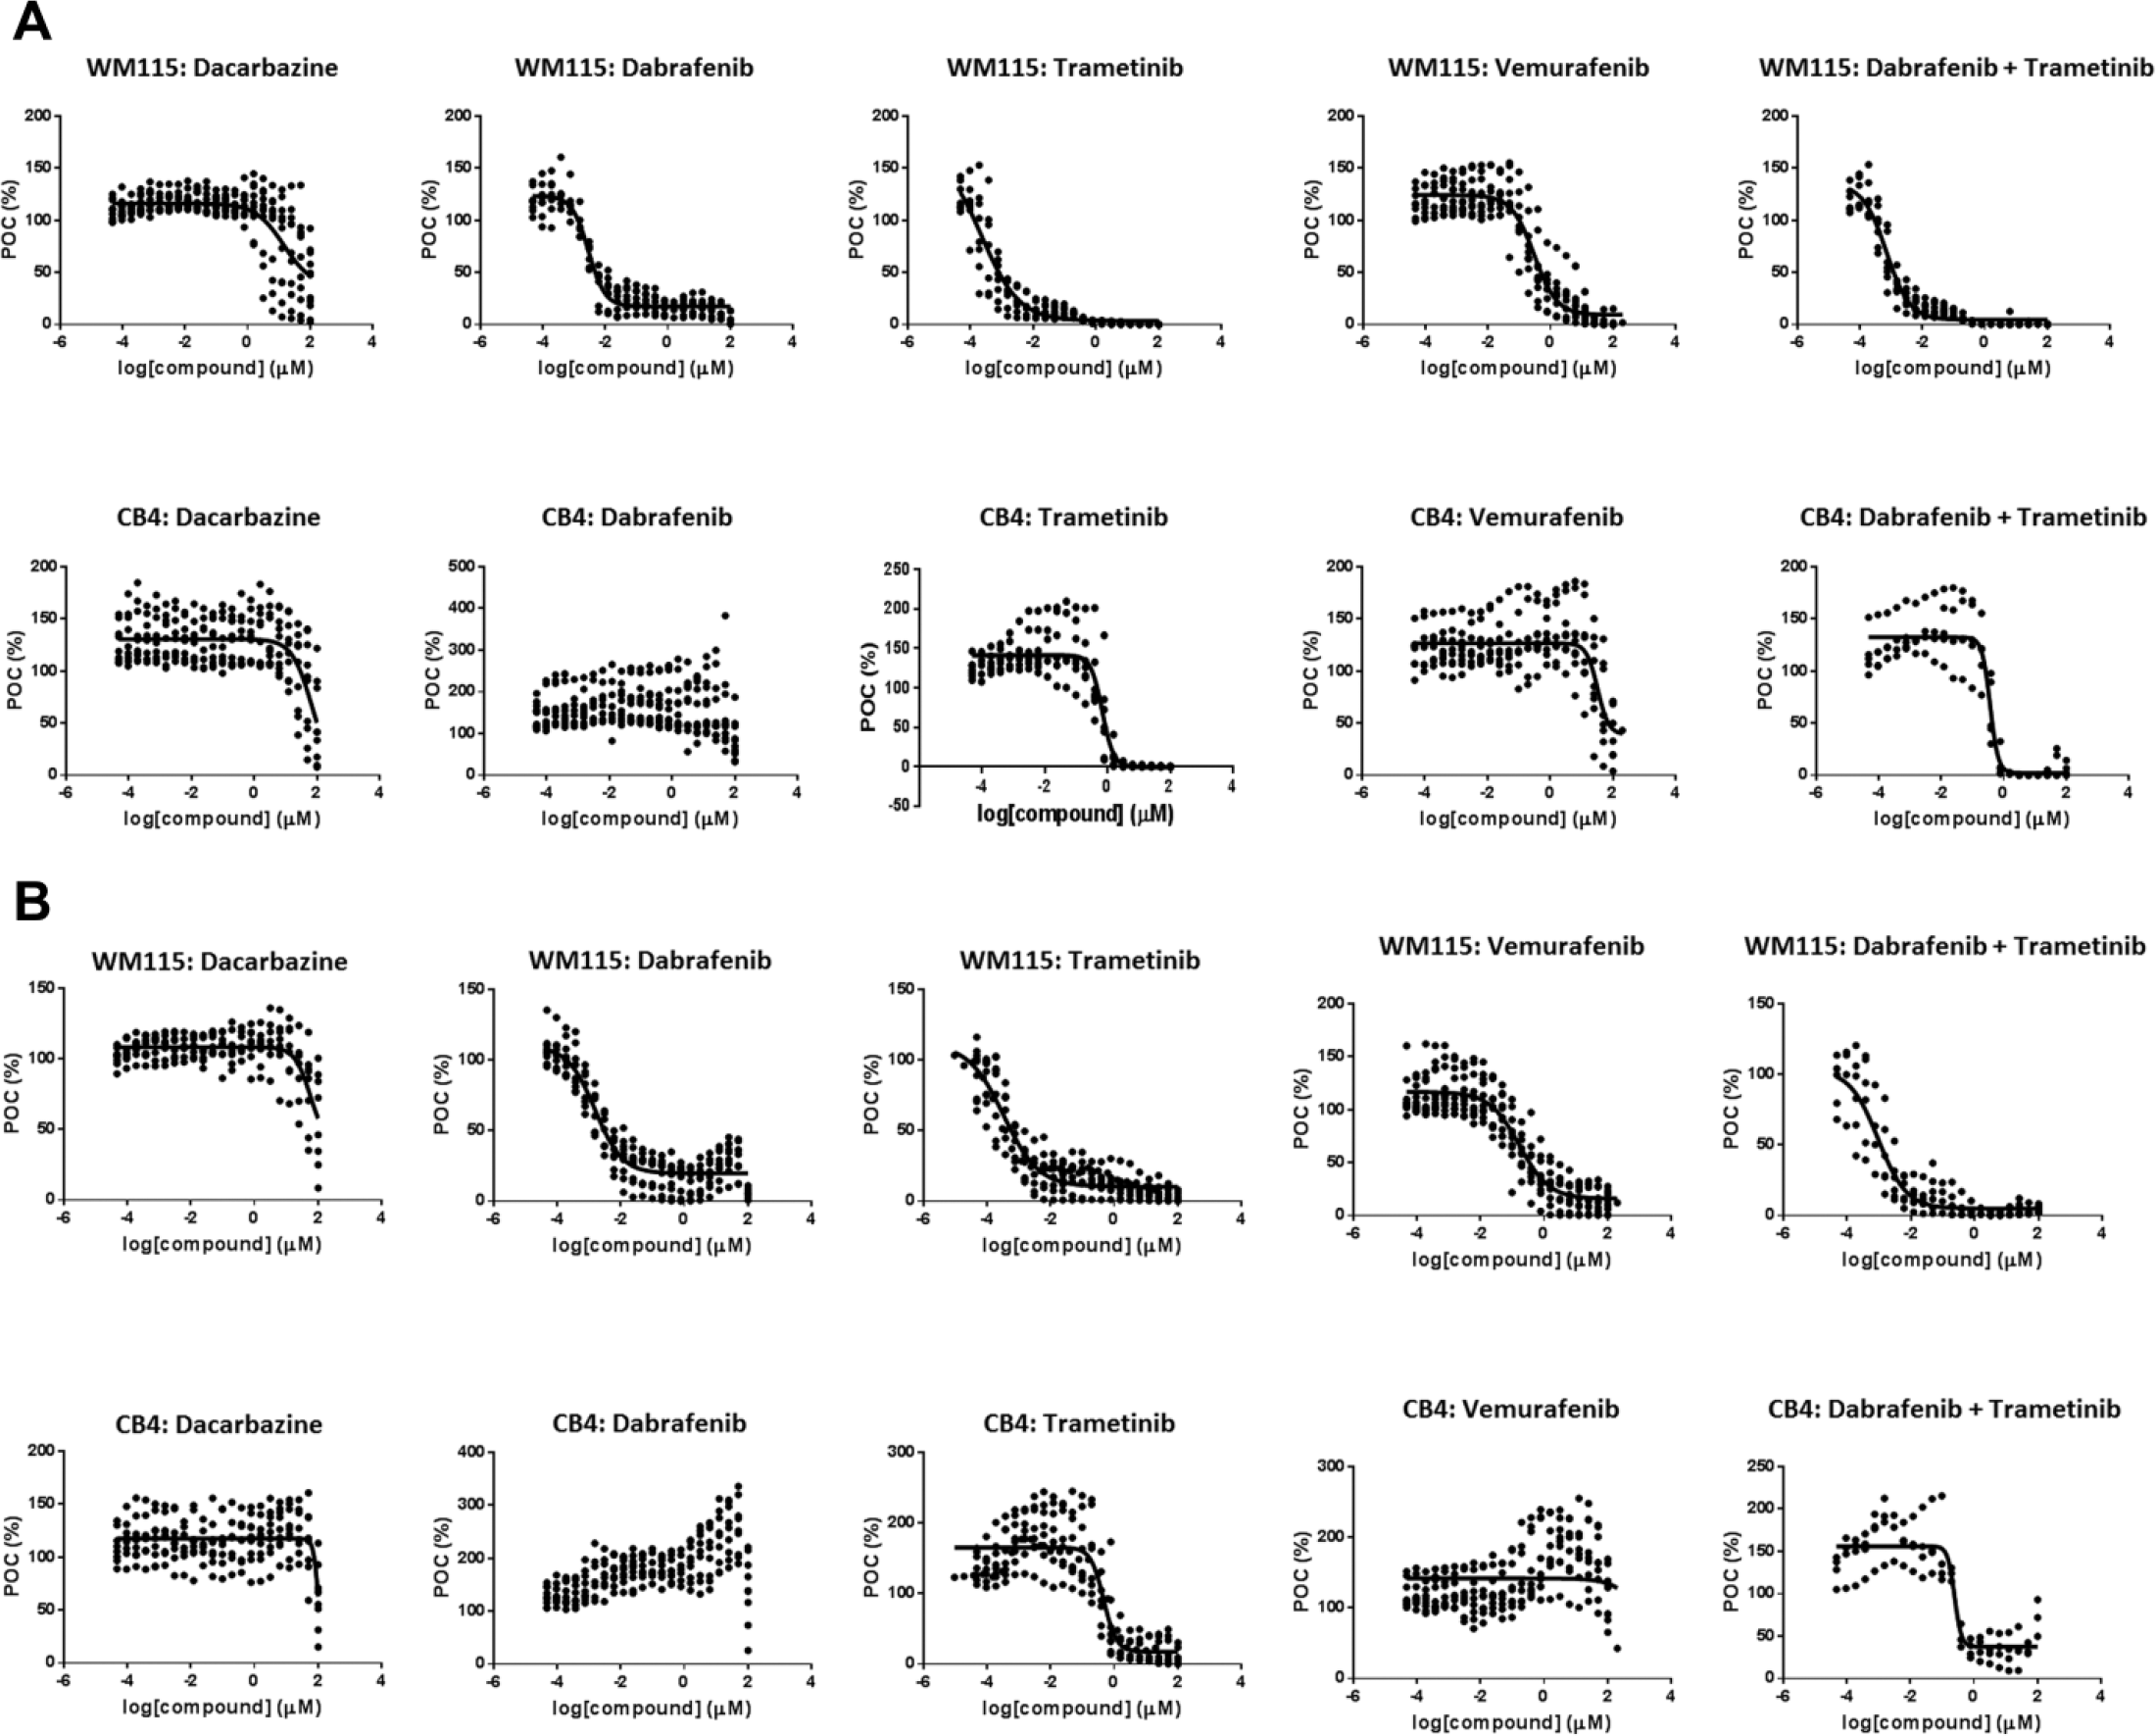
Clone CB4 displayed a significantly lower sensitivity to standard-of-care drugs for melanoma compared with parental WM115 in both two-dimensional (2D) and three-dimensional (3D) culture. Compound effect on WM115 and CB4 was determined on cells cultured in 2D (
Summary of Potency of Melanoma Standard-of-Care Compounds on WM115 and CB4 Cultured under 2D and 3D Conditions.
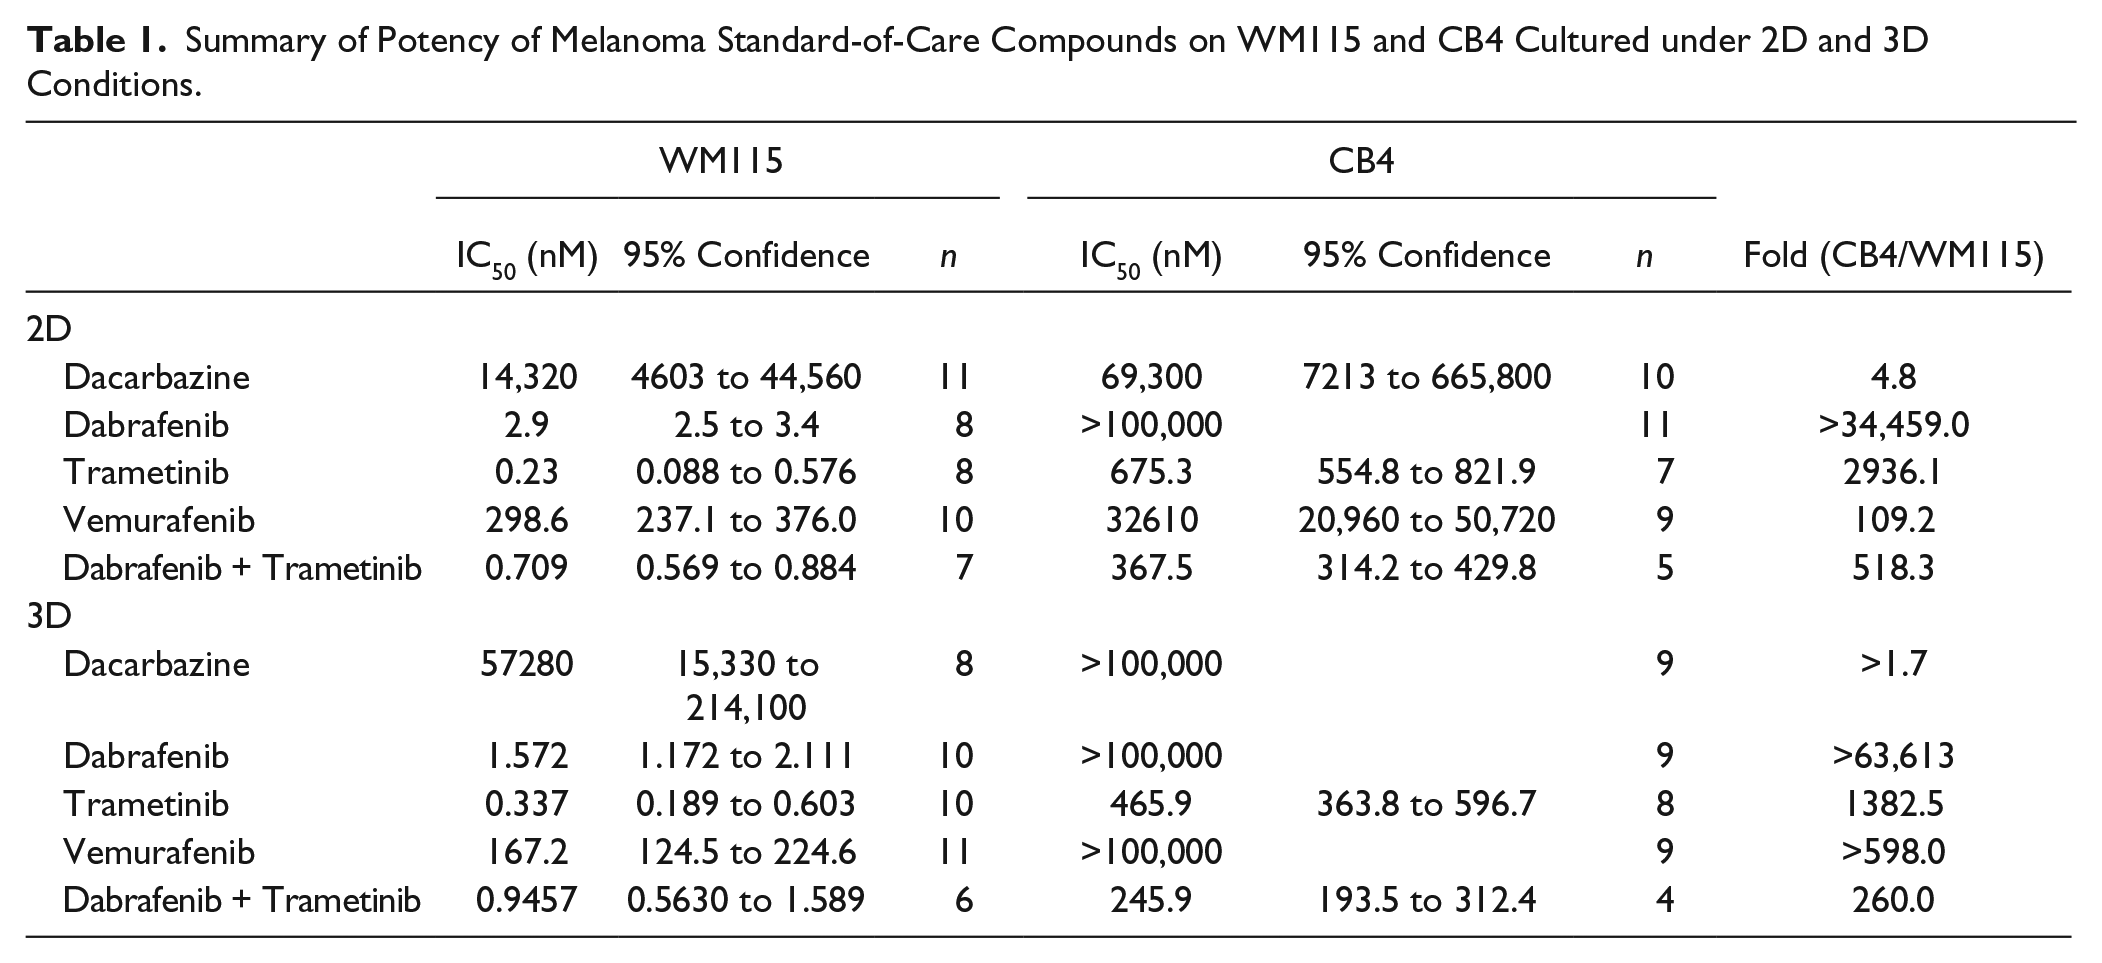
Dacarbazine methylates guanine and exerts a higher degree of disruption in DNA synthesis in fast-dividing cancer cells than in normal cells. 8 CB4 was less sensitive than WM115 to Dacarbazine, with moderate potency shifts under both 2D (4.8-fold) and 3D (>1.7-fold) culture conditions. These rather moderately reduced sensitivities of CB4 to Dacarbazine were likely due to the low potency of Dacarbazine and the limit of achievable compound concentration in this assay ( Fig. 4A , B ; Table 1 ).
Vemurafenib and Dabrafenib are BRAF inhibitors, known to increase survival in patients with malignant melanoma carrying the V600E mutation in BRAF.9,12 CB4 showed at least 100-fold less sensitivity to Vemurafenib and Dabrafenib under both 2D and 3D growth conditions compared with WM115 ( Table 1 ). In fact, Dabrafenib had very little effect even at the highest compound concentration on CB4 whereas it inhibited growth of WM115 with an IC50 of 2.9 nM and 1.6 nM under 2D and 3D culture conditions, respectively. Therefore, Dabrafenib is >34,000-fold and >64,000-fold weaker on CB4 than on WM115 under 2D and 3D conditions. Similar changes were observed for Vemurafenib. Vemurafenib is weaker on CB4 by ~110-fold in the 2D condition and >~600-fold in the 3D condition.
Trametinib, an MEK1/2 inhibitor, has also been demonstrated to improve overall survival rates 10 in melanoma patients carrying BRAF V600 mutations. The IC50 of Trametinib was 675 nM on CB4 in 2D culture, almost 3000-fold higher than its IC50 on WM115 at 0.23 nM. Under the 3D culture condition, the IC50 of Trametinib was 466 nM, more than 1300-fold weaker than that on WM115 cells at 0.34 nM.
More interestingly, CB4 showed higher resistance even to the combination of Dabrafenib and Trametinib at a 1:1 ratio, in both 2D and 3D growth conditions. Under the 2D condition, the IC50 of the combined treatment shifted more than 500-fold from 0.71 nM on WM115 to 368 nM on CB4. Under the 3D condition, the IC50 shifted 260-fold from 0.95 nM on WM115 to 246 nM on CB4. These results suggest CB4 is likely to represent a subpopulation of cells within WM115 that can escape chemotherapy, reestablish the tumor burden, and therefore be responsible for tumor relapse.
CB4 and Parental WM115 Displayed Different Gene Expression Profiles
The results of the microarray analysis confirmed that CB4 and WM115 cells exhibited different gene expression profiles, as three cell samples from each cell type clustered together (
Fig. 5
). Ninety-eight genes (43 up-regulators and 55-down regulators) that encode transcription factors, ion channels, G-protein–coupled receptors, cytokine receptors, cytoskeleton proteins, extracellular matrix proteins, tight conjunction proteins, and so on showed 100-fold or higher difference in their expression in CB4 and WM115 (examples listed in
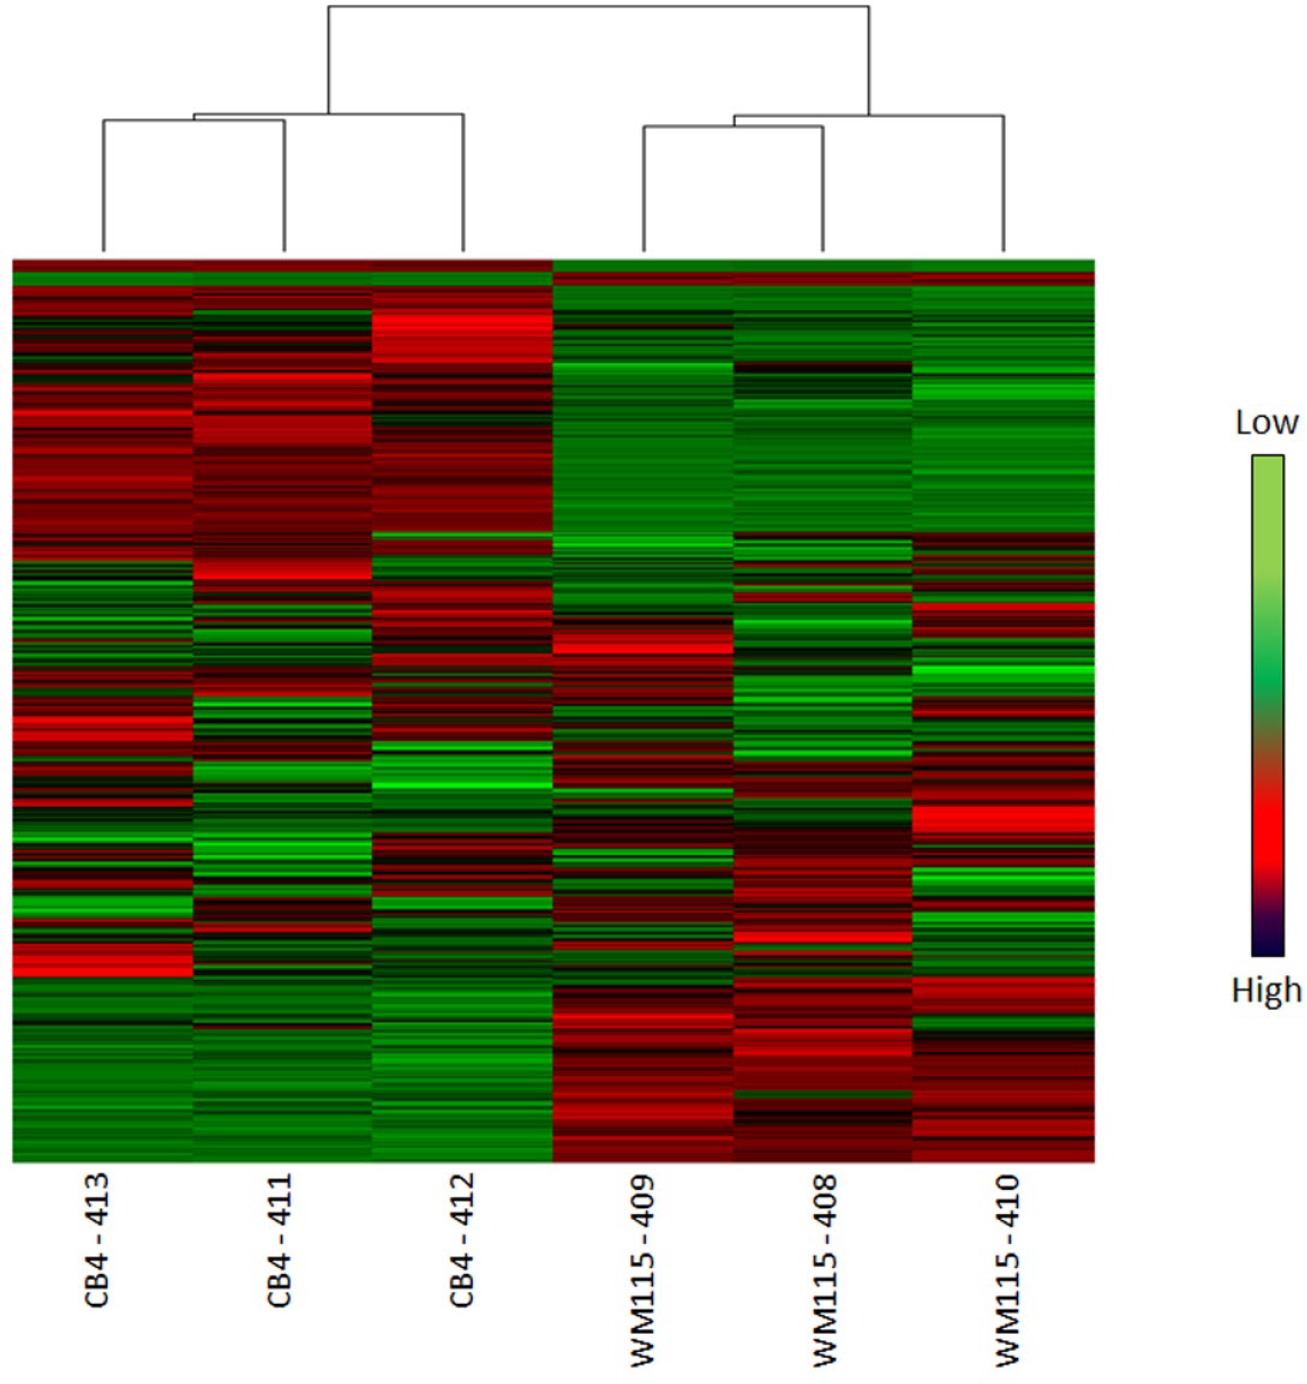
Global hierarchical clustering of gene expression of WM115 and CB4. Gene expression analysis of WM115 and CB4 was profiled using Affymetrix arrays. Unsupervised hierarchical clustering was performed on both probe sets and the six samples (three from each cell line). Each row of the heat map demonstrates gene expression compared with the median for each probe set. The 5000 probe sets with the highest variance are plotted here, with red denoting high expression and green showing low expression. The dendrogram shows sample clustering according to cell types.
Discussion
We have successfully employed a method that is commonly used in maintaining pluripotency of human induced pluripotent cells (iPSCs) to isolate an expandable subpopulation from the melanoma cell line WM115. This subpopulation of cells displayed higher survival under the serum-free condition, higher anchorage-independent growth, lower drug sensitivity, and different gene expression profile compared with the parental cells, WM115.
The distinct features of CB4 resembled the commonly described in vitro properties of cancer stem cells. 1 In many cases, cancer stem cells have been reported to be able to self-renew and display dormancy during chemotherapy and ultimately evade chemotherapy.31,32 Therefore, it is hypothesized that cancer stem cells are likely responsible for tumor drug resistance and tumor relapse. The key feature of cancer stem cells is long-term self-renewal, which can be demonstrated by the maintenance of long-term clonal growth in functional repopulation assays. In some assays, putative cancer stem cells are transplanted into serial recipients. Alternatively, the lineage of cancer stem cells is monitored by in situ tracking. In the meantime, in vitro anchorage-independent proliferation has been used as a surrogate assay to determine the “stem-ness” of cancer stem cells before their in vivo properties are assessed. 20 Although the tumorigenicity of CB4 will have to be determined in in vivo animal tumor models, we strongly believe these cells can be used in in vitro drug screening and search for compounds that can effectively inhibit cells that are “hard to kill” using existing treatments that target fast-dividing cells.
We attempted several different methods (
Because CB4 was established under the serum-free Matrigel/mTeSR1 condition, it is reasonable to ask whether WT growth medium without serum can also be used to establish a cell population like CB4. CB4 showed different proliferation properties at early passages (20–30 after establishment) versus late passages (>70 after establishment) in serum-free WT growth medium. At early passages, the cells attached but became dormant when seeded in serum-free WT growth medium. They started proliferating when the serum-free medium was replaced by growth medium containing 10% serum. At later passages, CB4 propagated well in WT growth medium without serum. WT growth medium without serum could have served the purpose of eliminating cells that cannot survive the serum-free condition but would have been difficult to serve the purpose of expanding the surviving population, especially during the early passages. These observations indicated that Matrigel/mTeSR1 is a better choice to select and expand CB4.
During this study, we needed to develop an automation-friendly method to determine anchorage-independent growth of the cells. Our method employed seeding cells in a series of densities in 384-well ULA plates and measuring cells growth using homogeneous luminescence detection. This method allowed a wide range of cell-seeding density tested in one assay plate and reduced seeding variation, except at the lowest seeding density. It also enables facile scale up to test different cell lines using automated cell dispensing.
We tested WM115 and CB4 in both 2D and 3D culture conditions in the presence of mSOC compounds to determine whether there were any differences in the responses across the growth paradigms. Although we did not observe significant difference in compound potency when comparing 2D versus 3D culture within a cell type, greater than 100-fold lower potency was observed on CB4 than WM115 in both 2D and 3D conditions for all test compounds, except Dacarbazine, whose IC50 is close to the highest compound concentration at 100 µM.
We hope the application of this method can be demonstrated on other melanoma cell lines and primary melanoma cells as well as other cancer types to isolate cells with similar features to CB4 in future studies. Furthermore, if proven to bear higher tumorigenicity in vivo, cells with a similar nature to CB4 can be used as tools to determine compound potency in in vitro assays and screen for compounds that can limit growth of these highly aggressive tumor cells. Efforts along this direction can pave the road for development of treatment that can potentially improve the prognosis of melanoma and other cancer patients.
Footnotes
Acknowledgements
We would like to thank Michele E. McElvain and Dr. Vidya Prabhu for assistance on cell culture.
Supplementary material is available online with this article.
Declaration of Conflicting Interests
The authors declared the following potential conflicts of interest with respect to the research, authorship, and/or publication of this article: All authors are employees of Amgen Inc.
Funding
The authors received no financial support for the research, authorship, and/or publication of this article.
References
Supplementary Material
Please find the following supplemental material available below.
For Open Access articles published under a Creative Commons License, all supplemental material carries the same license as the article it is associated with.
For non-Open Access articles published, all supplemental material carries a non-exclusive license, and permission requests for re-use of supplemental material or any part of supplemental material shall be sent directly to the copyright owner as specified in the copyright notice associated with the article.