
Abstract
A screening procedure was developed that takes advantage of the cellular normalization by micropatterning and a novel quantitative organelle mapping approach that allows unbiased and automated cell morphology comparison using black-box statistical testing. Micropatterns of extracellular matrix proteins force cells to adopt a reproducible shape and distribution of intracellular compartments avoiding strong cell-to-cell variation that is a major limitation of classical culture conditions. To detect changes in cell morphology induced by compound treatment, fluorescently labeled intracellular structures from several tens of micropatterned cells were transformed into probabilistic density maps. Then, the similarity or difference between two given density maps was quantified using statistical testing that evaluates differences directly from the data without additional analysis or any subjective decision. The versatility of this organelle mapping approach for different magnifications and its performance for different cell shapes has been assessed. Density-based analysis detected changes in cell morphology due to compound treatment in a small-scale proof-of-principle screen demonstrating its compatibility with high-throughput screening. This novel tool for high-content and high-throughput cellular phenotyping can potentially be used for a wide range of applications from drug screening to careful characterization of cellular processes.
Introduction
Many studies have highlighted the complexity of eukaryotic cells. To cope with the enormous number of assays that need to be performed to study the function of cellular proteins and to characterize cellular regulatory circuits, high-throughput approaches have been pushed forward in the past decade. High-throughput approaches monitor many cellular phenotypes under similar assay conditions and thus should allow a better understanding of cell behavior. However, because cultured cells often display strong morphological cell-to-cell variation, 1 high-throughput approaches have experienced some limitations. It has been shown that population size, local cell density, and cell position within a cellular islet determine cellular morphology and responsiveness.
A primary method to study cellular function is to examine cell morphology after a given manipulation such as treatment with chemical compounds or specific gene silencing by RNA interference. These techniques in conjunction with fluorescent microscopy are frequently exploited for functional analyses at the scale of high-throughput studies. 2 Currently, a variety of numerical features are extracted from images that are further analyzed with classification strategies.3,4 Features represent any measured property derived from the image, such as total/mean/standard deviation of fluorescence intensity, texture, Zernike shape descriptions, and so forth. Unfortunately, they often suffer from a lack of biologically meaningful, human interpretable measurements (e.g., texture or Zernike shape descriptions).
We have recently developed a computational approach that takes advantage of the cellular normalization by micropatterning and a novel quantitative organelle mapping approach that allows automated cell morphology comparison. Briefly, morphological cell-to-cell variations are first reduced by plating cells on adhesive microfabricated patterns of extracellular matrix proteins. This in vitro 5 confinement of cell shape mimics the restriction of space that cells experience in body tissues. 6 Then, images of fluorescently marked intracellular proteins are transformed into a cloud of coordinate points, and their spatial organization is rigorously quantified by probabilistic density mapping, 7 an applied mathematical method. Using this approach, we found that intracellular compartments are spatially well defined at the single-cell level in conditions of confined cell adhesion. 7 Because the organization of each tested trafficking compartment was highly reproducible, density mapping was employed to quantify subtle alterations of cellular morphologies. 8 To compare density maps that summarize multivariate data, such as spatial organization of intracellular structures, we have developed a fully automated test that estimates all parameters needed to compute the p value (i.e., the mean and variance parameters of the asymptotically normal null distribution) directly from the segmented data. This test does not require any subjective decisions and allowed the detection of subtle changes in cell organization induced by disruption of the cellular cytoskeleton. 8
In the present work, the density-mapping approach was adjusted to high-throughput screening by implementing cell normalization, density map calculation, and comparison into a 96-well format. The framework was tested for its performance at different magnifications and for different cell shapes. Given that cell morphology can be monitored by probabilistic density maps, statistical significance of the similarity between two cellular morphologies was assessed in an automated and unbiased manner. Thus, density mapping is a novel tool for high-content and high-throughput cellular phenotyping that can be employed without a high level of statistical training.
Materials and Methods
Cells and Sample Preparation
An EGFP-Rab7–expressing stable cell line was generated by transfection of the plasmid pEGFP-Rab7 into hTERT RPE-1 cells (Invitrogen, Carlsbad, CA) and selection with 500 µg/mL geneticin. Cells were grown in DMEM/F12 (for RPE-1) or DMEM (for HeLa) medium supplemented with 10% fetal bovine serum and 1% penicillin/streptomycin. Seventy percent confluent cells were trypsinized and seeded on micropattern-printed 96-well CYTOOplates (CYTOO) at a concentration of 4000 cells/well. To depolymerize microtubules, nocodazole was added in decreasing concentrations (10 µM, 1 µM, 0.1 µM, 10 nM, 1 nM, 0.1 nM), and cells were incubated at 37 °C for 1 h. Taxol, cytochalasin D, carbonyl cyanide m-chlorophenyl hydrazone (CCCP), and ibuprofen were used following the same procedure. All drugs were purchased from Sigma (St. Louis, MO). Cells were fixed with 4% (w/v) formaldehyde for 15 min and washed three times with phosphate-buffered saline (PBS). In the case of an immunofluorescence staining, formaldehyde-fixed cells were quenched with 0.05 M NH4Cl, washed three times with PBS, and permeabilized in PBS/0.2% bovine serum albumin/0.05% saponin. Cells were then incubated with primary antibody anti-Lamp1 (BD Pharmingen, Franklin Lakes, NJ) for 1 h, washed in PBS, and incubated with Alexa Fluor 488- or Cy3-coupled secondary antibodies (Jackson ImmunoResearch, West Grove, PA). After three washes with PBS, nuclei were stained with 0.2 µg/mL Dapi.
Immunofluorescence Image Acquisition and Analysis
Images were acquired using the INCell2000 automated wide-field microscope (GE Healthcare) equipped for image deconvolution. Acquisition was performed using either 10× or 20× dry objectives. Images were sorted in ImageJ 9 using the micropatterned single-cell sorting (MSCS) plugin and segmented with the multidimensional image analysis interface running under MetaMorph (Universal Imaging Corporation, Bedford Hills, NY) based on wavelet decomposition. 10 The watershed function was routinely applied to detect precisely individual structures in dense regions.
Kernel Density Estimator
The coordinates of the segmented structures were processed for density estimation programmed in the ks library
11
in the R programming language
12
: the probability density function f for each data sample of n coordinates X1, X2, …, Xn was estimated. A nonparametric, unbinned kernel density estimator was used. At each of the data points, a kernel function K was centered. The kernel functions were then summed to form the kernel density estimator
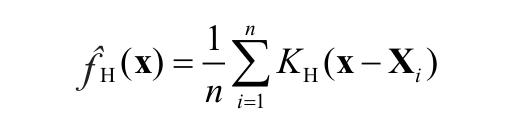
in which KH is the Gaussian kernel with mean zero and variance matrix H. To estimate H (also known as the bandwidth), the plug-in selector in the ks library was used, which has been shown to be reliable for two-dimensional and three-dimensional spatial distributions. 13 For visualizing kernel density estimates, probability contours were employed.14,15 For a 96-well plate, the analysis was adapted to compute the series of density maps in a batch mode.
Statistical Error of Kernel Density Estimation
The statistical error for kernel density estimates was determined by calculating the estimated mean integrated squared error (MISE) as a function of the number of cells analyzed. For the combined sample of the n endomembrane coordinates from m cells, the average number of endomembranes per cell (n/m) was computed. To compute the estimated MISE for j cells, j = 1, 2, …, m, j × (n/m) coordinates were resampled from the total of n coordinates. This resampling was performed 100 times for each j to ensure statistical robustness.
Statistical Testing of Density Maps
The pairwise comparison of endosomal spatial distributions was carried out using the two-sample kernel density–based test introduced by Duong et al.,
8
in which
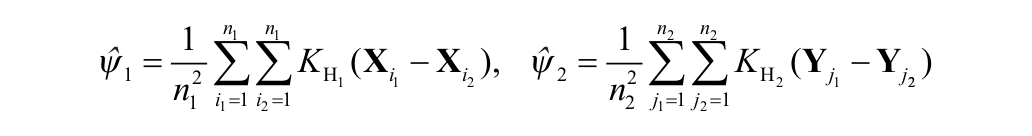
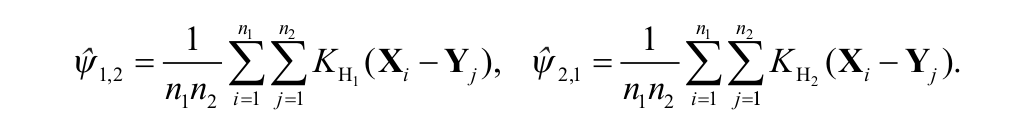
where K is the kernel function and the bandwidth matrix parameters are
Results and Discussion
Cell Plating on 96-Well Micropatterned Substrates and Single-Cell Selection
Cell seeding on micropatterned substrates does not provide complete coverage of all micropatterns, with one single cell required for analysis. Thus, the number of single micropatterned cells in a 96 well was first estimated. Commercially available micropatterned 96-well plates (CYTOO) were obtained that contained an average of 4000 micropatterns/well according to the manufacturer’s estimation. To determine the correlation between cell number and micropattern occupation per single cells, different numbers of cells per well were seeded (3200, 3500, 4000, 4500, or 4800 cells per well). RPE-1 cells that stably expressed EGFP-Rab7, a marker of lysosomes, were used to visualize intracellular compartments. Lysosomes are involved in several important cellular functions, including processing of nutrients, ligands, and receptors during endocytosis that are transported along microtubules. Images were acquired at 10× and 20× for up to four fluorescence channels, including fluorescence staining of micropatterns (Cy5), fluorescence staining of the nucleus (Dapi), and fluorescence stainings for intracellular structures of interest (green fluorescent protein [GFP]; Fig. 1A ). A plugin was programmed in ImageJ (MSCS) to select for patterns that contained only one nucleus and thus one single cell. Briefly, after the detection of each full pattern ( Fig. 1A , upper panel), the same region was cropped for the Dapi channel. Segmentation analysis of the nucleus sorted the images into three categories: no cell per pattern, one cell per pattern, and more than one cell per pattern. Significant differences in the average number of single cells were not detected when varying cell numbers (data not shown). Thus, 4000 cells per well were used for all following experiments. Based on the analysis of 1,199,973 single patterns detected in more than 20 plates, approximately 25% of micropatterns were occupied by a single cell in independent seeding assays. Figure 1B shows the statistics from one typical experiment using nine plates on which a total of 514,571 patterns were detected containing 135,916 single cells (26.4% single-cell occupancy). After the identification of single cells on patterns, the corresponding images visualizing the intracellular compartments were cropped using the pattern as reference ( Fig. 1A ). As a result, stacks of images of single aligned cells were obtained for a given intracellular structure (e.g., lysosomes). Positional information of all structures of interest was extracted by segmentation analysis in Metamorph (Universal Imaging Corporation). Approximately 16 structures per cell were detected at 10× magnification and approximately 55 structures per cell at 20× magnification ( Fig. 1C , D ).
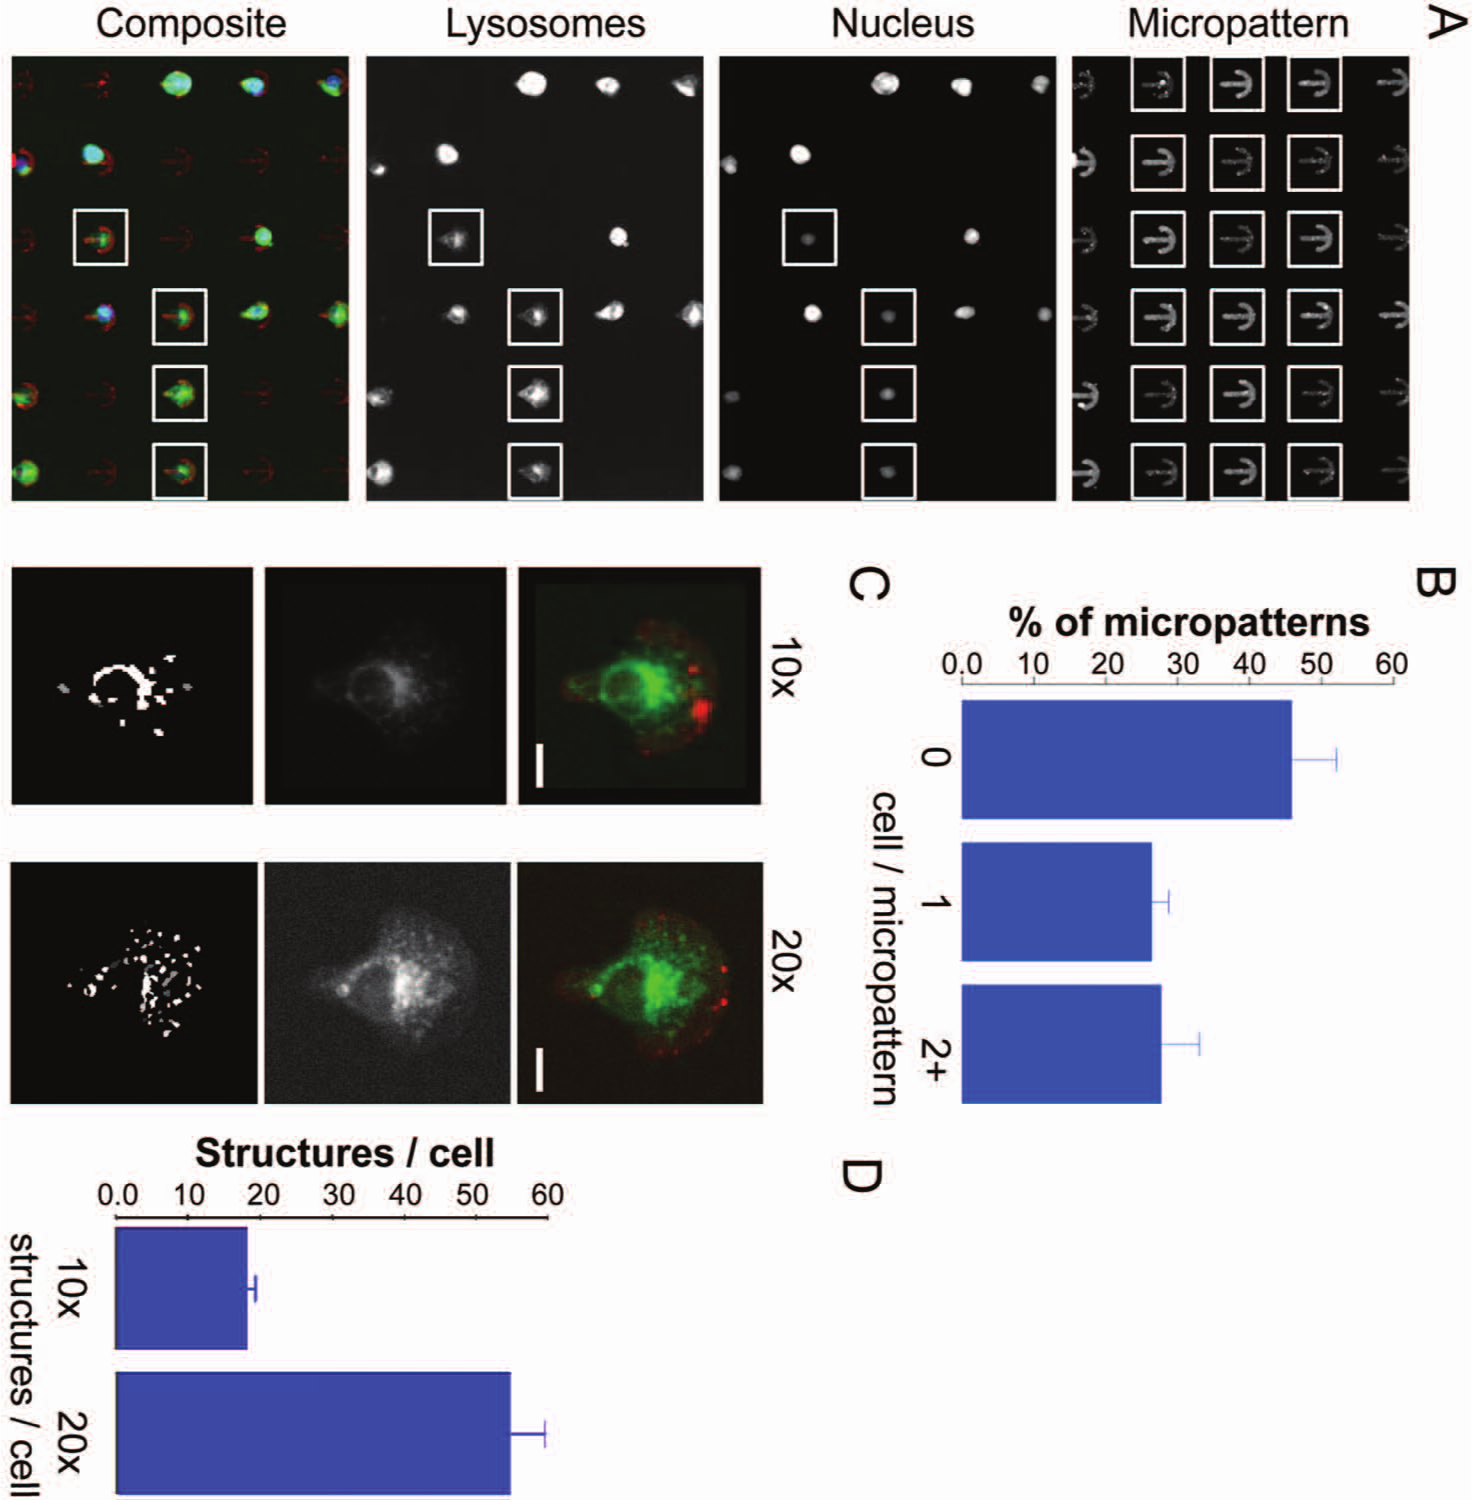
Single-cell selection on the 96-well micropatterned support. (
Implementation of Cell Normalization and Density Map Calculation into a 96-Well Setup
To set up the overall workflow for phenotypic screening using the organelle mapping approach, the 96-well CYTOOplate starters was first employed, which contains five different micropattern shapes (disc-, crossbow-, I-, Y-, and L-shaped micropatterns) in two different sizes of 700 µm2 and 1100 µm2 (
Together, the organelle map framework was adjusted to a high-throughput analysis that allows biological scientists even without a high level of statistical training to identify hits following a user-friendly workflow. It requires cell alignment, segmentation, density calculation, and pairwise statistical testing that are all programmed into a batch mode for the 96-well format to streamline the statistical analysis pipeline.
Cell Number Estimation for Stable Density Maps at Low Magnification and Analysis of Different Pattern Shapes
We have previously shown that 30 to 40 cells were sufficient to obtain stable density maps of different intracellular compartments imaged at 100× ( Fig. 2A , pink). 7 As the total number of structures is important for the reliability of density maps and thus determines the number of cells required for analysis, the reliability of density maps was estimated for an imaging magnification of 20×, which is typically used for high-throughput screening. The MISE of the density estimation of late endosomes was computed in cells grown on small- (700 µm2, light blue) and medium- (1100 µm2, dark blue) sized micropatterns as a function of the number of cells analyzed ( Fig. 2A ) and compared with the MISE obtained for cells imaged at 100×, as shown previously. 7 For less than 10 cell, the box plots of estimated MISEs showed a large variability, with significant improvement in estimated MISE when adding data for each subsequent cell. The estimated MISE only marginally diminished between 20 and 30 cells and did virtually not change thereafter. Density maps from data acquired at 20× were more heterogeneous than those from 100× acquisition (pink) for small numbers of cells; however, all density maps became stable for more than 30 cells. This demonstrated that using density estimation with micropatterned cells at a magnification of 20× is robust from only several tens of cells for both sizes of micropattern.
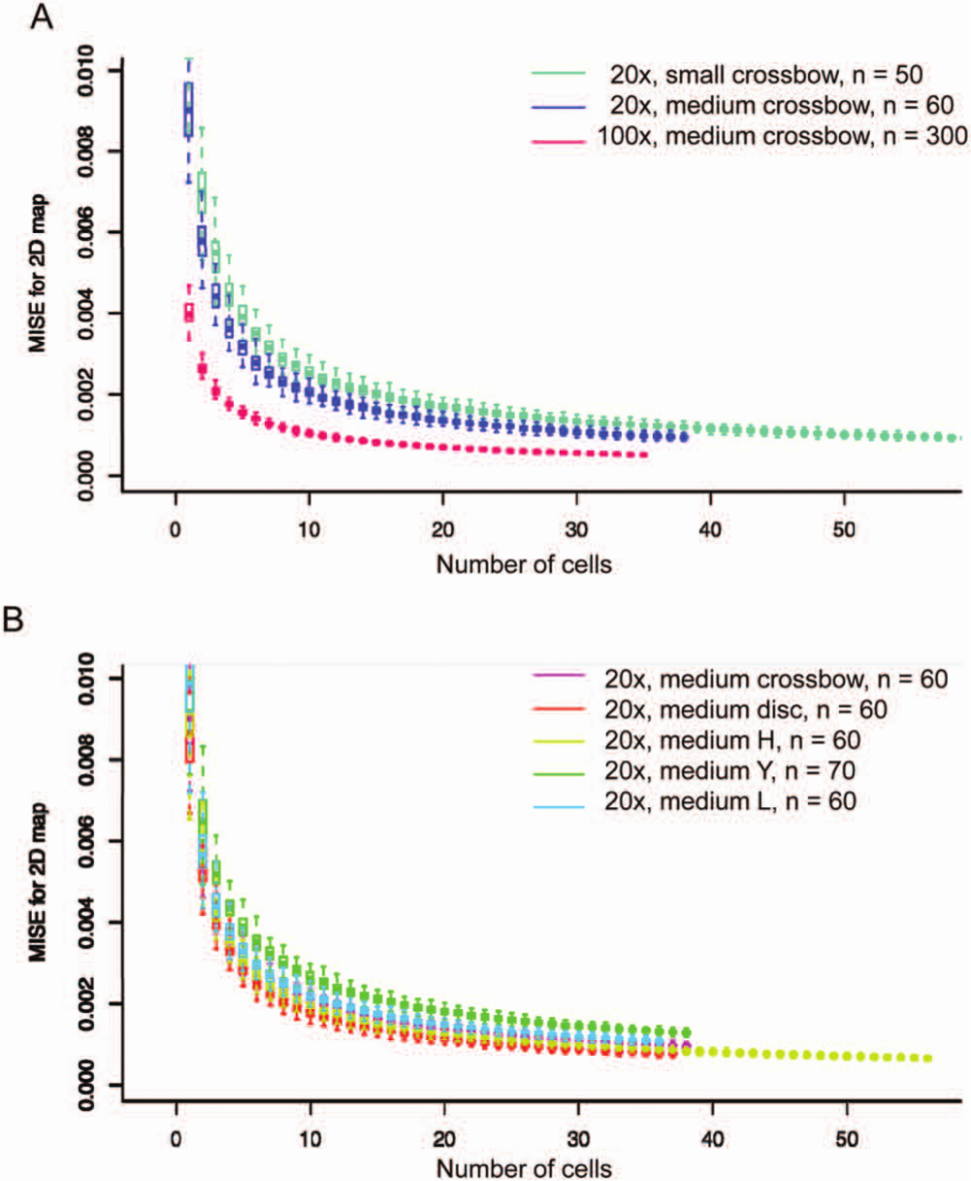
Estimated mean integrated squared error (MISE) for density estimation as a function of the number of cells analyzed. (
In addition, the impact of cell shape on density mapping was analyzed. The MISE was computed for the density maps of lysosomes in cells adhering to the five different micropattern shapes present on the CYTOO plate starter ( Fig. 2B ). Although the MISE behaved very similarly for different shapes, round patterns gave the most stable density maps (red), followed by H-shaped (yellow), crossbow-shaped (pink), L-shaped, and Y-shaped patterns. This analysis showed that the choice of the shape is not critical for density-based analysis.
Together, density-based image analysis performed comparably well between high- and low-magnification images and is adaptable to different micropattern shapes.
Unbiased Comparison of Cell Morphology
To determine assay robustness, a series of quality control analyses was performed in 96-well plates that contained the same micropattern shape (L-form). Again, 4000 EGFP-Rab7–expressing RPE-1 cells were seeded per well. The first control plate contained DMSO in one half of the plate and no treatment in the other half of the plate (
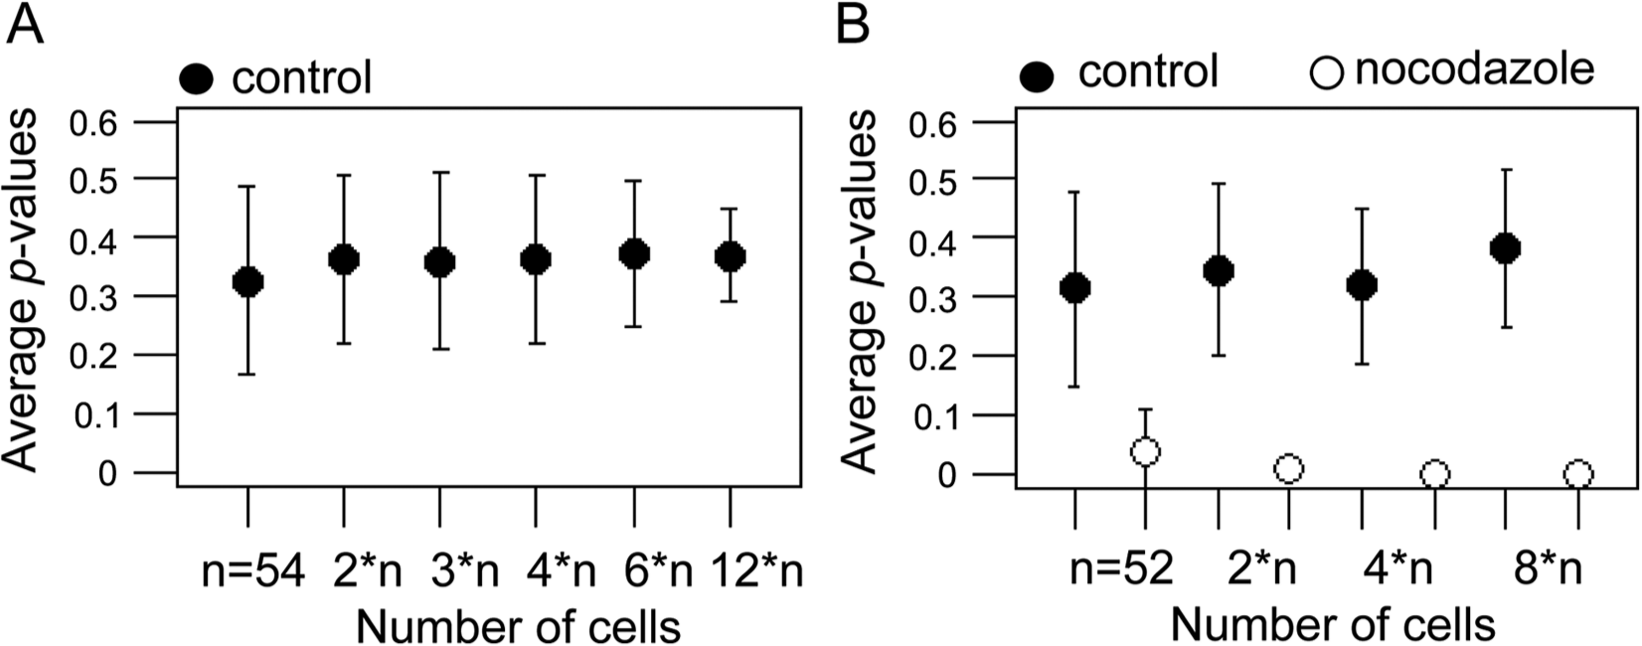
Control analysis of cell morphology comparisons. (
Next, the method’s potential to detect changes in a screen setup was tested by monitoring lysosome positioning upon depolymerization of the microtubule cytoskeleton. A second control plate was prepared containing no treatment, DMSO treatment, and nocodazole treatment in two separated columns (
Together, the results of this analysis demonstrated that changes in intracellular distribution of lysosomes due to microtubule disruption could be detected with statistical significance in a screening setup with several tens of cells.
Detection of Morphological Changes Induced by Different Drug Treatments
To further demonstrate the capability of this framework to detect changes induced by different chemical compounds, several well-characterized drugs were tested in different dilutions. For this analysis, HeLa cells were used that were seeded into a 96-well containing crossbow-shaped micropatterns and were immunostained with α-Lamp1 antibody to detect lysososmes. Forty-two fields per well were acquired, giving rise to about 150 single cells per well. A decision was made to oversample, because HeLa cell morphology is more heterogeneous than that of RPE-1 cells
7
(e.g., the organization of the Golgi apparatus can be fragmented or not), potentially requiring more cells for a robust analysis. In addition to nocodazole, other drugs were tested, including taxol, which stabilizes microtubules; cytochalasin D, which inhibits actin polymerization; and CCCP, which inhibits the proton motive force as well as ibuprofen as negative control. Each drug was tested in dose response with concentrations ranging from 10 µM to 0.1 nM (1:10 serial dilutions), and each drug concentration was tested in triplicate (
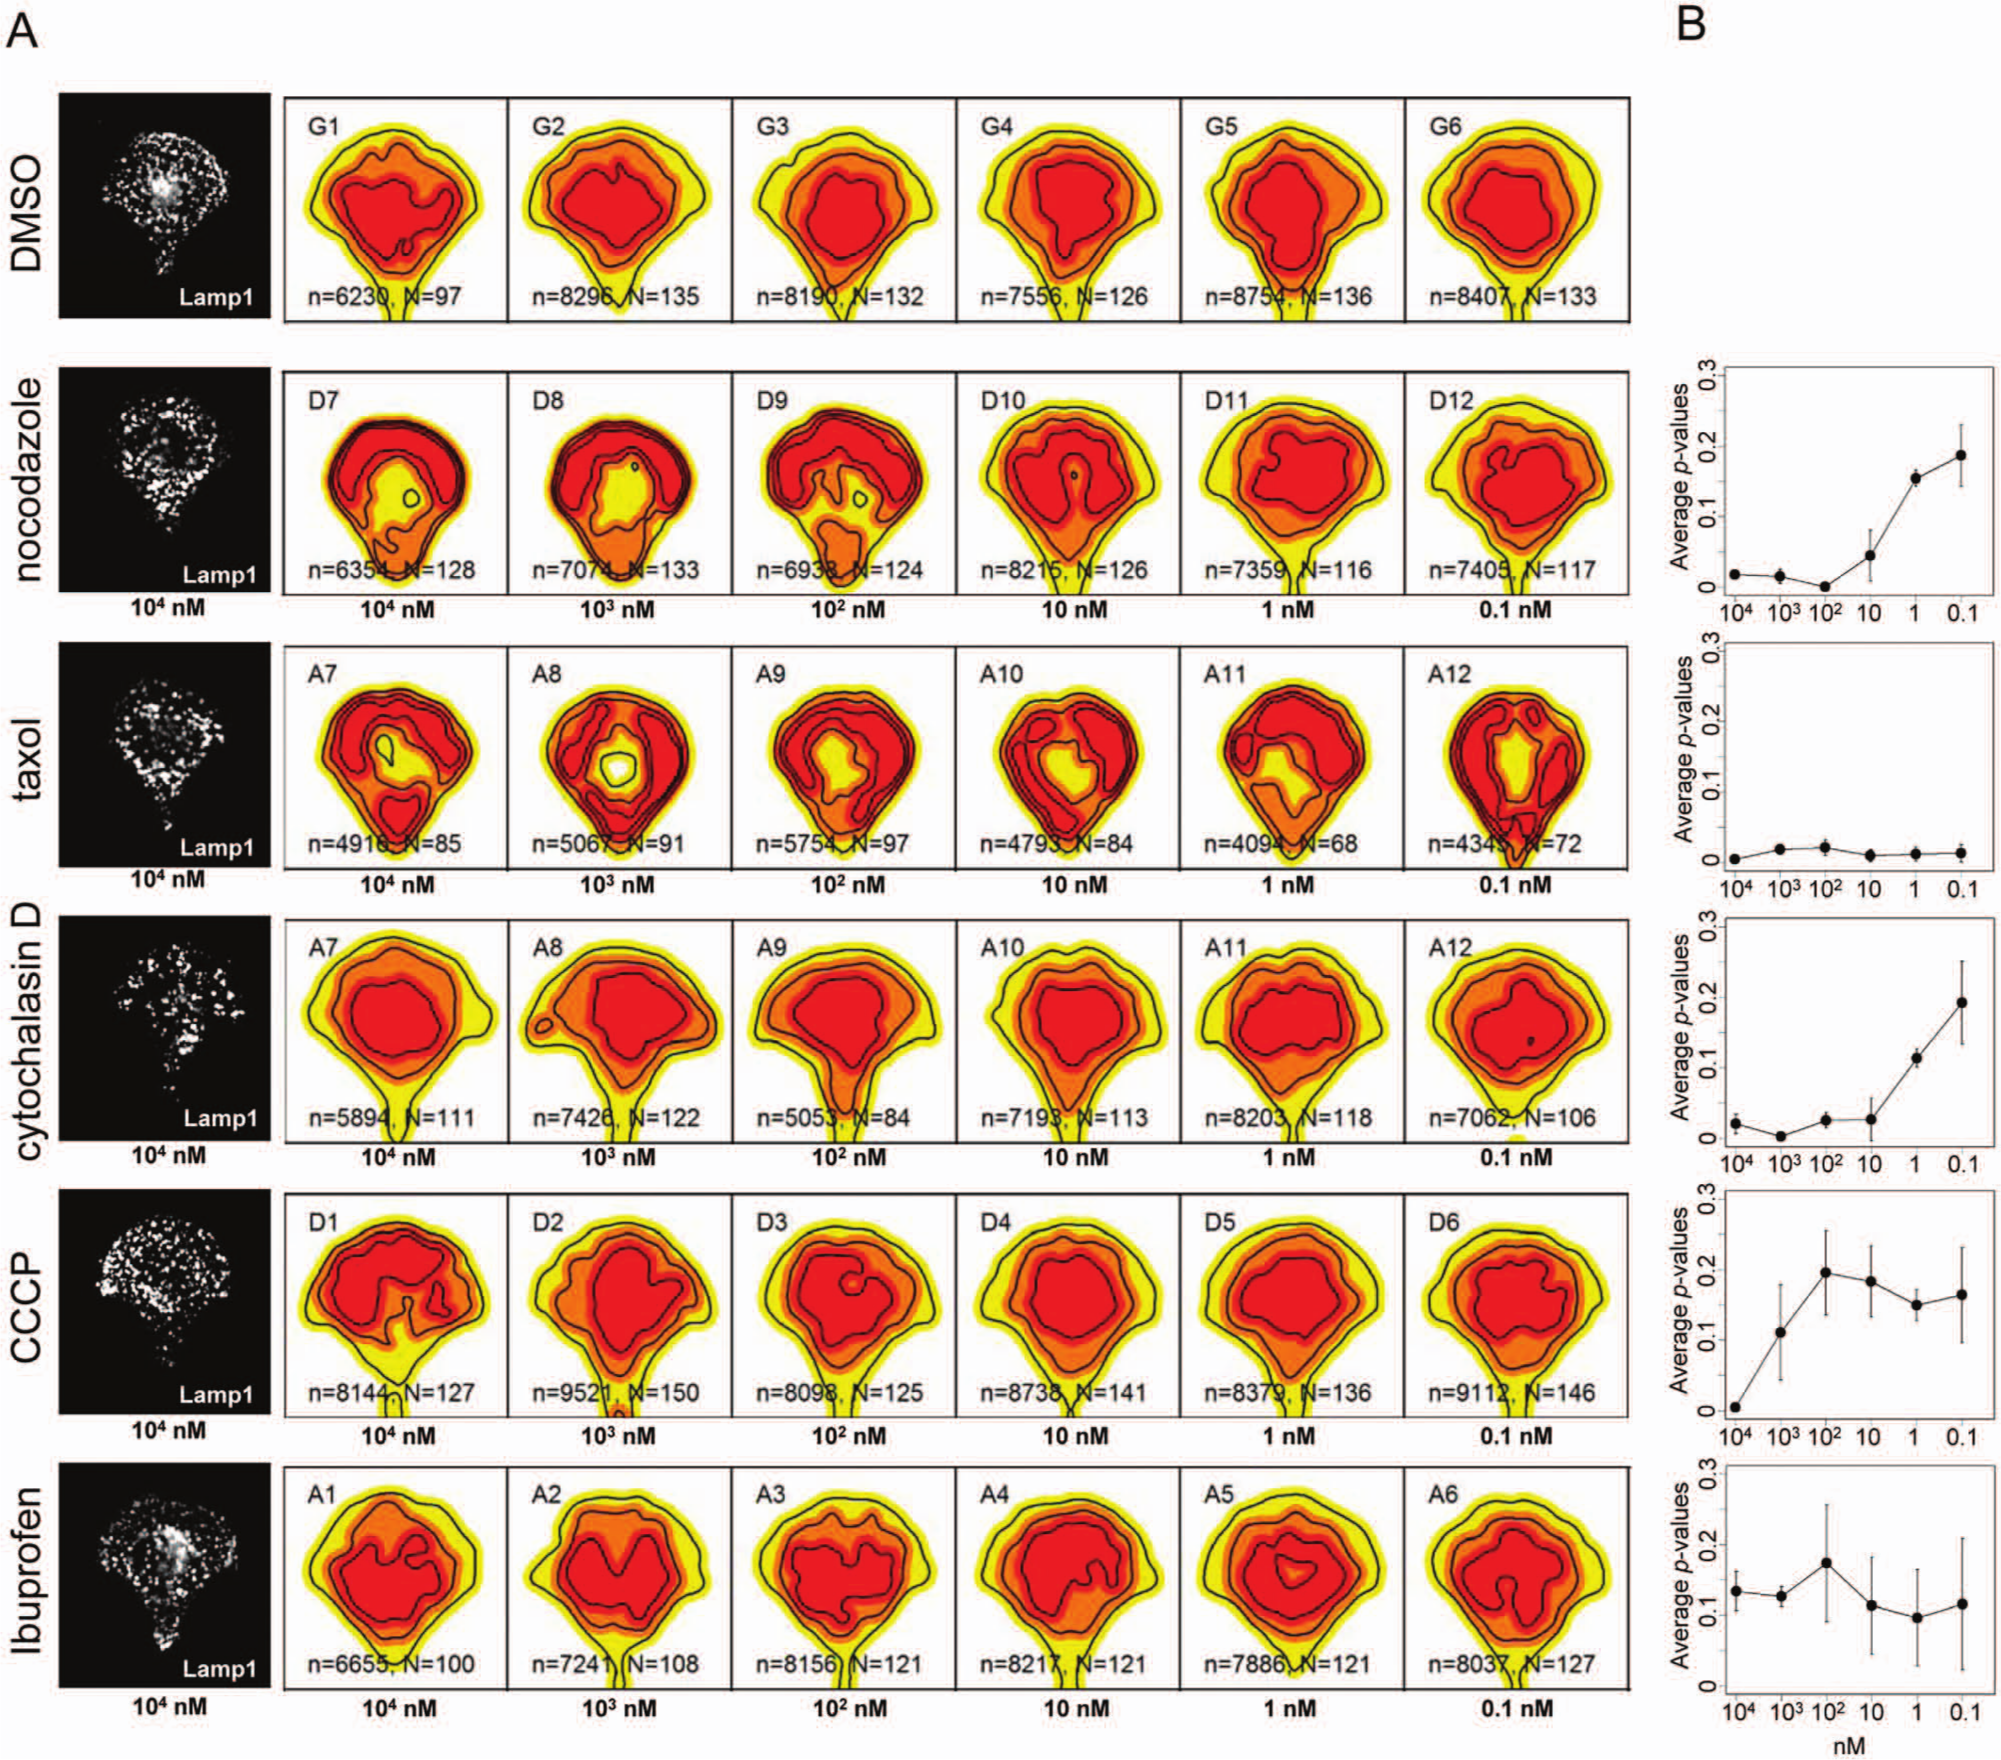
Detection of morphological changes after drug treatment in a 96-well setup. (
One limitation in applying our approach for very high-throughput screening (e.g., genomewide screening or big drug libraries) is the large amount of acquired images that is required to detect sufficient single cells as they represent only a quarter of all imaged micropatterns. To solve this problem, smart microscopes will be required that perform a preimaging at low resolution and specifically acquire regions with many single cells. Optimally, only well-spread cells should be selected that reduce the number of analyzed cells to about 30, as indicated by the MISE estimation. Currently, our approach is suitable for screens with a lower amount of conditions to test, such as well-defined drug libraries, siRNA libraries targeting specific gene families, or in secondary screens.
Together, density-based analysis was tested in a screening setup, in which changes in lysosomal positioning were detected for several drugs tested. Density-based screening may inherit several advantages of our probabilistic image analysis method7,8: (1) Unlike state-of-the-art high-content/high-throughput analysis on unrestricted cells having massive cell-to-cell variation, statistically significant results are obtained with only several tens of cells per condition. (2) Density-based screening estimates all required test parameters directly from the data and do not require computationally intensive analytical techniques such as classification. As image acquisition facilities are developed at an accelerated speed and advanced microscopes acquire thousands of images daily, there is a rising need for automated image analysis tools. (3) The organelle maps for each well allow direct visualization of cellular phenotypes. Thus, our organelle mapping framework in micropatterned cells may represent a major step toward quantitative, high-content, and fast analysis for automated detection of cell morphology changes in high-throughput screens. This framework has the potential to become a gold standard for cell phenotyping in high-troughput screening.
Footnotes
Acknowledgements
We acknowledge Hesna Kara for the construction of stably GFP-expressing cell lines. We would like to thank Jean-Baptiste Brault and Lena Oesterlin for critical reading of the article.
Declaration of Conflicting Interests
The authors declared the following potential conflicts of interest with respect to the research, authorship, and/or publication of this article: A patent (PCT No. EP2012/064239) has been filed on the density-based two-sample test.
Funding
The authors disclosed receipt of the following financial support for the research, authorship, and/or publication of this article: K.S. received funding from the Fondation pour la Recherche Médicale en France and Association pour la Recherche sur le Cancer. J.-P.G. is supported by the Association pour la Recherche sur le Cancer. This project was further supported by grants from Agence Nationale de la Recherche (#2010 BLAN 122902), the Centre National de la Recherche Scientifique and Institut Curie, and the OSEO ISI program to CYTOO.