
Abstract
We have designed an Excel spreadsheet to facilitate the planning and execution of screenings performed manually or in semi-automation mode, following a sequential set of events. Many assays involve multiple steps, often including time-sensitive stages, thus complicating the proper implementation to ensure that all plates are treated equally to achieve reliable outcomes. The spreadsheet macro presented in this study analyzes and breaks down the timings for all tasks, calculates the limitation in the number of plates that suit the desired parameters, and allows for optimization based on tolerance of time delay and equal treatment of plates when possible. The generated Gantt charts allow for visual inspection of the screening process and provide timings in a tabulated form to assist the user to conduct the experiments as projected by the software. The program can be downloaded from http://sourceforge.net/projects/sams-hts/.
Introduction
Screening compounds to discover therapeutic candidates or chemical probes involves several operational steps, such as liquid dispensing and plate reading. In a fully automated and multitasking screening platform, dedicated devices work in harmony controlled by scheduling algorithms to ensure that every assay plate is treated consistently.1,2 In addition, this complex scheduling approach minimizes total screening time by performing tasks based on resource availability rather than following a sequential progression of events. However, in most facilities involved in drug discovery, particularly in academia, the screening process is performed manually or in semi-automation mode, oftentimes with the assistance of stackers. 3 For instance, biological reagents are manually dispensed into a limited number of plates using liquid-handling devices. Once the dispensing step is completed, a subsequent step in the sequence is applied, such as the transfer of compounds to all the plates. The succession continues until all the discrete phases have been concluded.
The semi-automation approach has several advantages over the multitasking fully automated screening deck, such as low cost, flexibility, and speed for simple assays with a limited number of plates. 4 Nevertheless, a major drawback is the difficulty in ensuring that all plates are treated equally. This is especially troublesome in biochemical assays, whereby certain steps such as incubation times have to be consistent for all plates. As a simple illustration, one can consider the transfer of compounds into plates containing enzyme solution, a process that takes 3 min/plate using a pintool device. At the end of 10 plates, the first plate would already be incubated with the compounds for 30 min. If the protocol requires incubation with the compounds for 30 min prior to dispensing of a second reagent, the first plate would be ready for the liquid transfer step, but subsequent plates would require a waiting time of 3 min in between each plate. It can soon become a daunting task when trying to accommodate multiple steps that are sensitive to subtle time variations. We have developed a user-friendly interface in Microsoft (MS) Excel that allows the user to define the various tasks with the corresponding process time. A Gantt chart 5 and a detailed schedule in tabular format are generated that facilitate the user to decide the maximum number of plates to be run under the specified conditions. In addition, the software allows for timing optimization based on delay constrains and equal treatment of plates for crucial tasks.
Materials and Methods
This program is designed with MS Excel Visual Basic for Applications (VBA) for easy customization and intuitive user interaction via spreadsheets. It is provided as an Excel Macro-Enabled Workbook (http://sourceforge.net/projects/sams-hts/) and can be used in operating systems that support MS Excel 2007 and newer versions. The main Excel spreadsheet is designed as a user input page to contain an assay-specific task list and the durations for each task for a single plate ( Fig. 1 ). The user can denote any operation by typing directly in the designated spreadsheet area, but there are a few predefined tasks that are selected from the drop-down menu and have to be used accordingly for proper calculations. For each step (except the last), the user has the option to enter a delay tolerance value, which would correspond to the delay immediately following that assay step, and/or to select if the plates are to be treated equally between the current and the subsequent stage. The total number of plates that will be processed in a particular experiment should be entered in the designated cell. For convenience, the estimated starting time for the experiment should be provided in the corresponding field, so that all the time calculations would be applied accordingly. As for the analysis results, a report page is generated with a summary linked to the output tables and Gantt charts, which are appended in the same Excel file under different tabs. If there is a prospect for optimization, the optimized timings are prepared as a table and a chart along the original schedule. The user should then inspect the Gantt chart to ensure that the tasks follow the intended operational schedule; otherwise, options such as timings, tolerance, or equal treatment of plates can be taken into account. Alternatively, the introduction of elements such as incubation type 2 or gap can be considered. All of these features are explained in detail below.
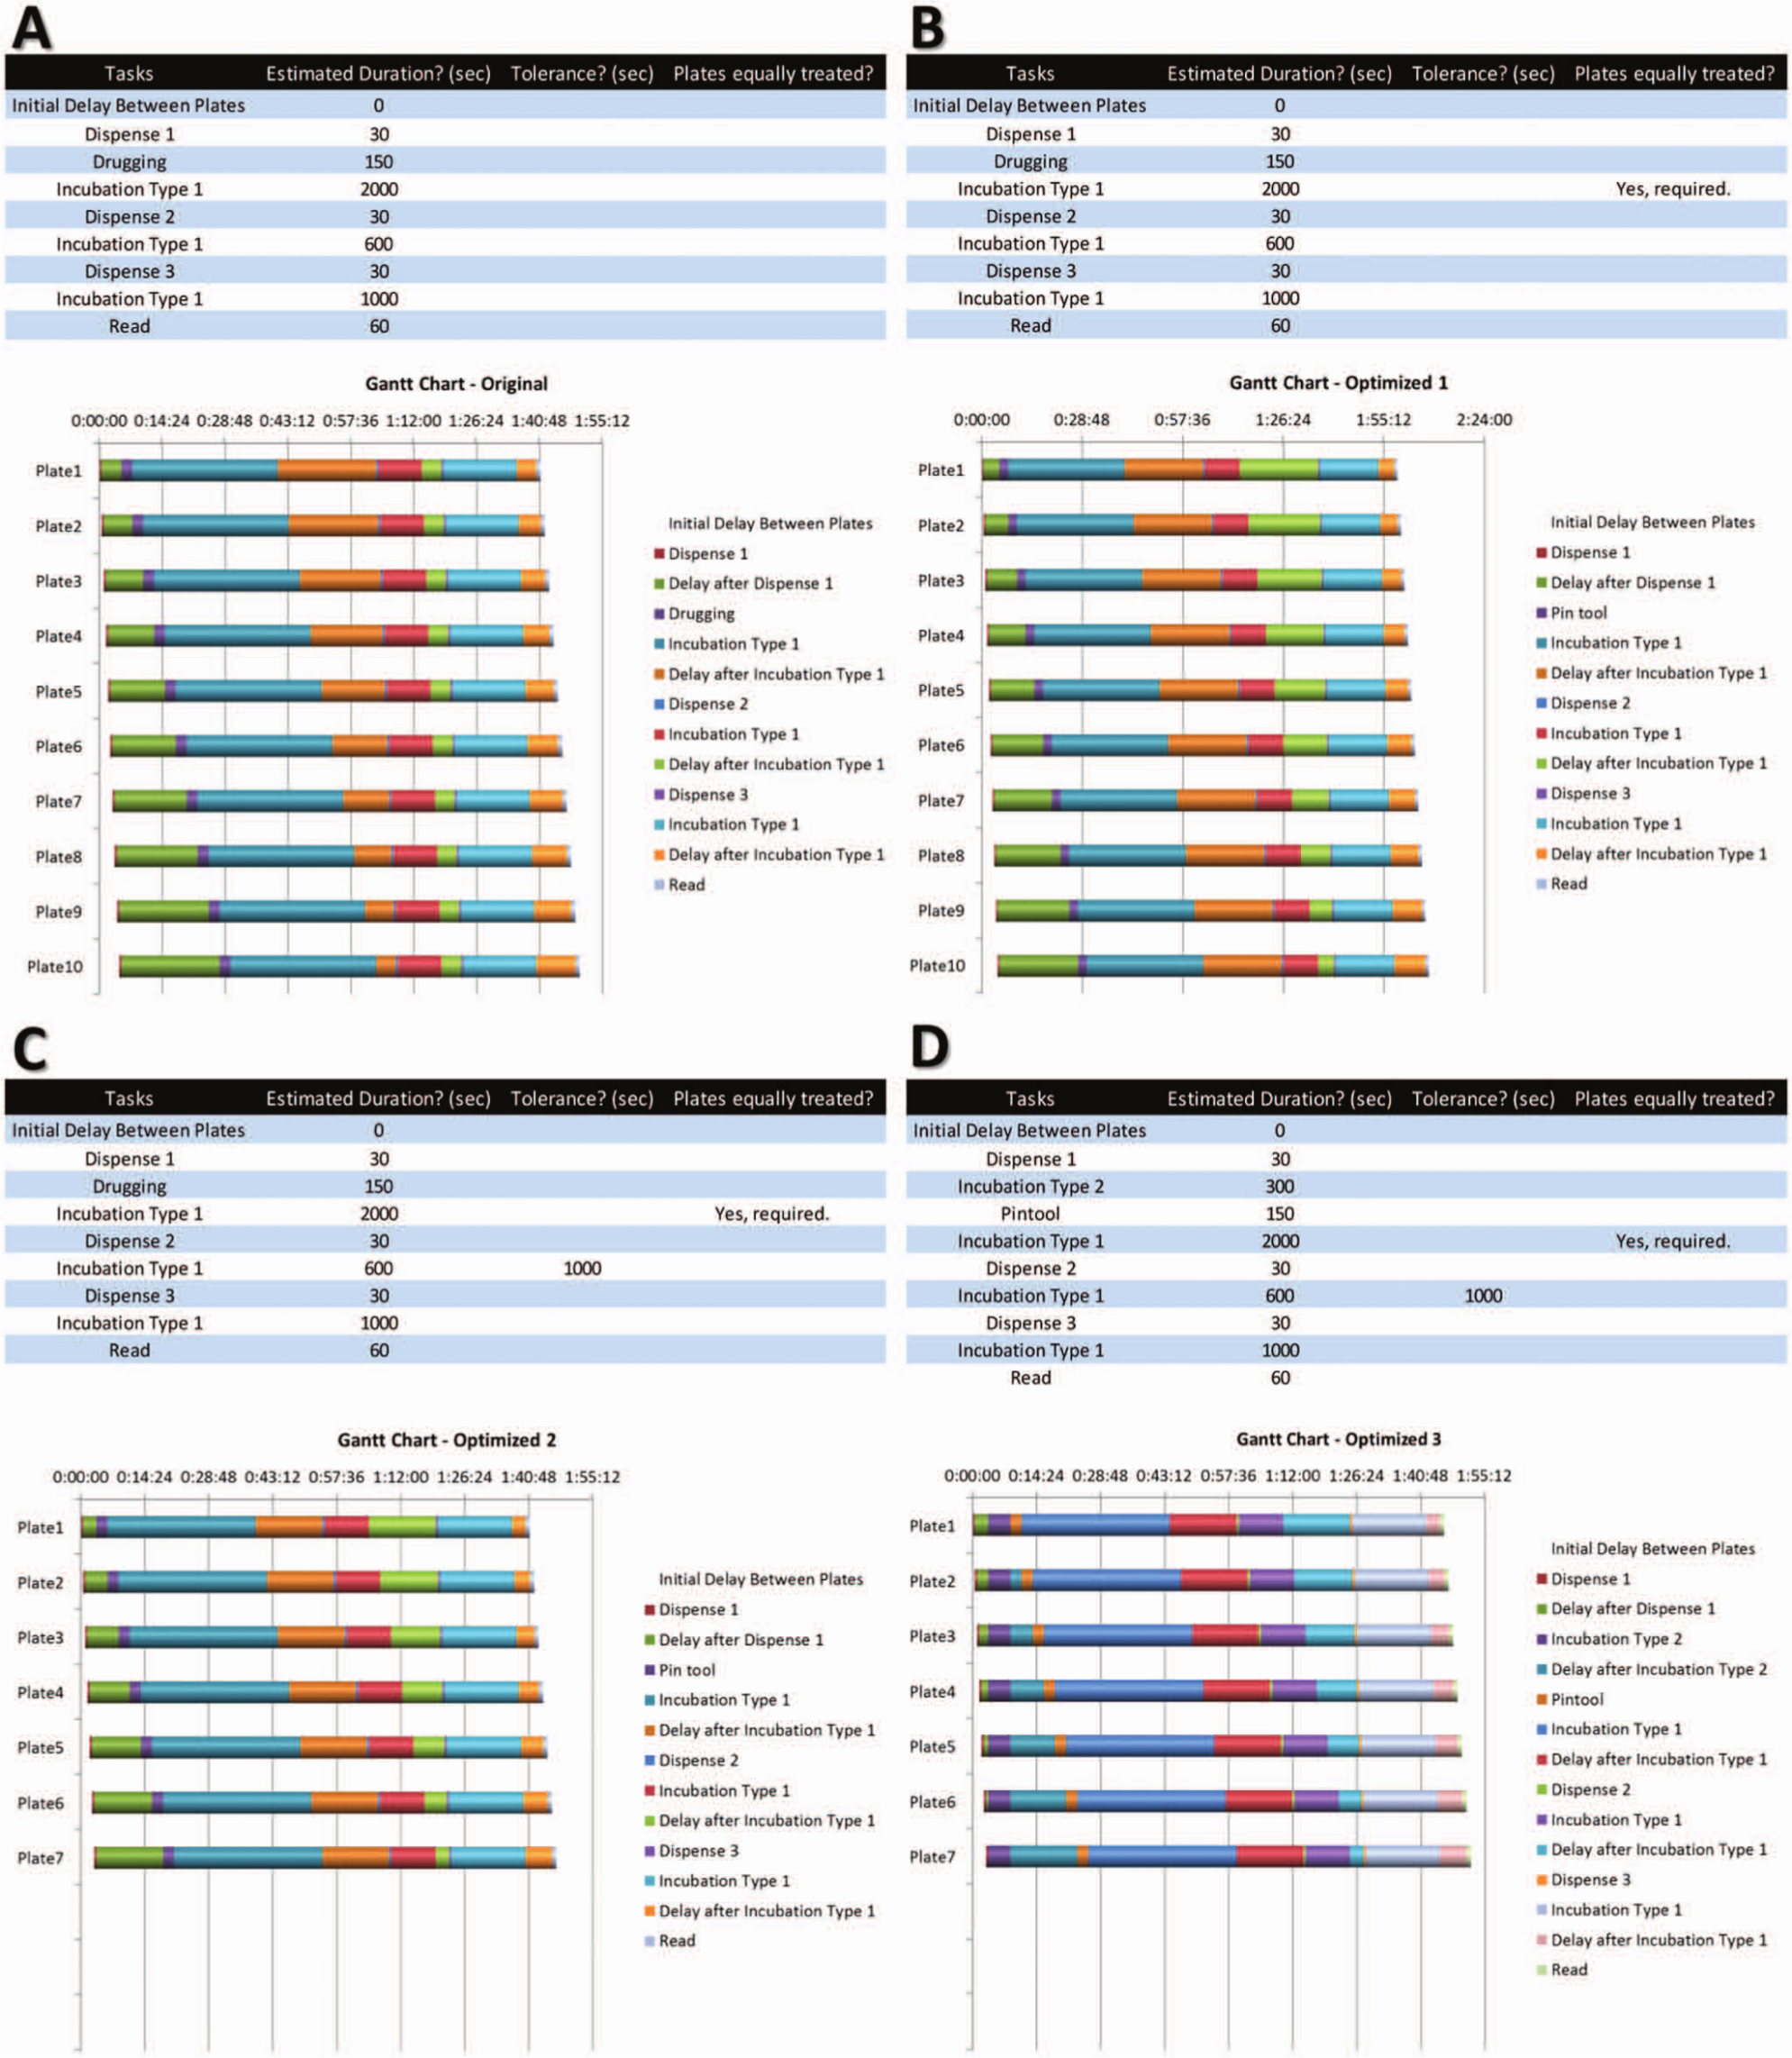
Gantt charts corresponding to four different situations, with the corresponding parameters and timings for a hypothetical experiment. (
Results and Discussion
The software has been designed to aid in the planning of screening campaigns performed manually or with the aid of stackers, where each task is completed for all plates prior to moving forward with the next step. It provides the user with detailed timings for every operation, and it optimizes the process based on crucial events. The generated Gantt charts provide a powerful way to display the timings of every task, allowing for visual inspection of the screening process ( Fig. 1 ). A comprehensible table with the starting time for each step is also provided, which facilitates the user to perform the experiments as projected by the software ( Fig. 2 ).
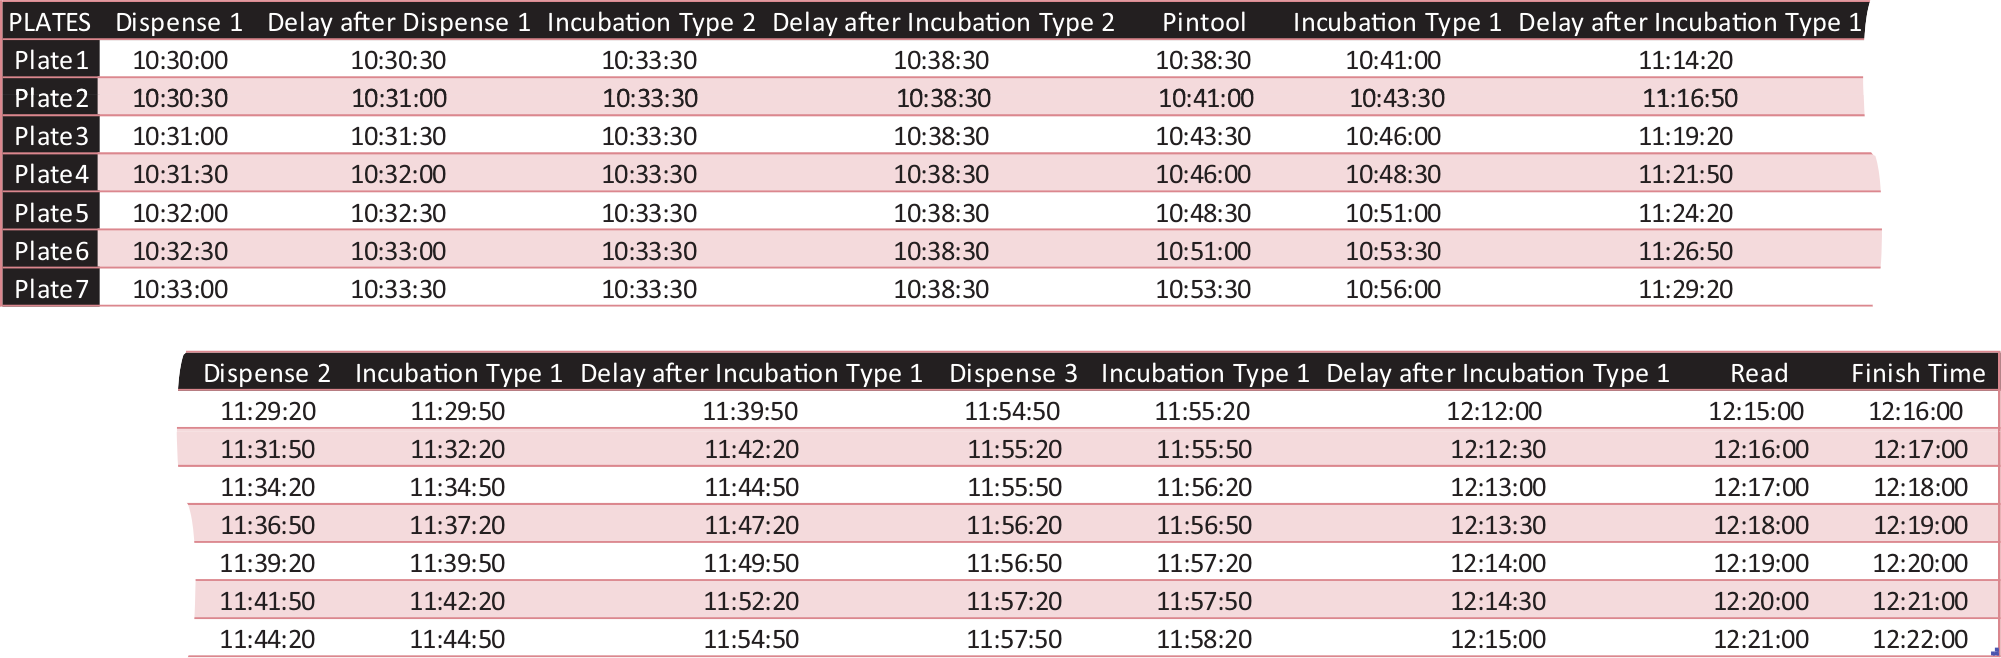
A comprehensible table displaying the starting time for each of the tasks corresponding to the scenario indicated in Figure 1D . This table facilitates the user to perform the experiments as projected by the program.
To illustrate features and capabilities, we can consider a hypothetical experiment with the following tasks ( Fig. 1 ): initial dispense of the biological reagent into assay plates (dispense 1), compound transfer from compound plates to assay plates using pintool (drugging), incubation, dispense of detection reagent 1 (dispense 2), incubation, dispense of detection reagent 2 (dispense 3), incubation, and plate reading. After specifying the duration (in seconds) for each step, the Gantt chart indicates that processing 10 plates takes 1 h, 50 min ( Fig. 1A ). Because all plates need to finish a specific task before being moved to the next stage, a delay is automatically added as plates are processed one by one. For instance, the “Delay after Dispense 1” in Figure 1A is calculated as the total of two subdelays, one of which is required to finish the dispense step for all the plates ( Fig. 3 , left to the dashed line), whereas the second one is required to hold the subsequent plates until the pintool becomes available ( Fig. 3 , right to the dashed line). In general, when moving vertically in the Gantt chart from plate 1 to plate 10, the delay increases when the preceding step is shorter than the succeeding one (e.g., between dispense 1 and drugging), whereas the delay decreases in the reverse situation (e.g., between incubation type 1 and dispense 2). Incubation times can be forcefully extended by the inevitable introduction of these delays, leading to differences in incubation times across plates. In cases where these differences are unacceptable, the user can indicate that all plates should be treated equally, despite the prolonged incubation due to the incorporation of additional delays ( Fig. 1B , incubation after drugging). As a cautionary note, it is not always feasible to indicate equal treatment of plates, as the program will stipulate that fewer plates than desired would logically be in accordance with the parameters. In some situations, the stacker has to be programmed to deliver plates with certain preset delays according to the optimized timetable to satisfy the equal treatment conditions, which may not be an available feature in some instruments.
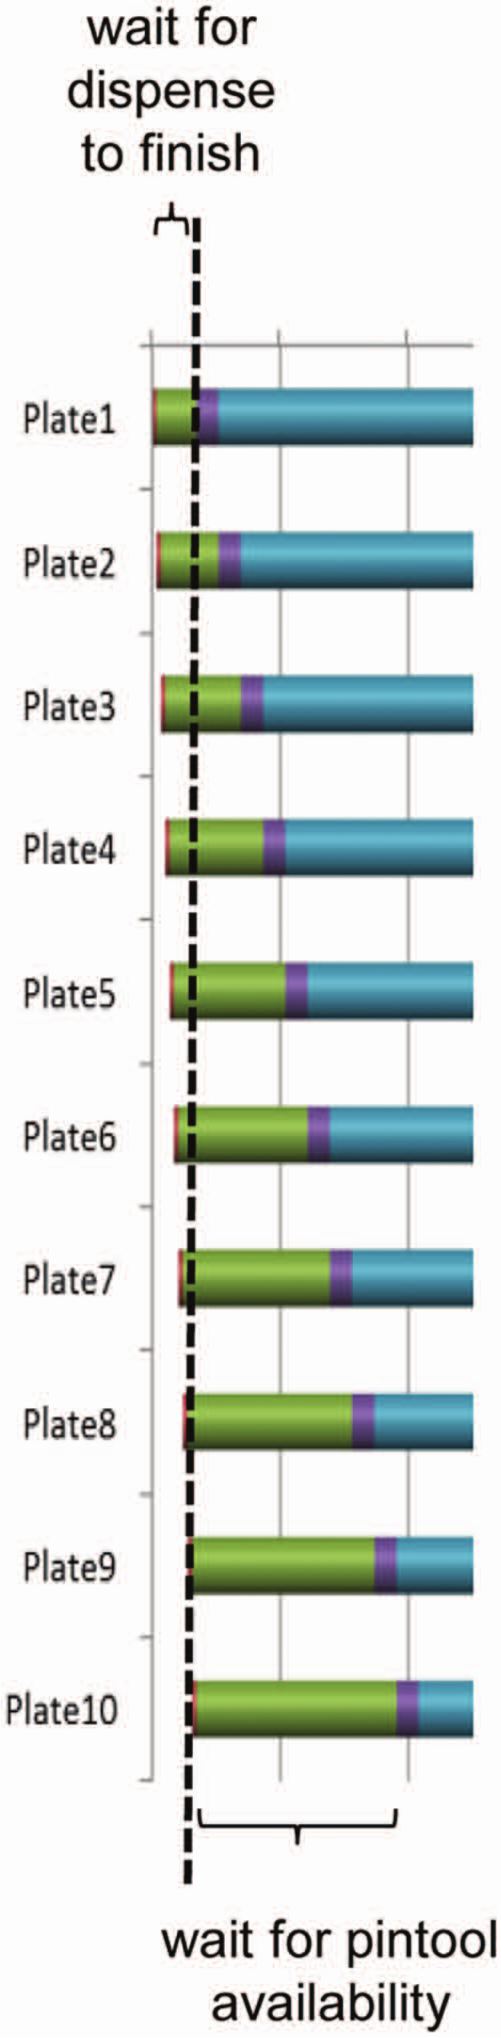
Section of the Gantt chart from Figure 1A showing subdivisions of a delay (separated by a dashed line) between dispense and drugging steps. The green bar to the left of the dashed line corresponds to the delay needed for all plates to finish dispensing, whereas the green bar to the right of the dashed line relates to plates waiting for pintool availability.
In various instances, some timing variation among plates can be tolerated. The user can define the additional time delay that can be tolerated ( Fig. 1C ). In the demonstrated example, a tolerance of 1000 s is defined for the delay after the second incubation, which would prevent any calculated delay between plates to exceed the user-defined value. Because of the added tolerance of 1000 s, only 7 plates meet the criteria out of 10 plates originally considered. This feature is useful in enzymatic reactions, where the activity is linear only over a certain initial period.
The incubation type 2, gap, and centrifugation descriptors that are predefined in the drop-down menu are treated in the same manner by the software: they place a pause or break after all plates have finished a previous task to allow the user to have a minimum amount of time to move the plates from one location to another or to centrifuge plates in bulk rather than on a plate-by-plate basis. Hence, incubation type 1 starts as soon as the preceding task is completed for a given plate (e.g., when incubating at room temperature), whereas incubation type 2 begins after all plates have completed a given step (e.g., when incubating all plates in bulk at 37 °C). The difference between these two can be appreciated in Figure 1D , where a 300-s incubation type 2 is introduced between the first dispense step and drugging. Therefore, the Gantt chart is optimized differently compared with the one presented in Figure 1C .
Gantt charts are commonly used in scheduling software for automated screening systems integrated with robotic arms, where multiple tasks are performed simultaneously. However, screenings are performed manually or in semi-automation mode in most academic institutions, and they follow rather a sequential approach. Many of these assays involve multiple phases, and they often include time-sensitive steps. To facilitate the planning and execution of these experiments, we have created a program that analyzes and breaks down the timings for all events, providing the maximum number of plates that follow the desired parameters and the ability to optimize the timings. Some of the key features in the proper implementation of the scheduling management include choosing the correct type of incubation, assigning tolerance values, and indicating mandatory equal treatment of plates. We have demonstrated the utilization of this program in several small-scale biochemical and cell-based assays. The addition of timing delays is required to process all plates in a particular step prior to moving to the next unit operation, which in itself has an inherent weakness for certain types of assays. There are instances when the substrate in an enzymatic reaction is rapidly depleted or the product of the enzymatic reaction is inhibitory (such as in time-dependent cytochrome P450 inhibition), in which case the addition of delays between plates might not be appropriate. This is in contrast to time-dependent assays where the signal is linear over a sufficiently long time for the processing of multiple plates.
Footnotes
Acknowledgements
We thank the members of the High-Throughput Screening Center at St. Jude Children’s Research Hospital for valuable discussions.
Declaration of Conflicting Interests
The authors declared no potential conflicts of interest with respect to the research, authorship, and/or publication of this article.
Funding
The authors disclosed receipt of the following financial support for the research, authorship, and/or publication of this article: This work was supported by the American Lebanese Syrian Associated Charities (ALSAC), St. Jude Children’s Research Hospital, and National Cancer Institute grant P30CA027165.