
Abstract
High-throughput cell-based techniques that permit early detection of compound-induced genotoxic damage have recently become available. Methods based on induction of the GADD45a promoter are attractive because multiple intracellular mechanisms that detect genetic damage intersect at this checkpoint gene. Consequently, assays such as GreenScreen HC, which uses p53-competant human TK6 lymphoblastoid cells and a GADD45a-GFP reporter, have been developed. GreenScreen HC allows weekly testing of dozens of compounds using 96-well microplates, with high interassay consistency. BlueScreen HC is a recent advancement, coupling GADD45a to Gaussia luciferase, with several advantages over GADD45a-GFP including the potential for miniaturization. Here we describe implementation of a 384-well BlueScreen assay. For drug discovery programs carrying out iterative analogue synthesis around a chemical lead series, these assays permit assessment of compound genotoxic potential in parallel to, rather than subsequent to, determination of activity at a therapeutic target. We demonstrate comparability of BlueScreen-384 to GreenScreen HC and illustrate the use of BlueScreen-384 to explore the structure-activity relationship around a genotoxic lead molecule to identify nongenotoxic analogues. BlueScreen-384 can reduce the need for costly and time-consuming analogue testing in more traditional genotoxicity tests, such as the Ames test.
Keywords
Introduction
Current practice for detecting genotoxicity during drug discovery is to test new chemical entities (NCEs) in standard tests recognized by regulatory bodies. Guidelines produced by the International Conference on Harmonization of Technical Requirements for Registration of Pharmaceuticals for Human Use (ICH) set out an optimized battery of in vitro and in vivo genotoxicity tests for prediction of carcinogenicity risk to humans. 1 The guidelines recommend that mutagenicity is assessed in a bacterial mutation (Ames) test and that genotoxicity should also be evaluated in mammalian cells. In vitro assessment of chromosome damage in mammalian cells is performed either via cytogenetic observation, evaluation of micronuclei, or using a mouse lymphoma thymidine kinase assay. An in vivo test for micronuclei or chromosome aberrations in rodent hematopoietic cells is also required. 1 Compound-induced genetic damage can occur by multiple different mechanisms, and these mechanisms are detected with differing false-positive and false-negative rates in the different tests. 2 Hence, using a battery of assays ensures that the broadest possible range of potentially genotoxic carcinogens is detected.
The ICH-approved tests are effective in removing compounds that pose a genotoxic hazard from the drug discovery pipeline prior to human exposure. However, their capacity is limited by the requirement for relatively large quantities of pure test compound. 3 For this reason, ICH-approved tests have generally been carried out on compounds that have a desired profile of activity at therapeutic target and optimized selectivity and pharmacokinetic properties. Such a profile is usually achieved only after substantial investment in lead optimization. It would be desirable to test for a genotoxic hazard potential earlier in the drug discovery process, so that hazard-associated lead compounds can be discontinued, ICH-approved tests implemented earlier, or genotoxicity data incorporated into chemical synthesis decision making. Overall, this should reduce the frequency of unexpected activity in ICH-approved genotoxicity tests of candidate compounds that otherwise have attractive profiles for clinical development.
In recent years, a number of higher-throughput tests to detect genotoxic events have been described. Ames II is a bacterial reversion assay that uses the same Salmonella typhimurium and Escherichia coli strains as the gold standard Ames test in a miniaturized format amenable to automation, requiring approximately 20 to 30 mg compound compared with gram quantities for the standard ICH-approved tests. 4 Other assays detect downstream events triggered by DNA damage rather than direct damage to a specific gene. The Vitotox assay is a bacterial reporter gene assay that makes use of the SOS response system, which is activated under conditions of genotoxic stress. Cells express luciferase under the control of the RecN promoter, which is strongly repressed under normal conditions but activated by DNA damage. 3 The Ames II and Vitotox assays are performed in prokaryotes and cannot assess mechanisms of genotoxicity that are specific to eukaryotes (e.g., chromatin damage). This gap has been addressed by assays relying on up-regulation of the RAD54 gene in yeast, including GreenScreen GC, which uses a RAD54-GFP reporter, 5 and RadarScreen, based on a RAD54-luciferase reporter. 3
The higher-throughput assays described above employ nonmammalian cell systems. Hastwell et al. 6 developed GreenScreen HC, a reporter gene assay that employs a p53-competent human TK6 lymphoblastoid cell line. Cells are stably transfected with the reporter gene GFP expressed under the control of the promoter and other regulatory regions of the GADD45a gene. GADD45a is induced by genotoxins from a wide range of mechanistic classes, including mutagens, clastogens, and aneugens.7–9 By measuring GFP fluorescence using a standard plate reader, it is possible to infer the level of induction of GADD45a in response to a test article, thus providing an indication of genotoxic hazard potential. GADD45a may also be induced through nongenotoxic mechanisms, and this is an important consideration in interpreting test data. For example, removal of growth factor from culture media has been shown to induce GADD45a through the activation of the transcription factor FOXO3a in the Rat-1 rodent fibroblast cell line. 10
GreenScreen HC can shift detection of genotoxicity earlier in the drug discovery and development process. The assay is completed within 48 h and is routinely performed in a 96-well microplate format. In addition, only submilligram quantities of compound are required. The false-positive rate of GreenScreen HC is substantially lower than that of the ICH-approved mammalian cell in vitro genotoxicity assays. 9 We have several years of experience in implementing GreenScreen HC early in drug discovery under license from Gentronix. The assay is performed on >1000 compounds per year, sufficient to test key exemplars from ongoing lead optimization, with follow-up analogue testing when an active compound is detected. However, the GreenScreen HC 96-well protocol is a relatively resource- and labor-intensive assay. Detection of GFP is liable to interference due to compounds that induce autofluorescence. To differentiate these, a parallel test is required using a control cell line containing a frame-shifted reporter in which GFP expression is not under control of the GADD45a promote. Hence, four concentration-response curves are generated per test 96-well microplate, using the recommended plate format. 6 For highly fluorescent and autofluorescence-inducing compounds, GreenScreen HC data can still be differentiated, but this requires a flow-cytometric version of the assay. 11 Finally, compounds are routinely prepared for testing using 2% DMSO as diluent, and data analysis is not automated. Because of these features, GreenScreen HC is not integrated alongside other high-throughput compound-profiling assays, which typically run in 384-well format, but is performed separately in a genetic toxicology laboratory.
Recently, Gentronix described a new derivative of the TK6 cell line containing luciferase from Gaussia princeps as reporter, rather than GFP. Gaussia luciferase (GLuc) catalyzes the oxidative carboxylation of coelenterazine, causing emission of photons, which can be detected in a luminescence plate reader. GADD45a-GLuc has a number of potential advantages over the GFP reporter, including reduced interference from autofluorescent test compounds, eliminating the need to test compounds in a second, control cell line. 12 TK6 GADD45a-GLuc cells form the basis of the BlueScreen HC 96-well assay, which Gentronix has shown to discriminate known genotoxic and nongenotoxic compounds with similar accuracy to GreenScreen HC. 12 The bright flash luminescence of the GLuc reaction, and use of a nucleic acid stain (thiazole orange) rather than turbidity to determine cell number, make BlueScreen HC amenable to miniaturization. Here, we describe a 384-well version of the BlueScreen HC assay (BlueScreen-384), which is adopted to detect the genotoxic hazard potential during the hit-to-lead and lead-to-candidate phases of drug discovery. BlueScreen-384 is fully integrated alongside other compound profiling assays generating structure-activity relationship (SAR) information. As a case study, we describe use of BlueScreen-384 data to prioritize compounds with minimized genotoxic hazard potential for further progression, by a project developing novel kinase inhibitors.
Materials and Methods
Materials
Heat-inactivated horse serum, 100× glutamax, RPMI 1640, sodium pyruvate, and hygromycin B were obtained from Invitrogen (Paisley, UK). 4-Nitroquinoline 1-oxide (NQO), methotrexate (MTX), DMSO, and Breathe-Easy sealing membrane were obtained from Sigma (Dorset, UK). Gentronix Ltd (Manchester, UK) supplied the assay media, assay media supplement, thiazole orange, luminescence reagent (coelentrazine), luminescence buffer, and cell lysis buffer.
BlueScreen-384 Assay
Human lymphoblastoid TK6 suspension cells stably expressing Gaussia luciferase under the control of the GADD45a gene promoter region (Gentronix Ltd) were maintained in growth media (RPMI 1640 supplemented with sodium pyruvate [1.8 mM], hygromycin B [200 µg/mL], heat-inactivated horse serum [10% v/v], glutamax [1×]) at 37 °C, 5% CO2 on the SelecT cell culture robot (TAP Biosystems, Royston, UK). Cells were seeded at variable density to ensure logarithmically-growing cells on day 1 of assay (1.5 × 10⁴ cells/mL 4 days prior to assay to 5 ×10⁵ cells/mL 1 day prior to assay). Compounds were dissolved at 10 mM in 100% DMSO and serially diluted twofold in the same solvent to provide 11 concentrations (10 mM to 10 µM). Compound solution or 100% DMSO was transferred to Greiner black, clear-bottom 384-well microplates (0.5 µL/well), and controls were added to define positive and negative responses in the assay (column 6: 100% DMSO; column 18: 100% DMSO and MTX in alternate wells). On the day of assay, cells were counted (Cedex; Roche Diagnostic, Burgess Hill, UK) and the assay performed only if the cell density was between 0.5 and 1.2 × 10⁶ cells/mL. Cells were harvested and resuspended in assay media (1 part assay media supplement, 5 parts assay medium, 6 parts sterile water) at 106 cells/mL. Assay media (column 6) or cell suspension (other columns) was added to compound plates (Multidrop Combi, Thermo Fisher; 50 µL/well). Plates were sealed using Breathe-Easy membrane, incubated (37 °C, 5% CO2) for 48 ± 2 h, then allowed to equilibrate to room temperature. Buffered coelentrazine (2200 parts luminescence buffer, 1 part luminescence reagent) and thiazole orange mix (200 parts cell lysis buffer, 1 part thiazole orange DNA stain) were prepared and stored protected from light until use. 12 GLuc flash luminescence was captured on addition of buffered coelentrazine (20 µL/well), using a Lumilux plate imager (Perkin Elmer, Cambs, UK), after removal of seals. Thiazole orange mix (Multidrop Combi; 20 µL/well) was then added and plates incubated for 20 min at room temperature and protected from light. Fluorescence was then measured on an Envision plate reader (Perkin Elmer) using standard fluorescein (FITC) filters with excitation at 485 nm and emission at 535 nm.
Data Processing and Analysis
Data were analyzed within ActivityBase Suite v7.4 (ID Business Solutions Ltd, Guildford, UK). This automated analysis system reconciles the raw data with compound details via a software-assigned plate barcode, which is associated with compound identity and concentration information to allow correct analysis. The luminescence and fluorescence data were handled simultaneously within one template. Raw data were normalized to low and high controls on each plate. For luminescence (GADD45a-GLuc induction), 0% was defined from cells treated with vehicle (DMSO) and 100% activity from cells treated with 20 µM methotrexate. For thiazole orange fluorescence (cytotoxicity), the no-cell control defined 100% effect and DMSO-treated cells defined 0% effect. Z′ values for luminescence and fluorescence were calculated for each plate after exclusion of statistically defined extreme outliers. 13 Compound activity in the assays was reported as pMEC (negative log of the minimum effective concentration) using a pMEC threshold of 25% to define positive activity for both luminescence and fluorescence.
Assessment of Kinase Inhibition
A polyHis- and TEV protease recognition site-tagged version of the full-length kinase was expressed in Spodoptera Sf9 cells by baculovirus-mediated transduction (pFastBacHTa, Invitrogen, Carlsbad, CA). Cell were lysed (50 mM sodium phosphate, 0.1 M sodium chloride, 10 mM imidazole, 1% NP40, 5% glycerol, 10 mM β-mercaptoethanol, 1 mM phenylmethanesulfonyl fluoride, pH 7.2) by homogenization in an M-110Y microfluidizer (Microfluidics, Newton, MA) and clarified by centrifugation. HisTEV-kinase protein was purified on an Ni-NTA Superflow column (Qiagen, Alameda, CA) followed by Superdex 200 gel filtration chromatography. Protein identity, purity, and concentration were determined by a combination of gel electrophoresis, LC-MS, peptide mass-mapping, and Bradford assay. Aliquots were stored in 50 mM Tris, 0.15 M NaCl, 0.05% Triton X100, 0.5 mM EDTA, 5% glycerol, and 2 mM DTT at pH 7.5 under liquid nitrogen. Assays for kinase activity used the ADP-Glo kit (Promega, Madison, WI) according to the manufacturer’s instructions, in Greiner 384-well low-volume white microplates using a synthetic peptide from a known substrate protein. Final reaction conditions were 40 mM Tris-HCl, pH 7.5, 20 mM MgCl2, 0.002% Tween-20, 1 mM DTT, 1.5 nM kinase, 40 µM substrate peptide, and 40 µM ATP (substrate peptide and ATP concentrations were approximately 0.1 Km). Luminescence was measured using a Viewlux plate reader (Perkin Elmer) and pIC50 values calculated within ActivityBase Suite. Tanimoto similarity scores were calculated using Daylight Fingerprints (http://www.daylight.com/dayhtml/doc/theory/theory.finger.html) and the Tanimoto Metric, that is, similarity = number of common fingerprints between A and B (A intersection B) divided by total number of distinct fingerprints of A and B (A union B). 14
Bacterial Mutagenicity (Ames) Test
The bacterial reverse mutation (Ames) test was performed essentially as described previously 15 and according to current methodology. Briefly, the test was conducted by the standard plate incorporation method using S typhimurium strain TA98 (UK National Collection of Type Cultures) in the absence of S9-mix. All test articles were dissolved in DMSO. All tests included four solvent controls, two positive controls as appropriate for each strain, 16 and two plates for each test article concentration level. For each treatment, top agar was supplemented with trace amounts of histidine, biotin, and tryptophan and aliquoted (2 mL) before adding 100 µL of the required test article, vehicle, or positive control (at an appropriate concentration), followed by 100 µL of bacterial suspension and 500 µL of phosphate buffer solution. The final mixture was poured over Vögel Bonner plates. The plates were then inverted and incubated for approximately 72 h at 37 °C (±1 °C) in the dark before scoring for revertant colonies. Plates were analyzed electronically for bacterial colony formation using a Sorcerer image analysis system (Perceptive Instruments Ltd, Haverhill, UK). The maximum concentration analyzed for each test article was limited to 5000 µg per plate or the first precipitating concentration or toxicity, whichever was lower. If the number of revertant colonies for any treatment level shows a response ≥2 times the concurrent vehicle control value in conjunction with a dose-related response, the result was considered positive.
Results
Adaptation of the Gentronix BlueScreen HC Protocol to 384-Well Format
We set out to adapt the 96-well BlueScreen HC protocol described by Gentronix 12 to 384-microwell format to be consistent with other biological assays run in support of chemical lead optimization. We tested whether induction of the GADD45a-Gaussia luciferase (GADD45a-GLuc) reporter in TK6 cells 12 was detected using a 384-well compatible luminometer. Lumilux (Perkin Elmer, Cambridge, UK) permits concurrent detection of flash luminescence from all wells of a 384-well microplate with integrated liquid handling. This apparatus is in routine use for apoaequorin-based measurement of intracellular calcium concentration, typically following activation of heterologously expressed G-protein–coupled receptors or ion channels. 17 For the BlueScreen-384 assay, conditions were identical to those described for the BlueScreen HC 96-well protocol, 12 except volumes were scaled to 50 µL/well. Concentration-dependent induction of GADD45a-luciferase of three- to fourfold over basal was detected in TK6 cells treated with known genotoxins NQO, acridine orange (ACO), and MTX, after integrated addition of the flash luminescence substrate ( Fig. 1 ). NQO and MTX activate GADD45a-GFP in the GreenScreen HC assay and also give positive results in alternative genotoxicity assays.6,9 Optimal cell density in the BlueScreen-384 protocol was 106 cells/mL (data not shown), the same as described for the BlueScreen HC 96-well protocol. 12 BlueScreen HC involves cell lysis after the flash luminescence read and addition of thiazole orange to stain DNA and permit a fluorescence measurement to estimate cell number. 12 For the 384-well protocol, we also included cell lysis and thiazole orange treatment steps and compared data gathered on fluorescence plate-reading devices. The Envision (Perkin Elmer) apparatus was considered optimal, based on minimizing the coefficient of variation across plates containing 196 wells of vehicle-treated cells and 196 wells of 20 µM NQO-treated cells (data not shown). Figure 1 shows luminescent and fluorescent data collected from the same plates, using the optimized BlueScreen-384 protocol. Nongenotoxic cytotoxicants cause a concentration-dependent decrease in thiazole orange fluorescence without inducing GADD45a-GLuc, as illustrated for phenformin ( Fig. 1 ).
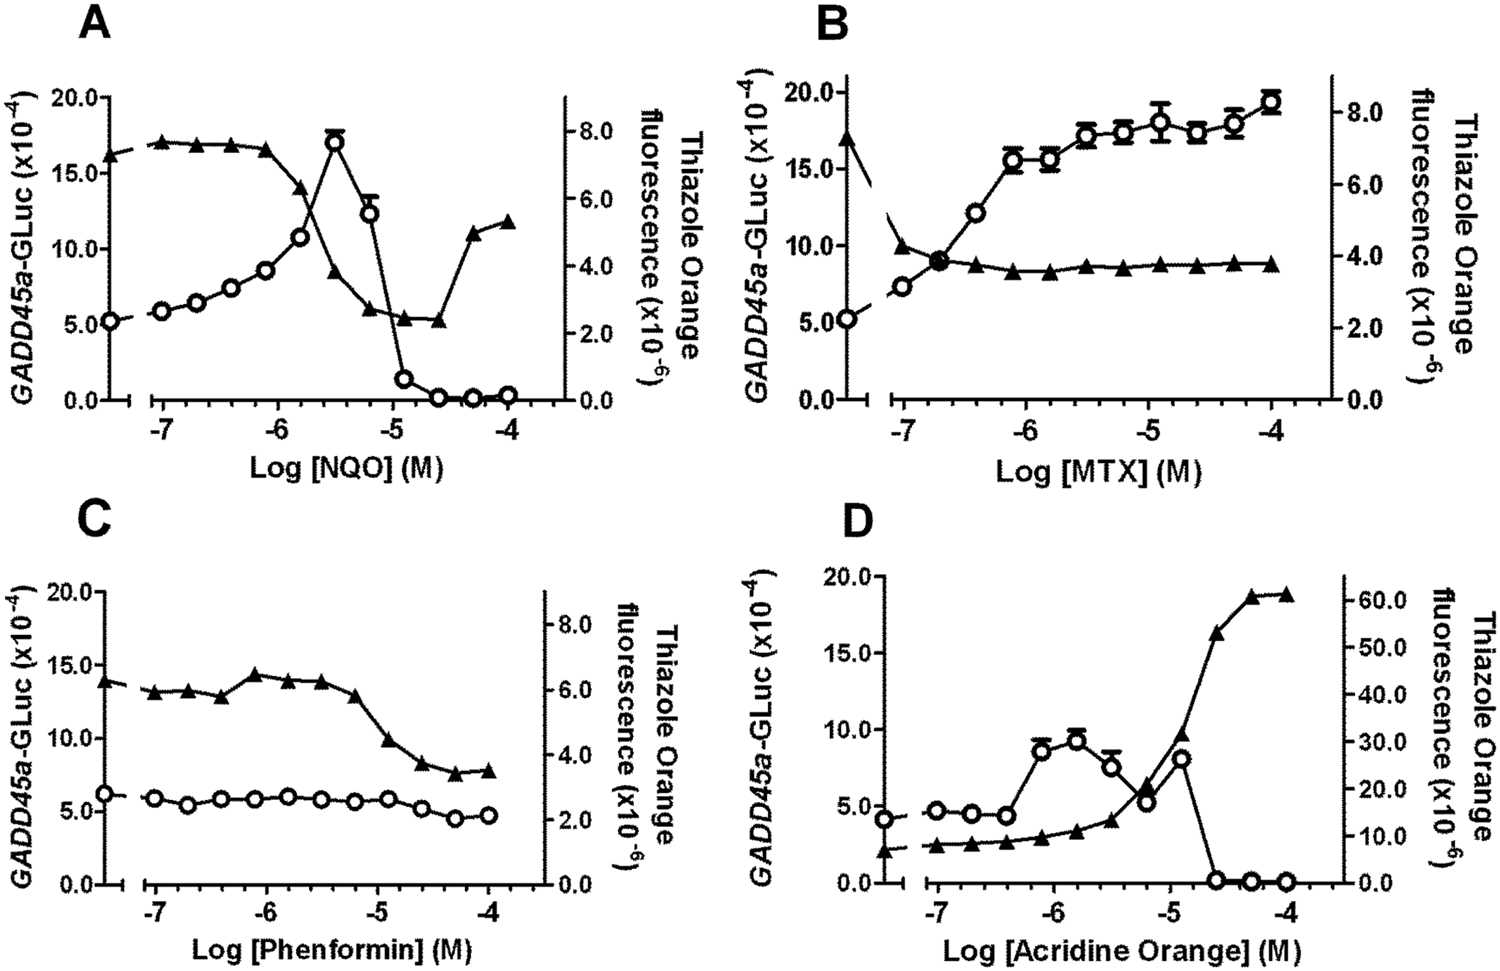
Induction of the GADD45a-GLuc reporter gene by genotoxins and cytotoxins. Human lymphoblastoid TK6 cells stably transfected with GADD45a-GLuc reporter were incubated in 384-well microplates with (
Reproducibility of the BlueScreen-384 protocol
Biphasic induction of GADD45a by NQO has been described previously from the GreenScreen HC assay 6 and is likely related to cytotoxicity observed at higher concentrations ( Fig. 1 ). Because similar curve shapes are observed for some test compounds (data not shown), it is not appropriate to fit GADD45a induction data to a four-parameter sigmoidal model. As an alternative, we quantified the maximum GADD45a-GLuc induction at any of 11 concentrations tested (10−4 to 10−7 M; twofold dilutions). Maximum GADD45a-GLuc induction for 115 compounds including known genotoxins and nongenotoxins, as well as unknowns (i.e., compounds not previously tested in any genotoxicity assay) correlated closely across separate experiment occasions, giving a correlation coefficient of 0.84 ( Fig. 2 ). This confirms the reproducibility of the BlueScreen-384 protocol.
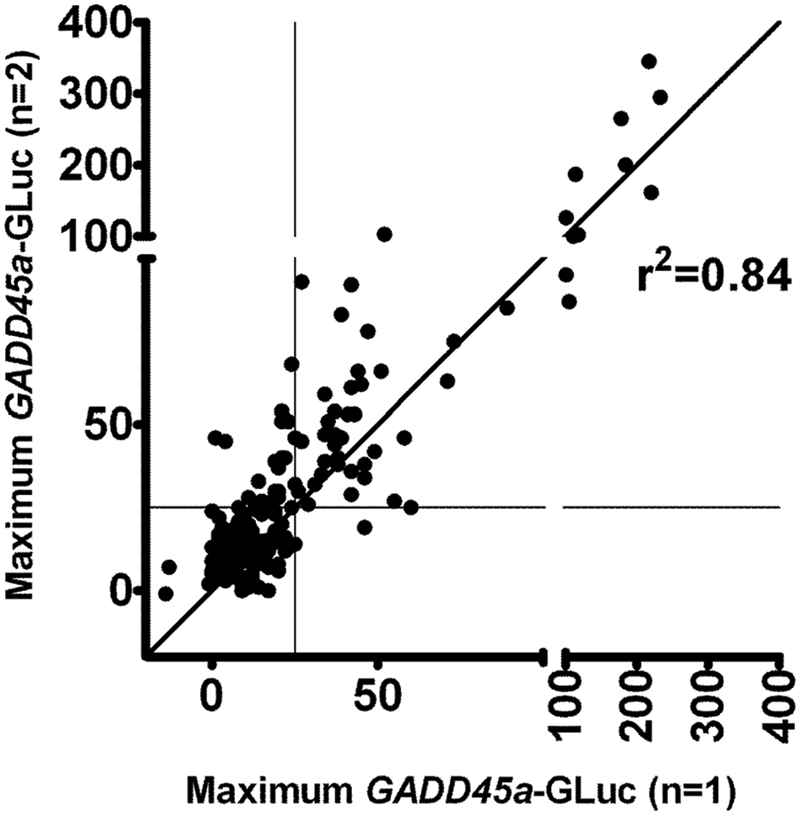
BlueScreen-384 reproducibility. Correlation of maximum GADD45a-GLuc induction for 183 compounds tested on separate experiment occasions. Compounds included known genotoxic and nongenotoxic agents (see
Identification of Known Gentoxins Using the BlueScreen-384 Assay
In the GreenScreen HC and BlueScreen HC 96-well protocols described by Gentronix, primary GADD45a induction data are transformed by normalizing against cell number to give induction-per-cell (“brightness”). Thus, GADD45a-GFP fluorescence is normalized against cell number (A600) in the GreenScreen HC assay, 6 and GADD45a-GLuc luminescence is normalized against thiazole orange fluorescence for the BlueScreen HC assay. 12 In both assays, a threshold is defined statistically and verified as appropriate by reference to test data for known genotoxic and nongenotoxic compounds. We initially considered an equivalent method for the BlueScreen-384 protocol. However, we observed several compounds to cause increasing thiazole orange fluorescence with increasing concentration of test compound. In this instance, the ratiometric transformation to express results as brightness can be confounding, because in most cases we suspect this does not correspond to a true increase in cell number at increasing concentration of test compound. An extreme example of this was ACO, which is known to intercalate into DNA similar to thiazole orange 18 and which unsurprisingly exhibited substantial fluorescence at the excitation/emission wavelengths used for the thiazole orange fluorescence read ( Fig. 1 ). Nonetheless, ACO caused concentration-dependent increases in GADD45a-GLuc luminescence ( Fig. 1 ) and is known to cause genotoxicity in Drosophila. 19 More paradoxically, NQO was also associated with increasing thiazole orange fluorescence at the highest concentrations tested (50 and 100 µM; Fig. 1 ) even though a sigmoidal, concentration-dependent decrease in thiazole orange fluorescence was observed up to 25 µM. This decrease is expected because genetic damage is likely to result in cytotoxicity. Mixtures of NQO with assay media in the absence of cells were subjected to lysis and thiazole orange treatment but did not show increased fluorescence at 50 and 100 µM (data not shown), suggesting this effect is not due to direct NQO fluorescence or interaction of NQO with thiazole orange but may be due to NQO-induced cellular autofluorescence or precipitation over the 48 h assay time course.
The evidence that thiazole orange fluorescence was not a consistently accurate measure of cell number in this 384-well version of the assay led us to investigate whether a threshold set on absolute GADD45a-GLuc induction, without incorporation of thiazole orange fluorescence by ratiometric transformation to brightness, could differentiate genotoxic and nongenotoxic compounds with adequate selectivity and specificity. Visual inspection of scatter plots (
Fig. 2
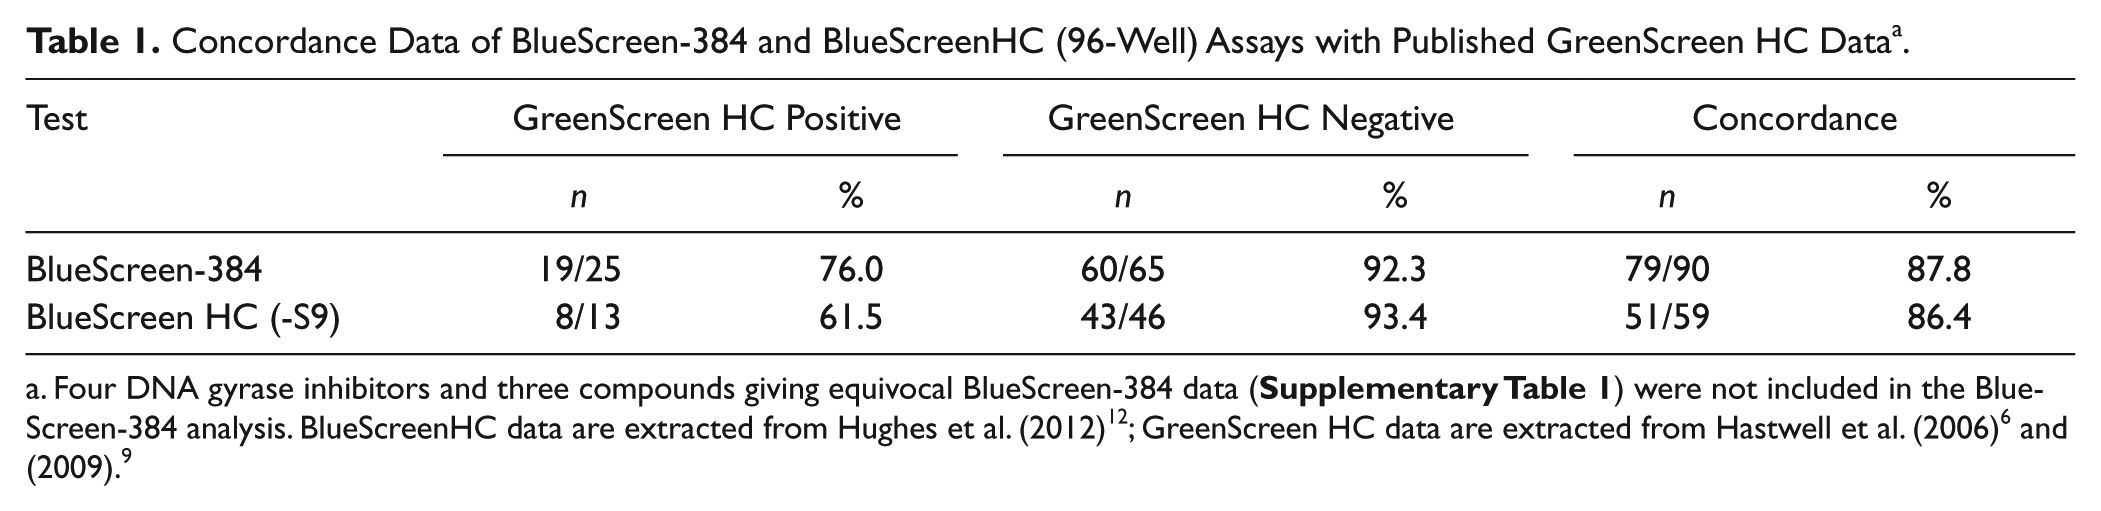
) indicated that a threshold of 25% normalized GADD45a-GLuc induction should minimize false-positives. To support this, we compared the 25% threshold to the variance of GADD45a-GLuc induction of control cells. Across 10 independent experiments, the 25% threshold was consistently greater than a notional 3SD threshold. On average, the 25% threshold was 14 standard deviations away from the mean luminescence of DMSO-treated cells (range, 5.8–23.4 SD; data not shown). A notional 3SD threshold would equate to an average cutoff of 7% GADD45a-GLuc induction. Therefore, the 25% threshold should not result in frequent false-positives due to random variation in the assay. BlueScreen-384 data were generated in duplicate in at least two separate experiments for a set of 97 compounds for which GreenScreen HC data were available. The lowest tested concentration of compound causing normalized GADD45a-GLuc induction to exceed the 25% threshold was recorded as minimum effective concentration (MEC). pMEC, the negative logarithm of MEC, is presented in
Concordance Data of BlueScreen-384 and BlueScreenHC (96-Well) Assays with Published GreenScreen HC Data a .
BlueScreen-384 Assay Robustness
Other biological assays run in support of chemical lead optimization use Z′ 20 with exclusion of statistically defined extreme outliers (i.e., robust Z′ 13 ) to track assay performance across independent occasions. This is typically used as a plate acceptance criterion, such that data from microplates where the robust Z′ falls below a preset threshold is disregarded. We tracked robust Z′, pMEC of standard compounds, and signal:background ratios of GADD45a-GLuc induction on 70 tested plates across nine separate BlueScreen-384 experiment occasions. The mean robust Z′ was 0.66 ± 0.11 (mean ± SD), and no plates were rejected ( Fig. 3A ). At least four dilution series of MTX and NQO were included alongside test compounds in each experiment. For MTX, all pMEC values were within twofold (one dilution factor) above or below the median pMEC ( Fig. 3D ). For NQO, this was also true except for one concentration-response curve for which the pMEC was two dilution factors (i.e., fourfold) less than the median pMEC ( Fig. 3C ). The signal:background ratio was 3.5 ± 0.70 (mean ± SD; Fig. 3B ). Some variability in this ratio was observed, which may be partly explained by the differing extent of cell passage, but even in experiments where the signal:background ratio was at the lower end of the range (approximately 2.5-fold), robust Z′ did not appear to be reduced ( Fig. 3 ). Finally, we compared pMEC values of compounds tested on independent experiment occasions and observed acceptable correlation (data not shown). Thiazole orange fluorescence data were analyzed by a method similar to that used for GADD45a-GLuc induction, except that data were normalized between controls of DMSO-treated cells (100% thiazole orange fluorescence) and wells lacking cells but otherwise treated identically (0% thiazole orange fluorescence). For compounds causing a >25% decrease in thiazole orange fluorescence across this scale, the pMEC exceeding this threshold was recorded. Robust Z′, pMEC of standard compounds, and signal:background ratios were tracked for thiazole orange fluorescence on the same BlueScreen-384 experiment occasions as above and deemed acceptable, although these parameters were not used as plate acceptance criteria (data not shown). Parallel capture of GADD45a-GLuc luminescence and thiazole orange fluorescence allowed visual inspection for compounds causing concomitant GADD45a-GLuc induction and inhibition of cell growth.
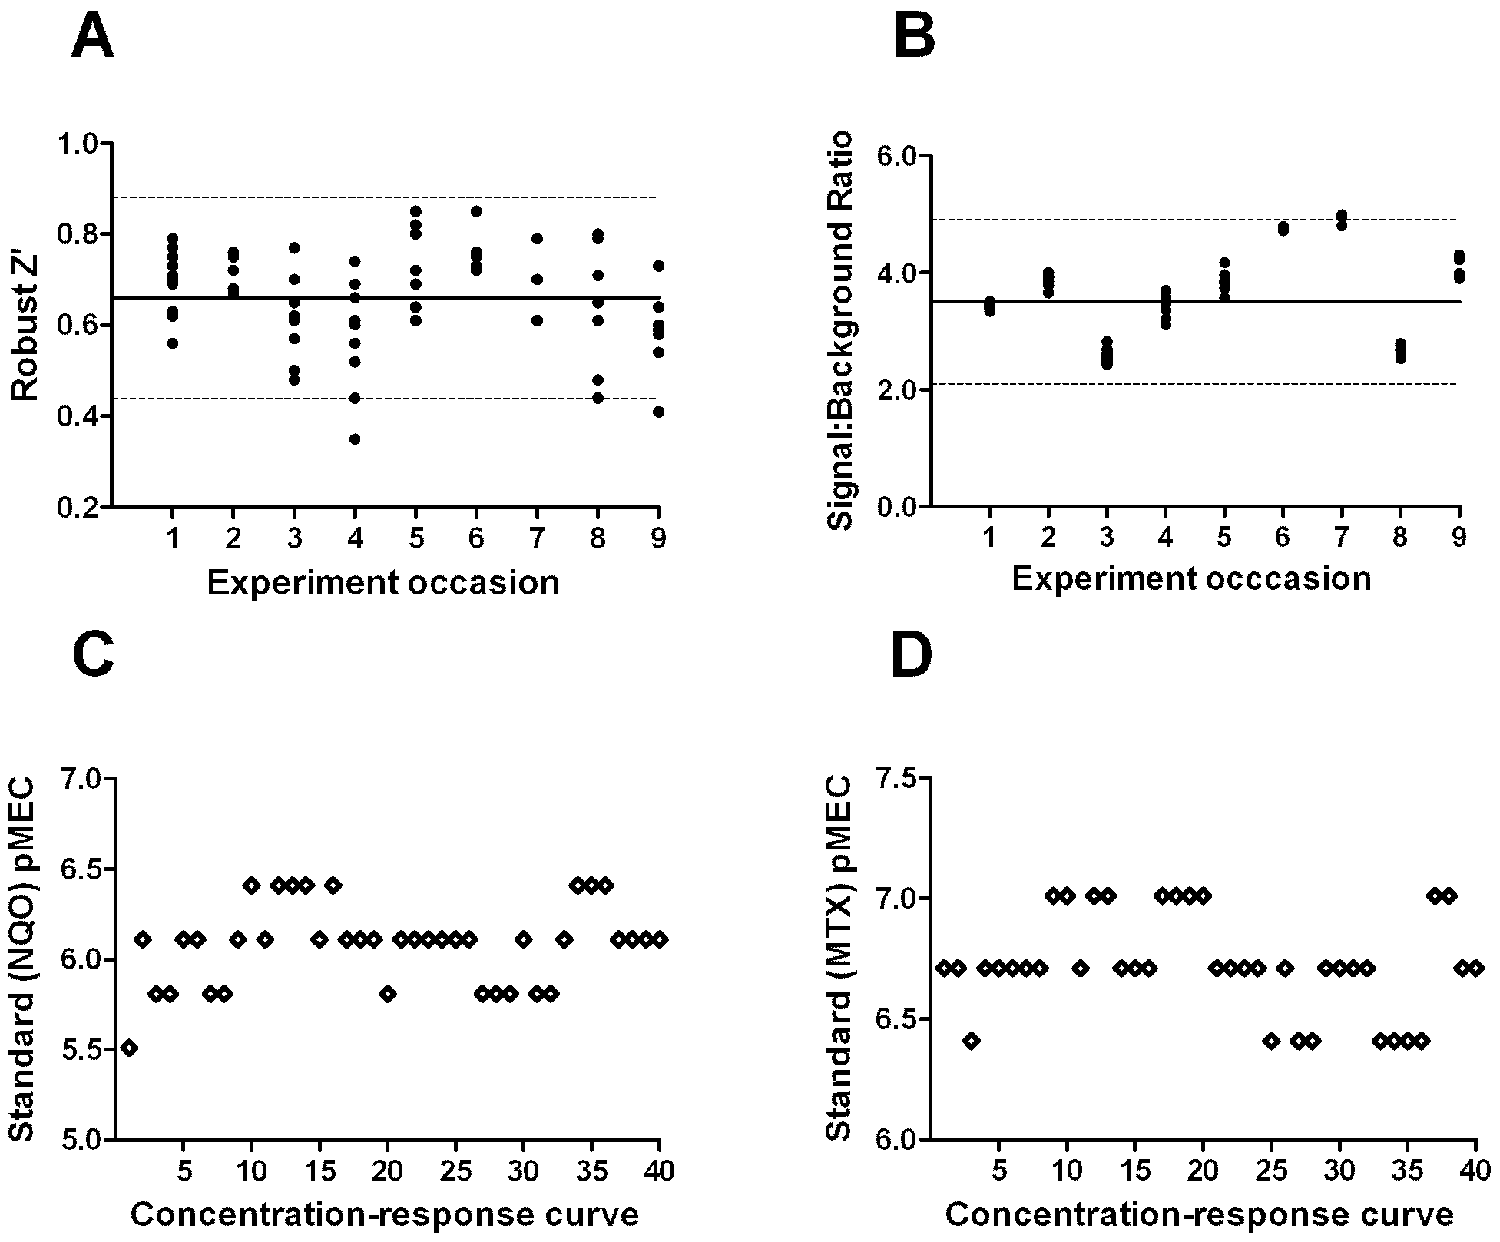
BlueScreen-384 robustness over time. (
Genotoxicity SAR
We have established BlueScreen-384 as a robust and reproducible assay for induction of the GADD45a promoter, which differentiates known genotoxins and nongenotoxins with acceptable sensitivity and specificity. BlueScreen-384 can be used in the context of drug discovery campaigns to optimize new drug chemotypes and achieve potency at a desired therapeutic target while minimizing undesirable genotoxicity. To illustrate this, we present data for a kinase primary target, in which a lead compound was identified in a high-throughput screening campaign with the intent of developing a clinical candidate compound for evaluation as a treatment of autoimmune disease. The original lead (compound 13 in Figs. 4 and 5 ) had a pIC50 = 8.3 at the kinase primary target and an attractive selectivity profile (data not shown) but induced GADD45a-GLuc in the BlueScreen-384 assay (median pMEC = 4.7). An accelerated Ames test was performed on compound 13, which confirmed its mutagenic activity ( Fig. 5 ). This property is unlikely to be acceptable as a clinical candidate for treatment of a chronic disease; therefore, an array of structural analogues was tested in the BlueScreen-384 assay ( Fig. 4 ). All of these analogues are considered members of the same chemical series and have Tanimoto similarity scores that range across the set from 98% to 52%, in comparison to compound 13. Some analogues had reduced GADD45a-GLuc–inducing activity but also significantly reduced kinase activity (e.g., compounds 29 and 44 in Fig. 4 ). Assessment of BlueScreen-384 and kinase activity across the whole series highlighted exemplars that combined low GADD45a-GLuc–inducing activity with high activity at the kinase primary target and allowed prioritization of compounds for further progression ( Fig. 4 ). For example, compound 30 is inactive in BlueScreen-384, causing a mean maximum GADD45a-GLuc induction of 19.5%, but it has a kinase pIC50 = 8.3. Compound 30 was also taken into an accelerated Ames test and was inactive, consistent with the BlueScreen-384 result ( Fig. 5 ). Hence, compound 30 had desirable properties for progression into clinical development. The absence of any clear correlation between BlueScreen-384 and primary target kinase activities across this chemical series further suggests kinase inhibition and GADD45a induction are not linked, as might be the case if inhibition of this kinase directly caused cellular genotoxic damage.
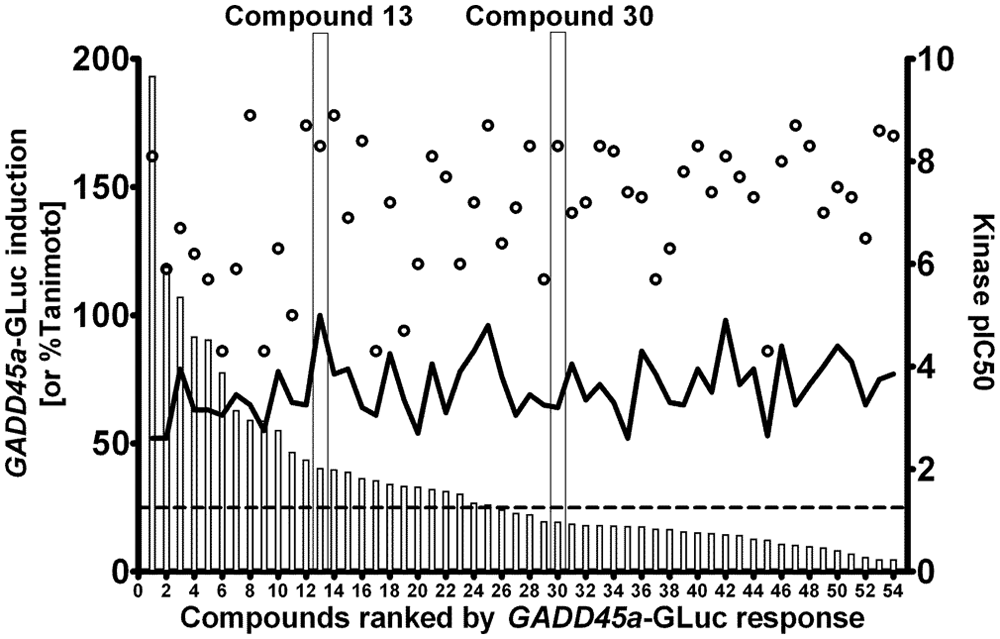
Divergent structure-activity relationship between BlueScreen-384 and a kinase primary target across a single chemical series. A drug discovery project aiming to develop treatments for anti-inflammatory disease synthesized 53 analogues in the same chemotype as the original lead (compound 13) and tested them against both the intended therapeutic target and in the BlueScreen-384 assay. Data are presented as mean kinase pIC50 (open circles; right axis) and mean maximum GADD45a-GLuc induction (bars; left axis) calculated as above, each from a minimum of two independent determinations. The GADD45a-GLuc threshold (25%) is shown (dashed line). Tanimoto similarity compared to compound 13 varied across this series from 98% to 52%, and is shown for each compound (black ribbon; right axis). Ranking by maximum GADD45a-GLuc luminescence allowed prioritization for progression. Compounds 13 and 30, which were profiled in the Ames test, are boxed.
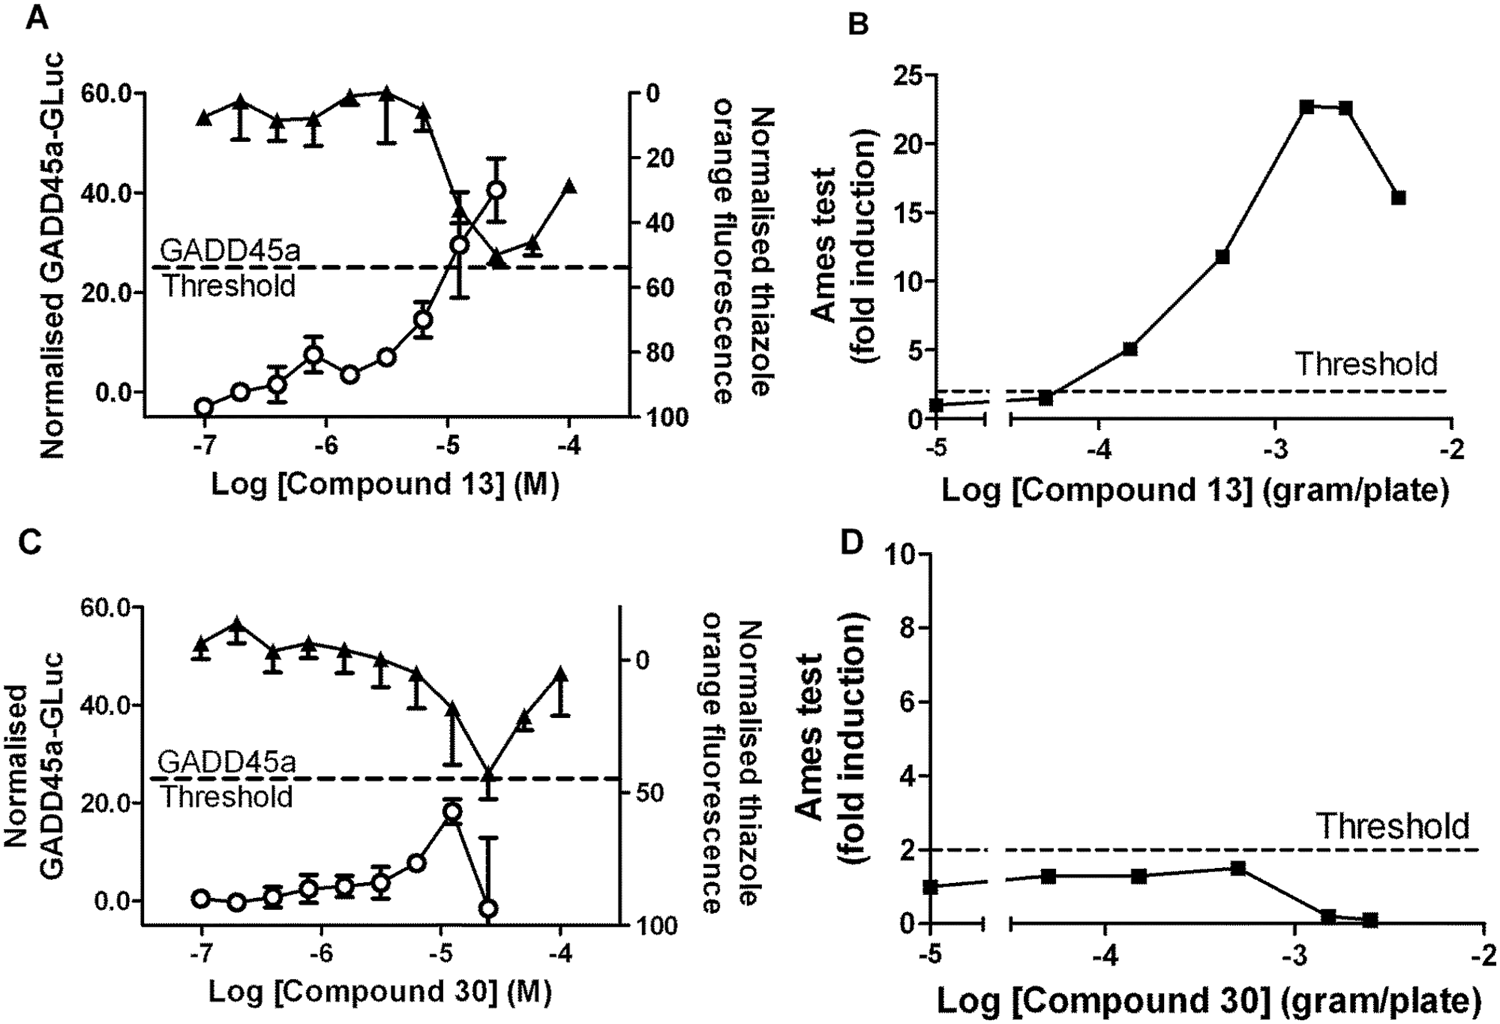
Comparison of BlueScreen-384 and bacterial mutation (Ames) data for selected kinase inhibitors. Exemplars from a chemical lead series synthesized by a discovery project developing inhibitors of a kinase primary target were tested. BlueScreen-384 data (
Discussion
We set out to develop an assay for induction of the mammalian GADD45a genotoxicity checkpoint that was fully integrated alongside other high-throughput compound-profiling assays performed in support of drug discovery programs. The requirements for such an assay were that it should use a 384-microwell plate format and available reader technologies, it should source from 10 mM stock solutions in DMSO and test over a common concentration range for all compounds, it should meet accepted criteria for reproducibility and robustness parameters, and it should allow facile data analysis with commonly used software tools. We describe the BlueScreen-384 assay, which meets these criteria. Bluescreen-384 is a modification of the 96-well BlueScreen HC protocol 12 and uses human TK6 GADD45a-GLuc reporter cells under license from Gentronix. Features of the Gaussia luciferase (GLuc) protein influencing its selection as a next-generation reporter for measurement of GADD45a have been discussed previously. 12 In particular, GLuc is secreted and has a long (>24 h) half-life 21 and hence accumulates over the 48 h time-course of the assay. Also, the intensity of light emission is greater than other luciferases. Together these properties permit assay miniaturization by conferring a robust signal-to-background window even with reduced cell number in a 384-microplate well. In contrast, the original GADD45a-GFP reporter in the 96-well GreenScreen HC assay had signal-to-background approximately twofold lower than GADD45a-GLuc under equivalent conditions 12 and may have been challenging to adapt into 384-well format.
We relied on the comparison to GreenScreen HC data to judge the acceptability of the BlueScreen-384 protocol. This was because GreenScreen HC has been thoroughly validated with known genotoxins and nongenotoxins as well as marketed pharmaceuticals and by different laboratories. Also, we have substantial internal experience in implementing GreenScreen HC to support early drug discovery. BlueScreen-384 gave the same “call” (i.e., whether a compound was predicted to be genotoxic or nongenotoxic) for 84.9% of compounds in our validation set. False-positive and -negative rates were 5.4% and 6.4%, respectively. Some of these differences may have arisen from the method of preparing compounds by dissolution and serial dilution in 100% DMSO. For example, cisplatin is reportedly unstable in DMSO, 22 although this molecule was active in the BlueScreen-384 protocol. However, in validating BlueScreen-384, we sought to reproduce the same conditions and treatment to which new chemical entities would be subject in routine screening.
Overall, reproducibility, robustness, and consistency of BlueScreen-384 were deemed acceptable to support implementation as a routine screening assay. The comparison to GreenScreen HC nonetheless highlighted caveats and limitations of the approach. DNA gyrase inhibitors were excluded from the comparison because they require high concentrations to elicit GADD45a induction 9 and, at compound concentrations routinely tested, BlueScreen-384 is not expected to detect the activity of known gyrase inhibitors. Secondly, the false-positive rate is low but not negligible, and therefore new chemical entities found to be active in BlueScreen-384 should not be discontinued in drug development solely on the basis of this property. Rather, a combination of analogue testing, predictive in silico tools such as Derek for Windows, 23 consideration of sample purity, and other in vitro genotoxicity tests are recommended to further investigate an initial observation of BlueScreen-384 activity. We illustrate this in a case study of a kinase primary target in which initial leads were found to be active in BlueScreen-384 and, subsequently, in the Ames test ( Figs. 4 and 5 ). Similar to many of the available in vitro assays predictive of adverse drug reactions (see, for example, O’Brien et al. 24 ), BlueScreen-384 data must be considered in the context of an overall activity profile in deciding whether to continue development of a new chemical entity. This profile should include primary and selectivity targets, disease indication and route of dosing, and measured or predicted pharmacokinetic parameters. Several in vitro assays for safety prediction are reliant on reporter gene assays, including BlueScreen/GreenScreen, but also assays for activation of the aryl hydrocarbon receptor, AhR, and pregnane-X receptor, PXR. 25 These may offer particular challenges in interpretation to discovery projects seeking to develop lead compounds with an epigenetic mechanism of action, because of the possibility of a direct action on expression regulatory sequences.
Both GreenScreen and BlueScreen HC protocols involve a ratiometric transformation in which absolute GADD45a-GFP or GADD45a-GLuc induction is divided by a measure of cell density to give induction per cell or “brightness”, with the threshold to define actives set around this parameter. We investigated a similar method for analyzing BlueScreen-384 data, and although we achieved acceptable performance, we encountered several drawbacks. Compounds that were intrinsically fluorescent or that induced fluorescence in the assay mixture had confounding effects and in some cases tended to mask activity of known genotoxins. Furthermore, for some compounds, this ratiometric transformation introduced additional noise, because of variability in the extent of cytotoxicity between independent concentration-response curves (data not shown). This method of data analysis required manual manipulation of data in custom templates and hence did not meet our criterion of using software tools common to other compound-profiling assays. Here, we describe an alternative method, which is to define “actives” predicted to be genotoxic by applying a 25% threshold to absolute (normalized) GADD45a-GLuc luminescence. This method simplified data analysis and facilitated automated analysis and posting to internal databases using IDBS ActivityBase. Time required for data analysis and intervention during both data analysis and recording to databases was reduced, lessening the potential for human error. Hence, this is our preferred method for data analysis.
Any threshold assay is likely to encounter test compounds whose intrinsic activity is approximately equivalent to the threshold. Normal quantitative variation will cause such compounds to fall above and below the threshold upon replication of the protocol. For BlueScreen-384, this means that certain compounds are defined as active on some experiment occasions and inactive on others. Within the validation set, we observed 6-thioguanine to cause maximum GADD45a-GLuc induction of 21%, 25%, 27%, and 40% across four concentration-response curves. Overall, it was deemed active/genotoxic. Likewise, amphotericin B caused maximum GADD45-GLuc induction of 20%, 24%, 24%, and 28% and was deemed inactive/nongenotoxic. Thus, a key recommendation to project teams testing new chemical entities of interest is to increase replication and test compounds on separate cell passages in independent experiments (to minimum n = 4, because compounds are tested in duplicate in each experiment, and greater if compounds are equivocal after n = 4). In the BlueScreen-384 protocol, thiazole orange fluorescence data are also gathered, and compounds causing ≥25% reduction in fluorescence are assigned pMEC values. This allows visual inspection for instances in which cytotoxicity may have reduced GADD45a-GLuc induction to apparently subthreshold levels.
A key aspect of any genotoxicity test strategy is to identify promutagens requiring metabolic activation to manifest their toxic effect. Many in vitro genotoxicity assays, including the ICH battery, test compounds in the presence of a metabolic activation system, usually S9 post-mitochondrial fraction extracted from activated rat liver. Both GreenScreen HC11,26 and BlueScreen HC 12 have been adapted to allow measurement of GADD45a induction after treatment of TK6 cells with progenotoxins in the presence of S9. The GreenScreen HC +S9 protocol uses flow cytometry to overcome the fluorescent and light-absorbing properties of S9 extract, but the BlueScreen HC +S9 protocol allows in-plate detection by including wash steps after exposure to test compound and S9. Cytotoxicity of S9 extract limits cell exposure to about 3 h, 27 and the shorter incubation time means that higher concentrations of some genotoxins are required to activate GADD45a in reduced exposure duration +S9 protocols. For example, NQO has an MEC of 0.06 µg/mL in GreenScreen HC −S9 (48 h) but 1 µg/mL in GreenScreen HC +S9 (3 h). 11 The need to test compounds to higher concentrations is not insurmountable for the 96-well GreenScreen HC and BlueScreen HC assays, in which each compound can be tested over a separate concentration range and to the limit of its solubility. However, as testing of all compounds over a common concentration range (up to 100 µM) was a premise for development of the BlueScreen-384 assay, we have not sought to develop a +S9 version of the 384-well assay. BlueScreen-384 is used on the understanding of this limitation and in the context of a broader genotoxicity detection strategy in which promutagens are identified in a number of ways; some promutagens can be predicted from knowledge of metabolically labile chemical features, and all compounds tested in BlueScreen-384 are also submitted to Derek for Windows. 23 Suspected promutagens from this in silico prediction, or for any other reason, are then tested in an assay using a metabolic activation system (S9), which may be the 96-well GreenScreen/BlueScreen HC or may be an accelerated +S9 Ames test. Ultimately, all compounds destined for clinical development are tested in ICH battery tests with S9 irrespective of the BlueScreen-384 result. In this strategy, some promutagens will not be identified early in lead optimization, but none are taken into clinical development without robust assessment of genotoxicity in the presence and absence of metabolic activation. We have surveyed a total of 969 proprietary compounds tested in the Ames test within GlaxoSmithKline over a 10 y period. This set excluded known mutagens, synthetic intermediates, or compounds tested for purposes of validation. Of this set, 13.8% (134 compounds) were positive in the Ames test and 3.8% (37 compounds) were Ames-positive only in the presence of S9. Of these 37 S9-dependent Ames positives, eight were predicted by Derek for Windows 23 (P. Hastwell, unpublished data). Hence, we estimate that approximately 3% to 4% of compounds tested will be unpredictable activation-dependent genotoxins in the BlueScreen-384 assay.
As a case study, we describe a project seeking to develop kinase inhibitors as potential anti-inflammatory agents. This project tested more than 50 compounds in the BlueScreen-384 assay. This number would be unfeasible to test directly in the Ames test, which requires relatively large quantities of solid compound at relatively high levels of purity. However, by iteratively testing small numbers of novel kinase inhibitors in both BlueScreen-384 and Ames, the project demonstrated that some exemplars in their kinase inhibitor chemotype were associated with mutagenicity. Using BlueScreen-384 to develop SAR, the project was able to define chemical space with a desirable combination of kinase inhibition and lack of activity in Ames. Moreover, the high capacity of the BlueScreen-384 assay enabled routine testing of all new analogues in any chemotype synthesized on behalf of this project. BlueScreen-384 data were generated in parallel with, rather than subsequent to, testing at the primary kinase target, accelerating decision making within the project. Note that none of the examples from this chemical series that were active in BlueScreen-384 were predicted to be genotoxic in an in silico predictive model. 23 Accumulation of BlueScreen-384 data across diverse chemotypes may in the future facilitate development of further in silico models predictive of genotoxicity.
We have now co-opted BlueScreen-384 into our internal panel of more than 50 safety profiling assays, similar to those described by other pharmaceutical companies. 28 This panel includes molecular targets from diverse classes known to be associated with adverse clinical events (hERG, 5-HT2B, PDE3, etc.), as well as targets of interest to DMPK such as drug transporters and also phenotypic surrogate assays of toxicity. 24 The panel has the capacity to test chemical exemplars from all “hit” series identified through lead identification activities such as high-throughput screening. The inclusion of BlueScreen-384 in this panel allows any internal drug discovery project early warning of genotoxic potential, long before their compounds of interest would normally be tested in other in vitro genotoxicity assays.
Footnotes
Acknowledgements
We thank Thau Ho and Patrick McDevitt for expression and purification of the kinase, Jon-Paul Jaworski for assessment of kinase inhibitory activity, Subhas Chakravorty for calculation of Tanimoto similarity scores, Amy Lane and Sharon Robinson for assistance with the Ames test, Chris Hughes (Gentronix) for technical advice in establishing the BlueScreen assay, and Richard Walmsley (Gentronix), Anthony Lynch, and Stuart Baddeley for critical reading of the manuscript (all GSK, except where indicated).
Declaration of Conflicting Interests
The authors declared the following potential conflicts of interest with respect to the research, authorship, and/or publication of this article: Authors are employees of GlaxoSmithKline (K.S., P.H., P.E., P.S., and A.B.) or AstraZeneca (S.R.).
Funding
The authors received no financial support for the research, authorship, and/or publication of this article.
References
Supplementary Material
Please find the following supplemental material available below.
For Open Access articles published under a Creative Commons License, all supplemental material carries the same license as the article it is associated with.
For non-Open Access articles published, all supplemental material carries a non-exclusive license, and permission requests for re-use of supplemental material or any part of supplemental material shall be sent directly to the copyright owner as specified in the copyright notice associated with the article.