
Abstract
Exposure to genotoxic carcinogens leads to increased expression of the GADD45a gene in mammalian cells. This signature of genotoxic hazard has previously been exploited in the GreenScreen HC assay, in which GADD45a expression is linked to green fluorescent protein (GFP) expression in the human TK6 lymphoblastoid cell line. This article describes the development and validation of an alternative assay (“BlueScreen HC”), in which expression is linked to Gaussia luciferase (GLuc) expression, yielding a luminescent reporter, the preferred optical output in high-throughput screening. The coelentrazine substrate of GLuc is relatively unstable, and a new buffer is reported that improves its stability. A more sensitive method is demonstrated for the measurement of cell densities in the assay, using the fluorescent cyanine dye thiazole orange. A protocol amendment also allows the assessment of pro-genotoxicity using S9 liver extracts. Compounds from the European Centre for the Validation of Alternative Methods (ECVAM) recommended list for the assessment of new or improved genotoxicity assays were evaluated with and without S9 in the new assay. The new GLuc assay was as effective as the GFP assay in producing positive results for all classes of genotoxic carcinogen and negative results for all nongenotoxins tested.
Keywords
Introduction
Genotoxins cause genome alterations, including mutation and breakage or missegregation of chromosomes. These in turn can contribute to the development of cancers, as well as heritable changes to the germ cell genome. As a consequence, regulatory safety assessment requires in vitro and in vivo genotoxicity testing using a battery of tests for mutation, evidence of DNA breakage, or missegregation of chromosomes, to ensure that all classes of genotoxin are detected. 1 These regulatory ‘Good Laboratory Practice’ (GLP) assays are time-consuming and labor intensive and generally require gram quantities of test compound. These properties militate against their application in screening laboratories, so modified cut-down, nonregulatory versions of these tests have been developed (e.g., for the Ames test 2 ).
Historically, there has been an understandable emphasis on sensitivity in pharmaceutical safety assessment—ensuring that genotoxic liability is detected before the drug is given to humans. However, a consequence of this emphasis has been a neglect of specificity (i.e., ensuring that noncarcinogens produce true-negative results). Recent studies have found that the in vitro mammalian tests in particular produce positive results for a significant proportion of compounds that are not carcinogens.3,4 These have been variously referred to as “false,” “misleading,” or “irrelevant” positive results, and recent revisions to the test guidance for pharmaceuticals reflect concerted efforts to understand and minimize the generation of misleading results. The top testing dose has been reduced from 10 mM to 1 mM, and there is new advice regarding the choice of toxicity assessment methods, to avoid testing to extreme toxicities.1,5
During the development of new compounds, be they pharmaceuticals, pesticides, herbicides, flavors/fragrances, household chemicals, and so on, the in vitro genotoxicity tests provide the first indication of potential carcinogenic hazard. Challenges arise for compounds that generate conflicting test data, for example, negative for bacterial mutation (Ames test) but positive in an in vitro mammalian test (a “unique positive”). This is sufficiently common that many compound developers carry unique positives forward for in vivo testing and so avoid the disposal of misclassified, safe compounds. However, there is a regulatory requirement for additional in vivo test data in such cases, resulting in further expense and animal usage. Of course, not all unique positives are misleading: Some do indeed produce positive in vivo study data. This is unsurprising as the Ames test has been shown to detect only about 60% of carcinogens. 3 On the other hand, the cost associated with additional animal and other mechanistic investigations leads some developers to abandon unique positives. This strategy can result in the loss of potentially useful new drugs and the waste of the millions of dollars spent in bringing compounds to the candidate selection stage. It is for this reason that various groups have concluded that more accurate in vitro genotoxicity tests are required.5–7 If such tests could also be deployed at a much earlier stage in development, the proportion of compounds likely to succeed could be enriched. The UK Committee on Mutagenicity has recently recognized that the predominant use of high-throughput screening (HTS) tests is as an aid in prioritization of compounds for development undertaken by industry and agreed that the GADD45a–green fluorescent protein (GFP) assay is most suited as part of a battery of high-throughput screens. 8
The GADD45a-GFP assay uses a genetically engineered derivative of the p53-competent, human lymphoblastoid cell line TK6. 9 It has a high sensitivity (87%), detecting all classes of genotoxin: mutagens, promutagens, clastogens, and aneugens.9,10 Specificity is a key characteristic for screening, and the assay’s specificity (95%)9,10 is higher than those historically reported for Ames 3 (sensitivity 60.3%, specificity 77.3%), the Micronucleus Test (MNT: 3 80.9%, 53.8%), and the Mouse Lymphoma Assay (MLA 3 (80.8%, 47.6%). For more analytical studies, the GADD45a-GFP assay can be performed using a flow cytometry platform, which allows the detection of pro-genotoxins.11,12 Both versions are carried out in a 96-well microplate format, and their reproducibility and transferability have been demonstrated in international “ring” trials.13,14
GFP reporters enable the development of simple, reagent-free assays and, partly as a consequence of this, are more amenable to moderate-throughput screening applications than the earlier generation of antibiotic resistance and other enzyme-linked reporter genes. There are, however, some applications in which assay users are prepared to accept additional handling steps if a higher signal-to-noise ratio can be obtained. HTS is one such application where low volumes and cell numbers produce proportionally lower signal outputs, and it is here that assays using luciferase genes have become prevalent. 15 It is partly in response to HTS requirements that an alternative version of the GADD45a genotoxicity assay has been investigated, in which GFP is replaced by a luciferase gene. This required the choice of an appropriate luciferase gene, as well as the development and validation of a new assay protocol.
DNA reactive genotoxins, such as alkylating agents, can cause damage at any stage in the cell cycle, whereas other classes of genotoxins can have cell cycle–specific targets. Hence, the treatment of an unsynchronized population of cells with a cell cycle–specific genotoxin yields only a fraction of the population with a damage liability at any one time. To integrate effects in the whole population, exposure for at least a whole cell cycle is required. To capture the response to any event, regardless of where in the cell cycle it was initiated, a stable reporter protein is required. In addition, a stable reporter protein allows detection of genome damage caused by intrinsically unstable compounds or reactive metabolites generated by cellular metabolism. In either case, exposed cells carrying a relatively unstable reporter would require repeated sampling or kinetic measurement to identify all events. Although there are published examples of in vitro genotoxicity time course assays employing the firefly luciferase (FLuc) gene and its genetically engineered derivatives,16,17 the generation of a time course is not really convenient for screening applications. Although the half-life of the natural FLuc protein is 2 to 4 h, 18 the luciferase protein from the marine copepod Gaussia princeps (GLuc) persists for many days in culture medium. 19 There are other differences between the two proteins: The FLuc reaction results in light emission for a prolonged time period (a “glow”), whereas the GLuc reaction yields a more intense light emission over a much shorter period (a “flash”). For the latter, a microplate luminometer equipped with a reagent injector allows the assessment of the GLuc concentration within seconds of the addition of the light-emitting coelenterazine substrate.
In addition to their usefully high signal-to-noise ratio, the signal from luminescent reporters should be less susceptible than fluorescent reporters to interference from autofluorescent species. Some compounds fluoresce intensely at wavelengths overlapping those of GFP fluorescence, and in addition, the interaction of some compounds with the test environment and living cells can result in increased cellular autofluorescence. 20 Both of these events can further confound measurements from GFP reporters, but in the majority of instances, it is possible to either sufficiently control for the effects of this interference or retest using methods to distinguish reporter fluorescence from autofluorescence. These include exploiting fluorescence anisotropy or using flow cytometry.11,21 Although the application of fluorescence polarization methods is straightforward in HTS, retesting or invasive resampling via flow cytometry is not. In this article, we investigate how effectively a GLuc reporter can be used to analyze samples spiked with fluorescein. A final advantage of GLuc is that, unlike FLuc, it is naturally secreted from cells. 19 This allows follow-up kinetic studies to be performed to determine the persistence of the genotoxic hazard. Against these advantages, GLuc assays present their own issues. The exogenous coelenterazine substrate is readily soluble in alcohols but has relatively poor aqueous solubility. This can be increased by inclusion of hydroxypropyl-β-cyclodextrin. 22 Coelenterazine is also sensitive to oxidative degradation, 23 and previous authors have demonstrated that antioxidants, such as vitamin C, can increase its stability. 24 In this study, we demonstrate that control of pH effectively stabilizes the signal for the duration of data collection.
In the GADD45a-GFP assay, optical absorbance (cell density) data are collected to provide an estimation of cell growth or inhibition of growth. This yields a value against which to normalize the reporter signal and also provides a measure of cytotoxicity. 9 This approach is effective in 96-well microplate assays, but the sensitivity of the measurement becomes limiting in higher throughput formats, such as 384-well microplates. In this article, we demonstrate that the fluorescence of the nucleic acid–bound cyanine dye, thiazole orange (TO), provides a more sensitive estimation of cell density.
The results presented demonstrate the development of a robust GADD45a-GLuc genotoxicity assay, which reproduces the high specificity of the GADD45a-GFP assay and improves sensitivity to highly fluorescent test compounds. The assay also allows assessment of pro-genotoxicity in the presence of S9 without the need for flow cytometry.
Materials and Methods
Selection of Compounds
Sixty compounds from the list recommended by European Centre for the Validation of Alternative Methods (ECVAM) for the assessment of new or improved genotoxicity tests were evaluated ( Tables 1 – 3 ). 6 Ephedrine sulfate was not available for testing.
Comparative Results from the GADD45a-GFP and GLuc assays for In Vivo Genotoxins That Should Be Detected as Positive in the In Vitro Mammalian Cell Genotoxicity Tests
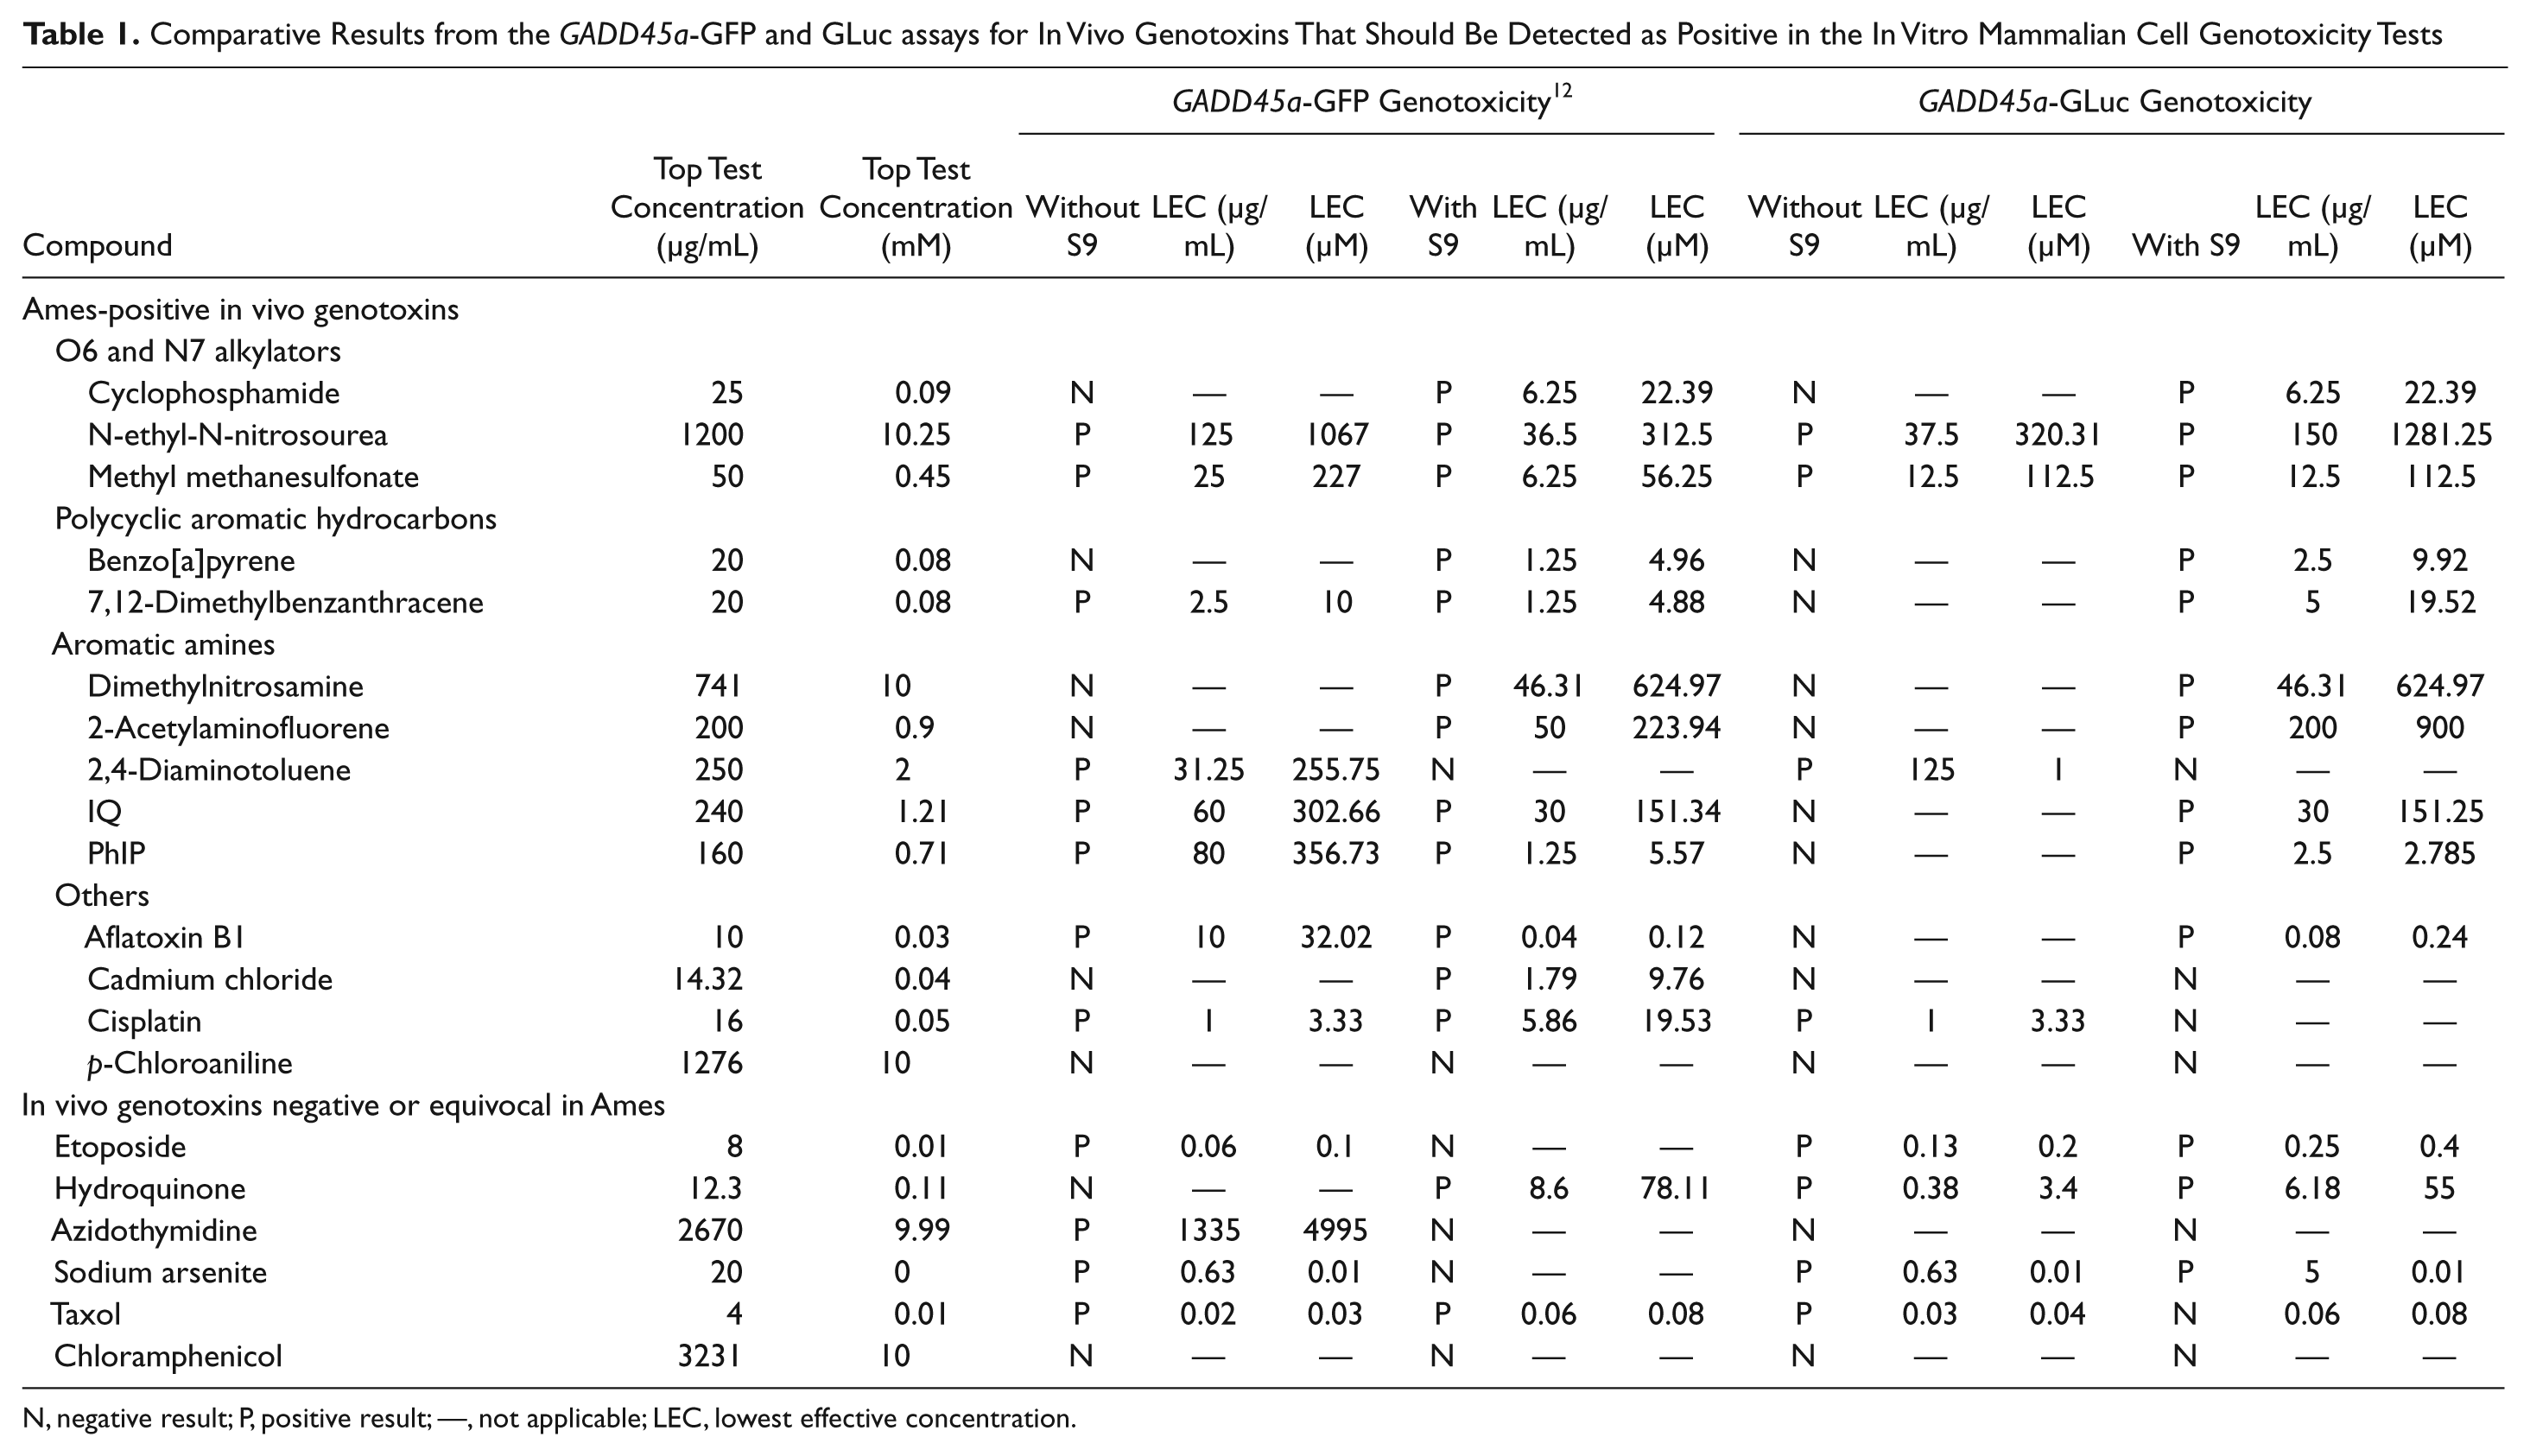
N, negative result; P, positive result; —, not applicable; LEC, lowest effective concentration.
Comparative results from the GADD45a-GFP and GLuc Assays for Non-DNA-Reactive Chemicals (Including Nongenotoxic Carcinogens) That Should Give Negative Results in the In Vitro Mammalian Cell Genotoxicity Tests
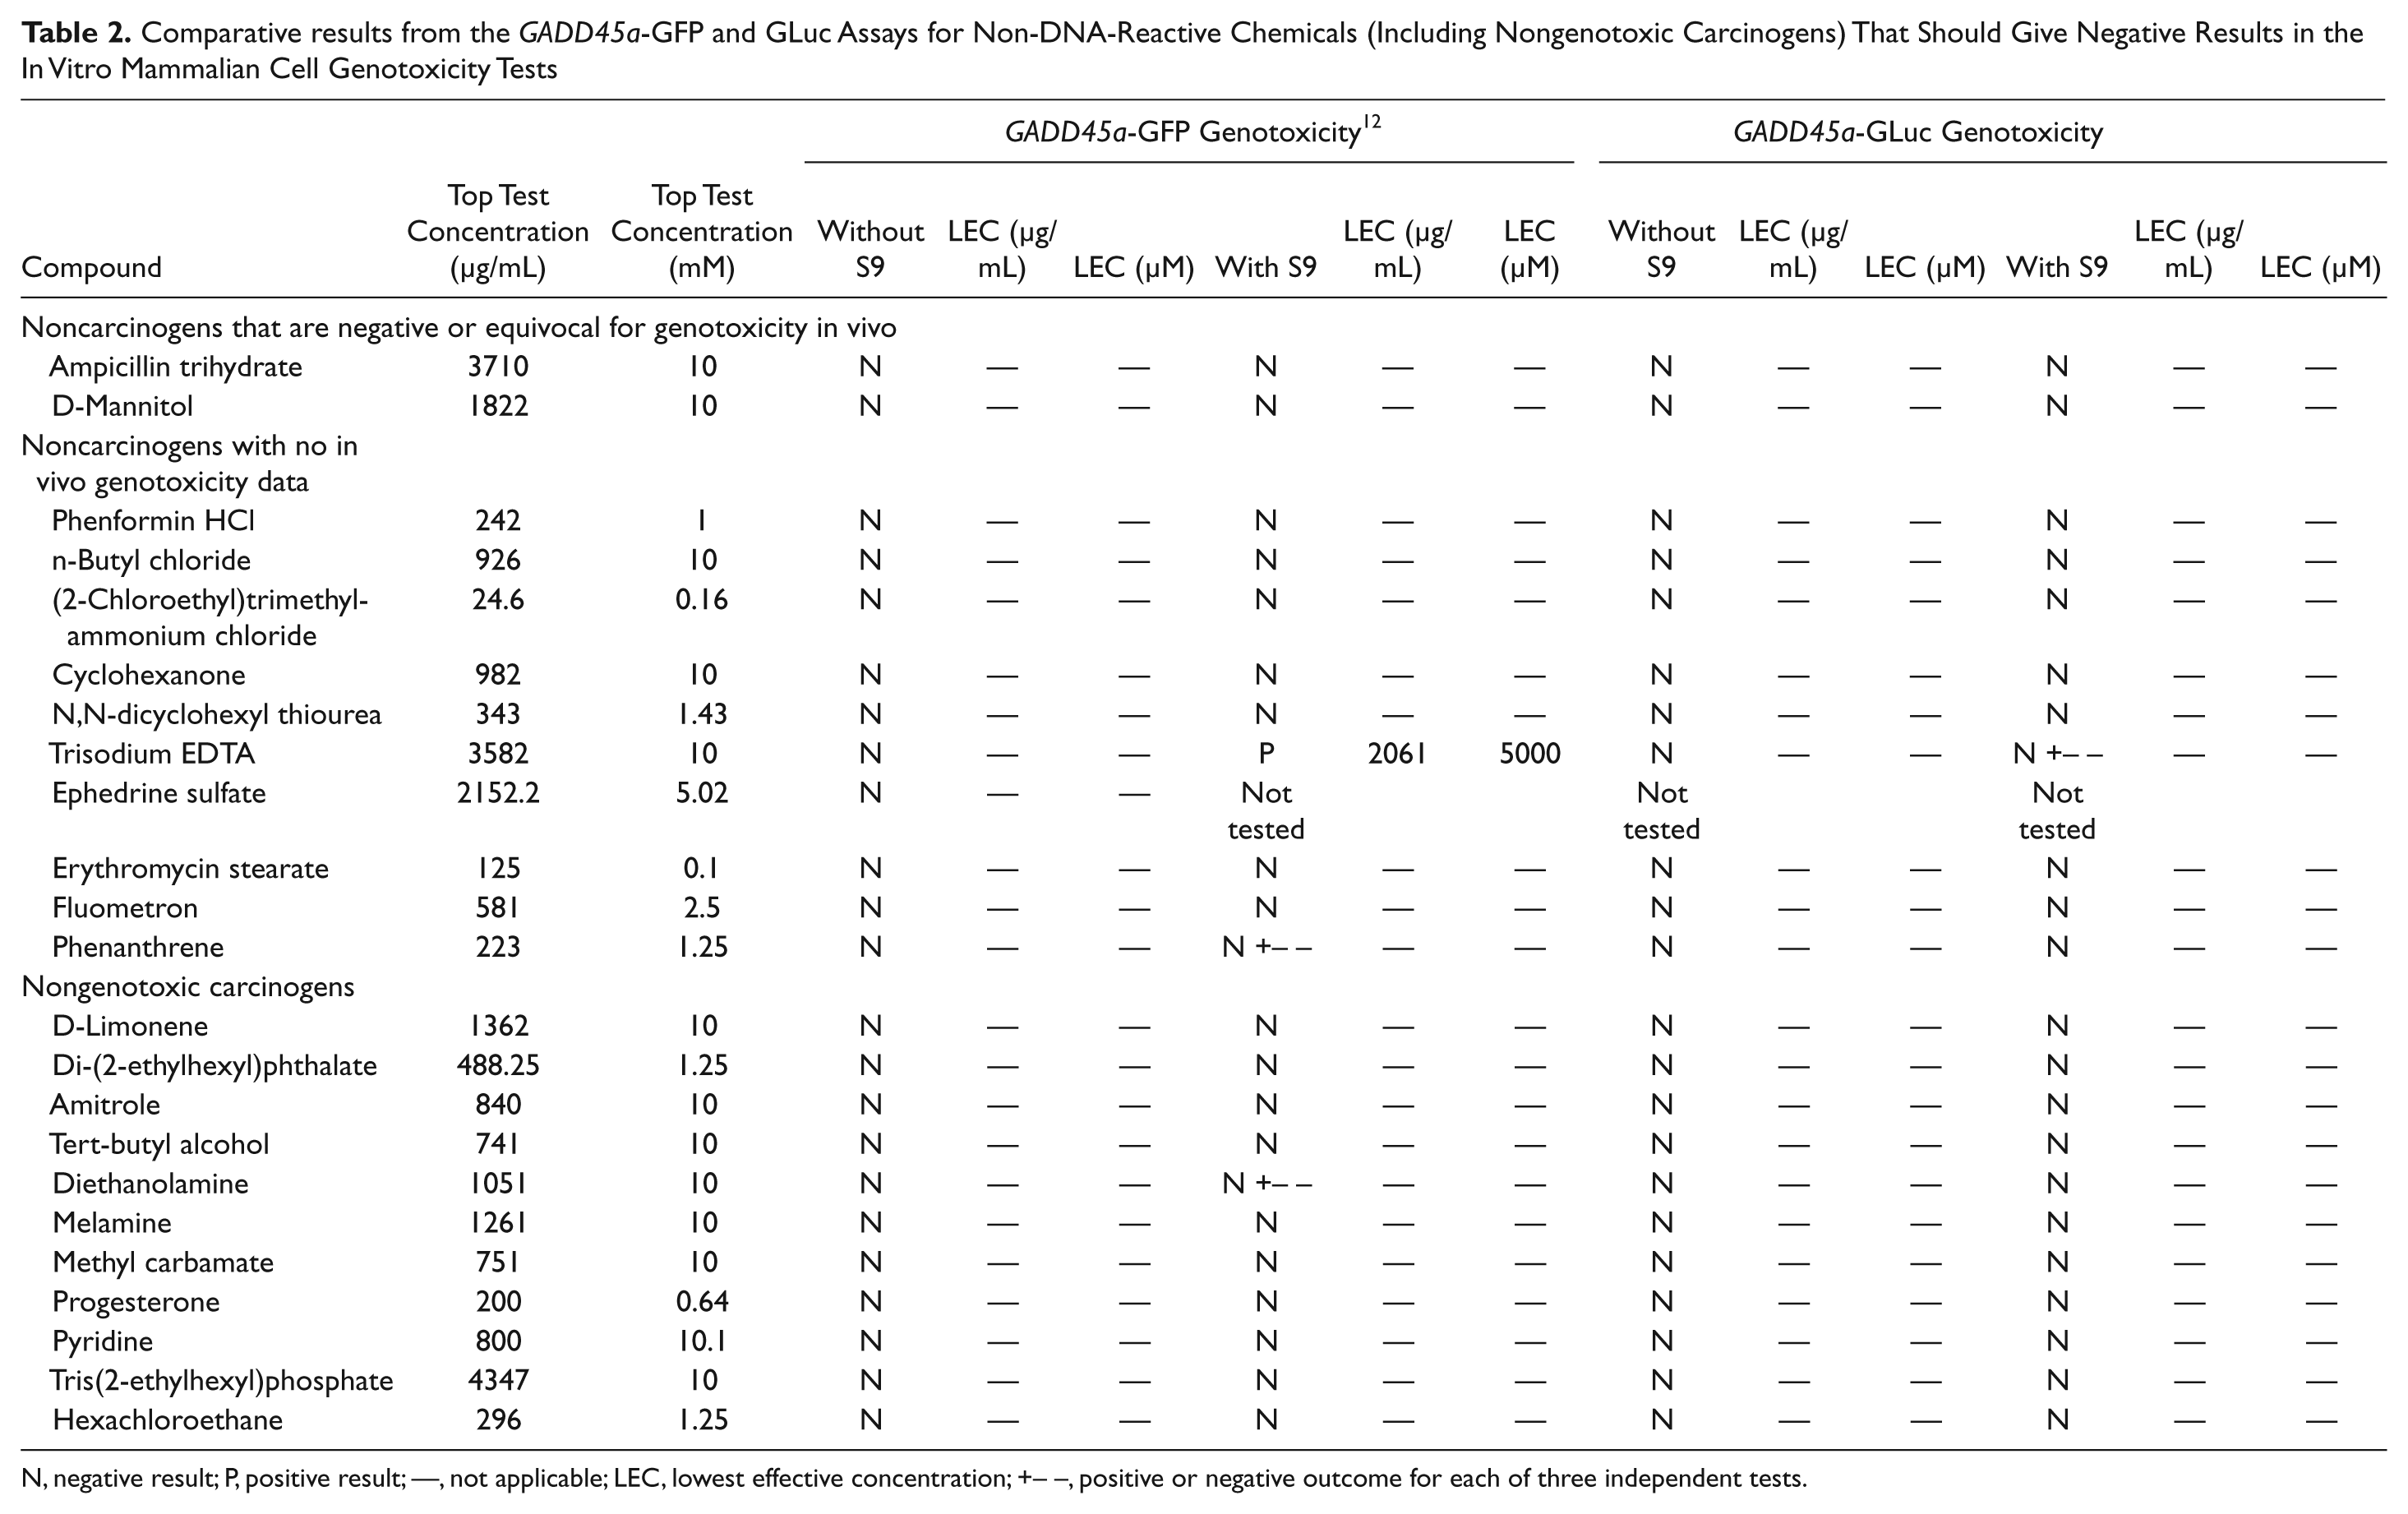
N, negative result; P, positive result; —, not applicable; LEC, lowest effective concentration; +– –, positive or negative outcome for each of three independent tests.
Comparative Results from the GADD45a-GFP and GLuc Assays for Non-DNA-Reactive Chemicals (Including Nongenotoxic Carcinogens), Metabolic Poisons, and Others That Should Give Negative Results in the In Vitro Mammalian Cell Genotoxicity Tests but Have Been Reported to Induce Chromosomal Aberrations or Tk Mutations in Mouse Lymphoma Cells, Often at High Concentrations or at High Levels of Toxicity
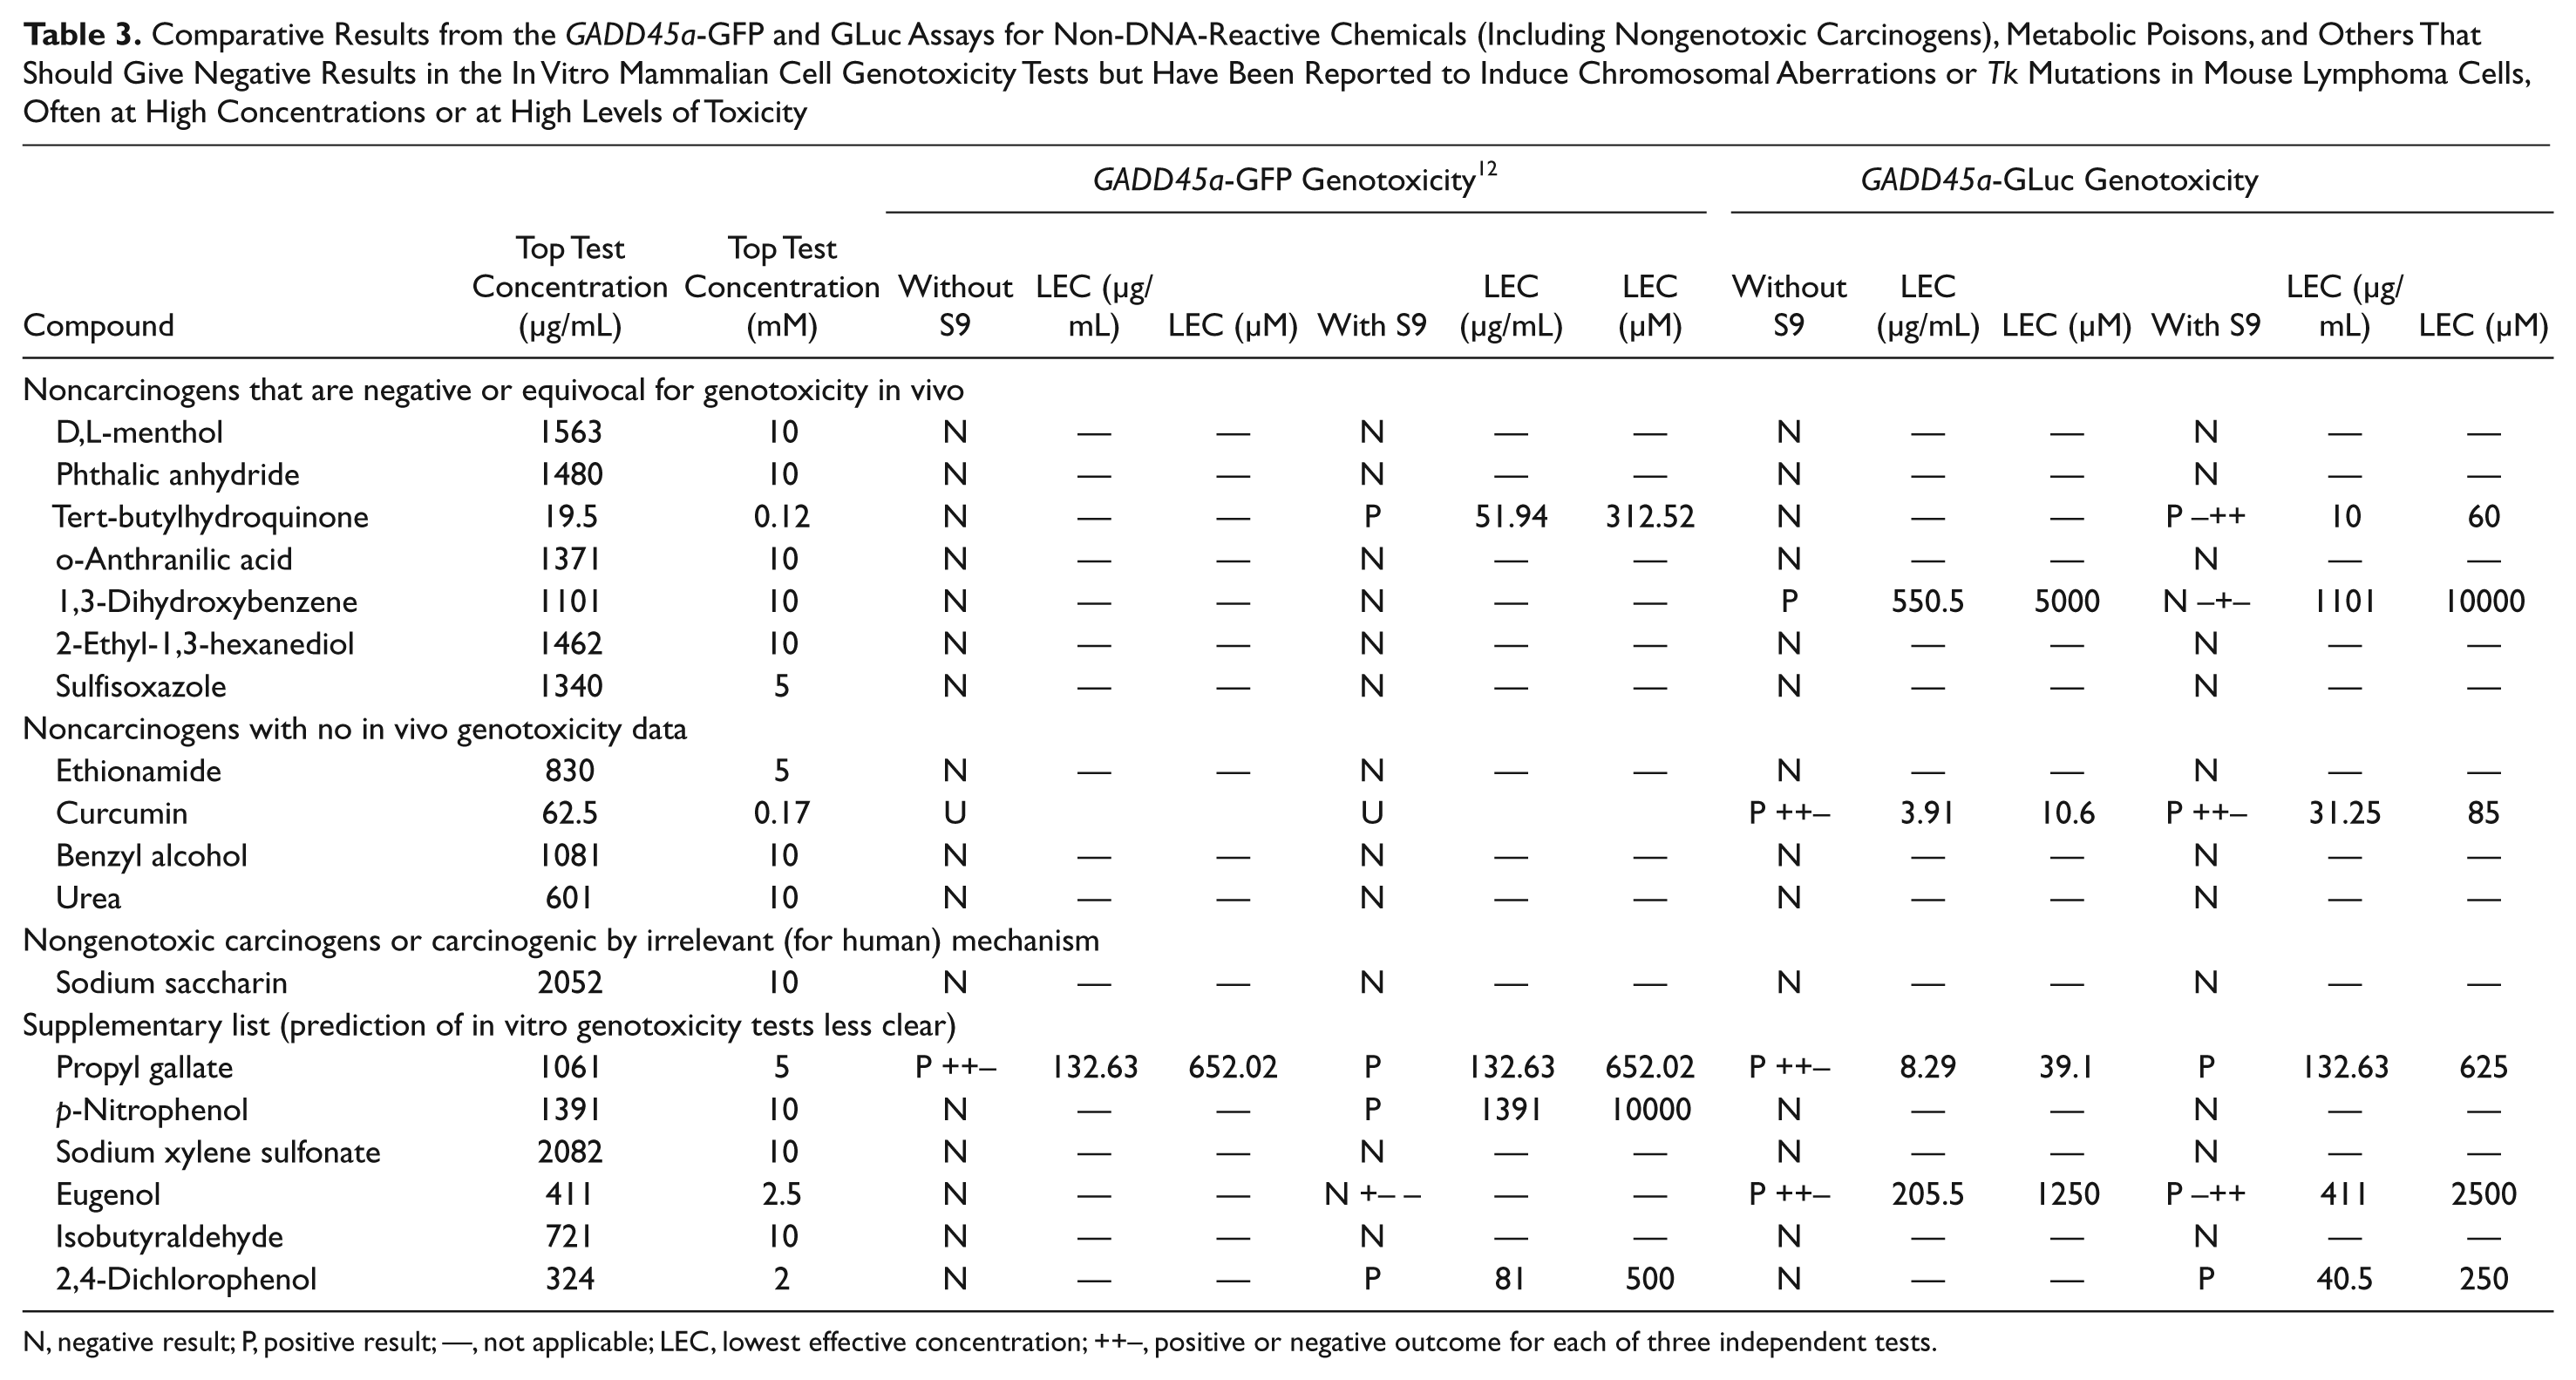
N, negative result; P, positive result; —, not applicable; LEC, lowest effective concentration; ++−, positive or negative outcome for each of three independent tests.
Assessment of Cell Concentration
A Beckman Coulter Z1 Particle Counter (Beckman Coulter [UK] Ltd, High Wycombe, UK) was used to determine the cell concentration in cultures of growing TK6 reporter cells being prepared for use in the assay. Counts were used to adjust culture density to 1 × 10⁶ cells per milliliter in assays.
Replacement of the GFP Gene with a Gaussia Luciferase Gene in the GADD45a Reporter Plasmid
The construction of the GFP reporter has been described previously. 9 The humanized version of the GLuc protein (Prolume, Ltd., Pinetop AZ) was amplified from the pCMV-GLuc control plasmid (New England Biolabs, Hitchin, UK) using the following primers:
GLuc-F: 5′-GGCTCGAGAGTCAAAGTTCTGTT- TGCCCTG-3′
GLuc-R: 5′-GCGGCCGCATTAGTCACCACCGG- CCCC-3′
The PCR fragment was cloned into the EcoRV site of the plasmid pBluescript II SK(–) (Fermentas GmbH, St. Leon-Rot, Germany) for amplification, then liberated by digesting with Xho I, blunting the resulting ends with mung bean nuclease (New England Biolabs), and digestion with Not I. The GFP ORF was removed from the previously described pEP-GD532 plasmid 9 by digesting with Asc I, blunting the resulting ends with mung bean nuclease, then digestion with Not I. The liberated fragment containing the GLuc gene was then ligated into the pEP-GD532 plasmid in place of the GFP ORF. The resulting plasmid was introduced into TK6 cells (HPA Culture Collections, Salisbury, UK; cat. no. 95111735) using a Gene Pulser II Electroporation System (Bio-Rad Laboratories Ltd., Hemel Hempstead, UK). Clonal selection and expansion of transfected cells was performed in RPMI 1640 medium (with GlutaMAX and 25 mM HEPES) containing 200 µg/mL hygromycin B (Life Technologies Ltd., Paisley, UK). Transfectants with a functioning reporter plasmid were selected by performance of the luciferase reaction and detection of a constitutive level of light emission (see below).
Microplate Preparation—without S9
Test compounds were presolubilized in DMSO and diluted with sterile, deionized H2O to 2× stock solutions containing 2% v/v DMSO: Cisplatin alone was dissolved in H2O and tested in the absence of DMSO. Black-walled, clear- bottomed, sterile 96-well microplates (Thermo Fisher Scientific, Inc., Basingstoke, UK; Matrix Tech Corp cat. no. 4929) were used in all tests, and each compound was tested in duplicate within a microplate. Then, 150 µL of four test compounds was added in duplicate to column 1 of a microplate and serially diluted seven times with 2% DMSO diluent to produce eight serial dilutions (typically twofold; columns 1–8). Wells in columns 9 and 10 were vehicle-treated controls. Growing GADD45a-GLuc cells were harvested and resuspended at a concentration of 2 × 10⁶ cells per milliliter in assay medium (Gentronix Ltd., Manchester, UK), and then 75 µL was added to all wells in columns 1 to 11. This produced an assay starting cell density of 1 × 10⁶ cells per milliliter in each microplate well. A series of internal controls were included in columns 11 and 12 of each microplate: “high” (0.5 µg/mL) and “low” (0.125 µg/mL) doses of 4-nitroquinoline-1-oxide (NQO) as a positive control for the increase in expression of GLuc in response to genotoxic stress; wells containing only test compound and assay medium to assess the potential of each compound to interfere with the luciferase reaction; wells containing only diluent or assay medium and diluent (“medium control”). The latter allow determination of background fluorescence and luminescence, as well as detect contamination in the medium. Following setup, the microplate was sealed with a breathable membrane (Breathe-Easy; Diversified Biotech, Boston, MA) and incubated at 37 °C in a humidified atmosphere (5% CO2) for 48 h. A representative picture of the prepared assay microplate layout is provided in the supplemental online materials (
Microplate Preparation—with S9
Assays incorporating S9 fraction were prepared with an almost identical microplate layout to that described above; differences are highlighted here. Black, round-bottomed, sterile 96-well microplates were used in this protocol (Greiner Bio-One Ltd., Stonehouse, UK). To account for the volume of S9 added, test compounds were prepared to 2.5× stock solutions (cf. 2× without S9) in 2% (v/v) aqueous DMSO. Then, 120 µL of each was added to wells in column 1 of a 96-well microplate and then serially diluted seven times as above. Two concentrations (25 and 5 µg/mL) of the pro-genotoxin cyclophosphamide were used as positive controls, and assay medium control wells included S9. S9 fraction (Aroclor-1254 induced, male Sprague-Dawley rat extract; MolTox, Inc., Boone, NC) was diluted 1 in 10 with 0.5 mM β-nicotinamide adenine dinucleotide phosphate and 2.5 mM D-glucose-6-phosphate (Apollo Scientific, Stockport, UK) in assay medium. Then, 15 µL of the S9 mix was added to each well of the microplate (except A12 and B12) such that the final S9 mix in each well was 1% v/v, with respect to the stock S9. Growing GADD45a-GLuc cells were prepared as above, in exposure medium (Gentronix Ltd.) containing 10% (v/v) heat-inactivated donor horse serum. After a 3-h incubation, cells were washed twice in Dulbecco’s phosphate-buffered saline (D-PBS) to remove S9, then resuspended in prewarmed serum-free recovery medium (Gentronix Ltd.) for a further 45-h incubation. A representative picture of the prepared assay microplate layout is provided in the supplemental online materials (
Microplate Reading
Thirty minutes prior to data collection, assay microplates were removed from the incubator and allowed to reach room temperature. In initial experiments, coelenterazine was dissolved in acidified methanol at a concentration of 25 mM and stored in the dark at −80 °C. Thirty minutes before use, the solution was diluted to a concentration of 2.5 µM in assay medium containing 5 mM hydroxypropyl-β-cyclodextrin (unbuffered coelenterazine). In later experiments, coelenterazine was prepared as a 5-mM stock solution in acidified methanol and stored at −80 °C. Approximately 30 min before use, this was diluted to 2.5 µM in a buffer consisting of 400 mM Tris-HCl and 5 mM β-cyclodextrin, adjusted to pH 7.4 (buffered coelenterazine). For subsequent steps, the protocols were the same.
Luminescence data were collected using a Tecan Infinite F500 plate reader (Tecan UK Ltd., Reading, UK) fitted with an injector syringe system. Then, 50 µL of the diluted coelenterazine solution was injected into a well at high injection speed and shaken within the microplate reader for 2 s, and then luminescence data were collected; this cycle was repeated for each individual well of the microplate. Data were collected with OD1 attenuation and an integration time of 5 s.
Following luminescence data collection, cell density was determined using TO (see also Results). TO was originally identified as a highly fluorescent dye suited for the analysis of reticulocytes. 25 In the presence of RNA, its fluorescence (quantum yield) is increased 3000-fold with excitation at 509 nm and emission at 533 nm. 25 The use of TO as a gross measure for cell number estimation yields high fluorescence intensities, for example, relative to the GADD45a-GFP reporter signal in untreated cells (GFP ~1000-fold lower signal; data not shown). This means that interference from other green fluorescent species is unlikely to affect the TO signal except under rare, extreme circumstances.
A TO mix was prepared by combining 50 µL of a TO stock solution (12.5 mM TO in 100% DMSO) with 10 mL of a 4% v/v Triton X-100 solution in D-PBS. This produced a TO concentration of 62.5 µM. A 50-µL aliquot of the TO mix was added to each well of the microplate, producing a final TO concentration of 12.5 µM. Fluorescence data were collected using standard fluorescein (FITC) filters with excitation at 485 nm and emission at 535 nm.
Data Processing
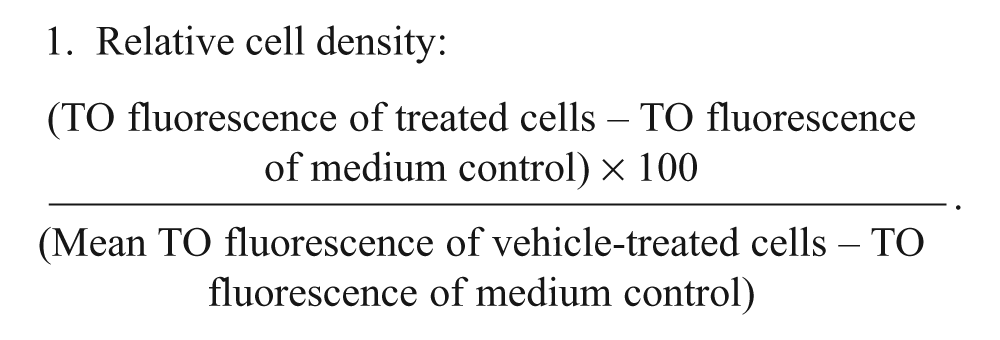
GLuc luminescence measurements were normalized for cell density using TO fluorescence data to yield “brightness” values. Brightness information was then used to calculate GADD45a-GLuc reporter induction relative to vehicle-treated controls.
Relative cell density:
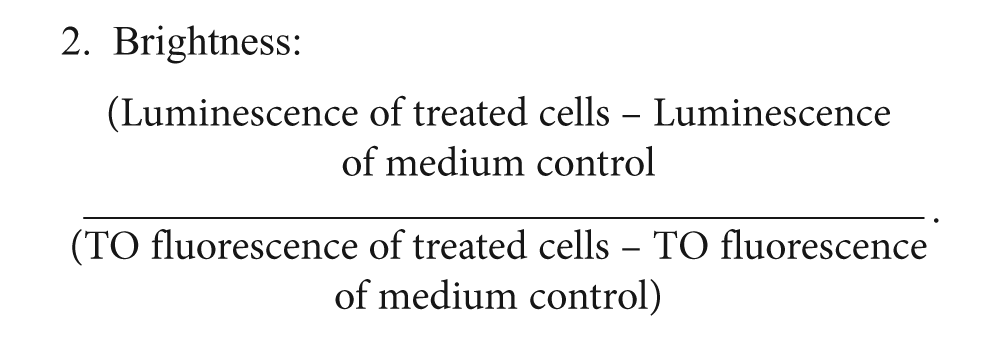
Brightness:
Data from corresponding test wells for the duplicate compound tests within an assay microplate were combined by averaging corresponding brightness values:
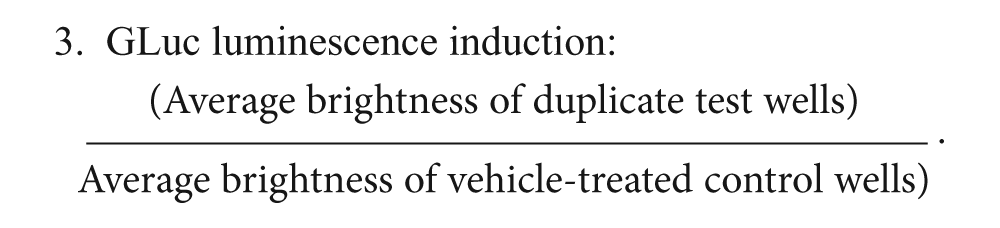
GLuc luminescence induction:
Thresholds to Define Positive and Negative Genotoxicity and Cytotoxicity Results
The ECVAM-recommended compounds were tested three times in independent experiments, set up on different days to allow an analysis of the reproducibility of the data. Compounds were tested to a maximum concentration of 10 mM when not limited by solubility or cytotoxicity (all were comparable with those used in the GFP study 12 ). The decision threshold for determining a positive (genotoxic) result for GADD45a-GLuc was set by calculating the mean and standard deviation of the GLuc luminescence induction from cells treated with toxic and nontoxic, nongenotoxic compounds, mirroring the approach used for the GADD45a-GFP assay. 9 A positive genotoxicity result threshold was determined at 1.8-fold relative induction, which is greater than 3 standard deviations from the mean. The same process was followed for the S9 protocol, and the decision threshold derived was 1.5-fold relative GLuc induction. These statistically defined thresholds were further empirically tested using sets of standard compounds of known cytotoxicity and genotoxicity to confirm robust segregation of (pro-)genotoxins and nongenotoxins. Two thresholds for cytotoxicity define the lowest effect concentration (LEC; <80% relative cell density assessed by TO fluorescence) and the data rejection threshold at high toxicity (<30% relative cell density).
Results
TO Fluorescence Provides Improved Discrimination of Very Small Differences in Cell Numbers
Thiazole orange is a cyanine dye whose fluorescence is enhanced greatly by binding (intercalation) to both RNA and DNA. It was speculated that this might provide a more sensitive measure of cell density than using optical absorbance. First, a cell suspension of 1 × 10⁶ cells/mL was prepared and serially diluted to a cell density of 1.56 × 10⁴ cells/mL to mimic that found following a 48-h exposure to a highly cytotoxic compound. Figure 1 shows the relationship between cell numbers per milliliter (x-axis) and both optical absorbance (OD 620 nm) and TO fluorescence (excitation = 485 nm; emission = 535 nm). It is apparent that the relationship between optical absorbance and cell density loses linearity at high concentrations and does not fall to zero when cells are absent from the solution. This is due to the light-absorbing properties of the growth medium. The TO fluorescence signal does not lose linearity. It also fails to reach zero in the absence of cells, which can be attributed to the low levels of autofluorescence of the growth medium. To correct for this, there are control wells in the microplate containing diluted medium alone (“medium control” in the data-processing equations). Because of its greater linear range, the TO signal was used to normalize luminescence measurements in all GADD45a-GLuc results presented here.
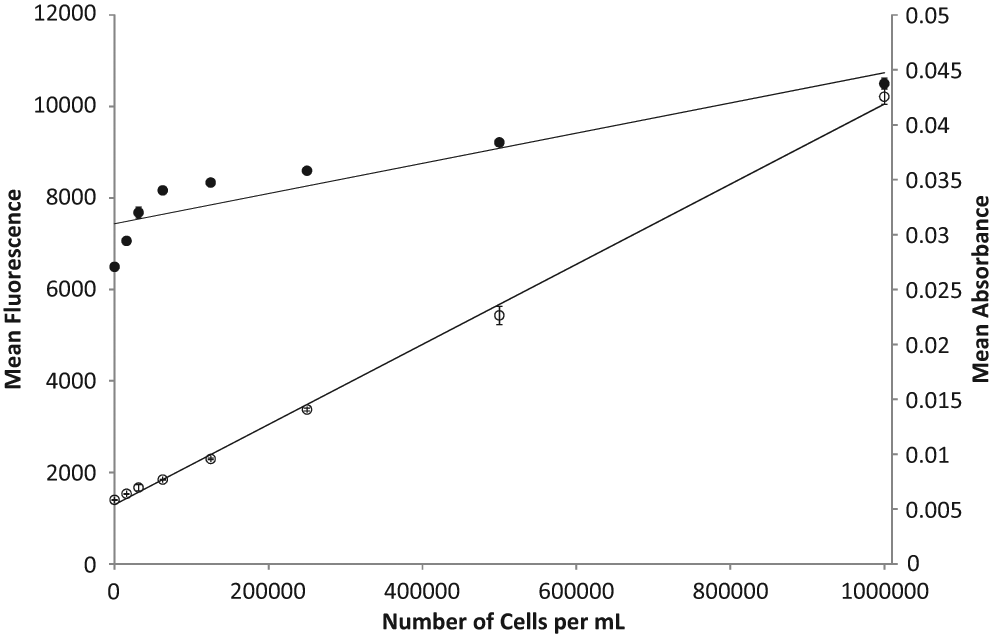
Comparison of cell density measurements in a 96-well microplate using optical absorbance or thiazole orange fluorescence. Serial dilutions of cells from 1 × 10⁶ to 1.56 × 10⁴ cells/mL (150 µL/well) were assessed in a multimode microplate reader by optical absorbance at 620 nm (closed circle, ●; R2 = 0.8369) or fluorescence at FITC wavelengths (open circle, ○; R2 = 0.9979). Data points represent the mean of triplicate wells, solid lines show the linear regression, and error bars represent standard deviations from the mean (maximum standard deviations: absorbance, 1.6%; thiazole orange fluorescence, 4.0%).
Buffering Coelenterazine to pH 7.4 Reduces Luminescence Signal Variation
Preliminary experiments were performed to investigate stability of the luminescence signal. A microplate with cells alone (no test chemicals) was incubated for 48 h. Then, 50 µL/well of unbuffered coelenterazine was added sequentially to each well using a serial injection luminometer and luminescence recorded following each injection. There was a significant increase in the mean luminescence for each row of wells (23.5%) from the first (row A) to the last (row H), and the coefficient of variation (CV) for the relevant microplate wells was 9.6% (
Representative Results from the GADD45a-GLuc Assay
Figure 2
shows GADD45a-GLuc assay data from six compounds, one compound per graph panel. Toxicity dose-responses derived from TO data are represented by open circles, whereas the GLuc induction data are shown by closed circles. Each data point represents the pooled data from three or more independent assays, and error bars show the standard deviation from the mean. Panels
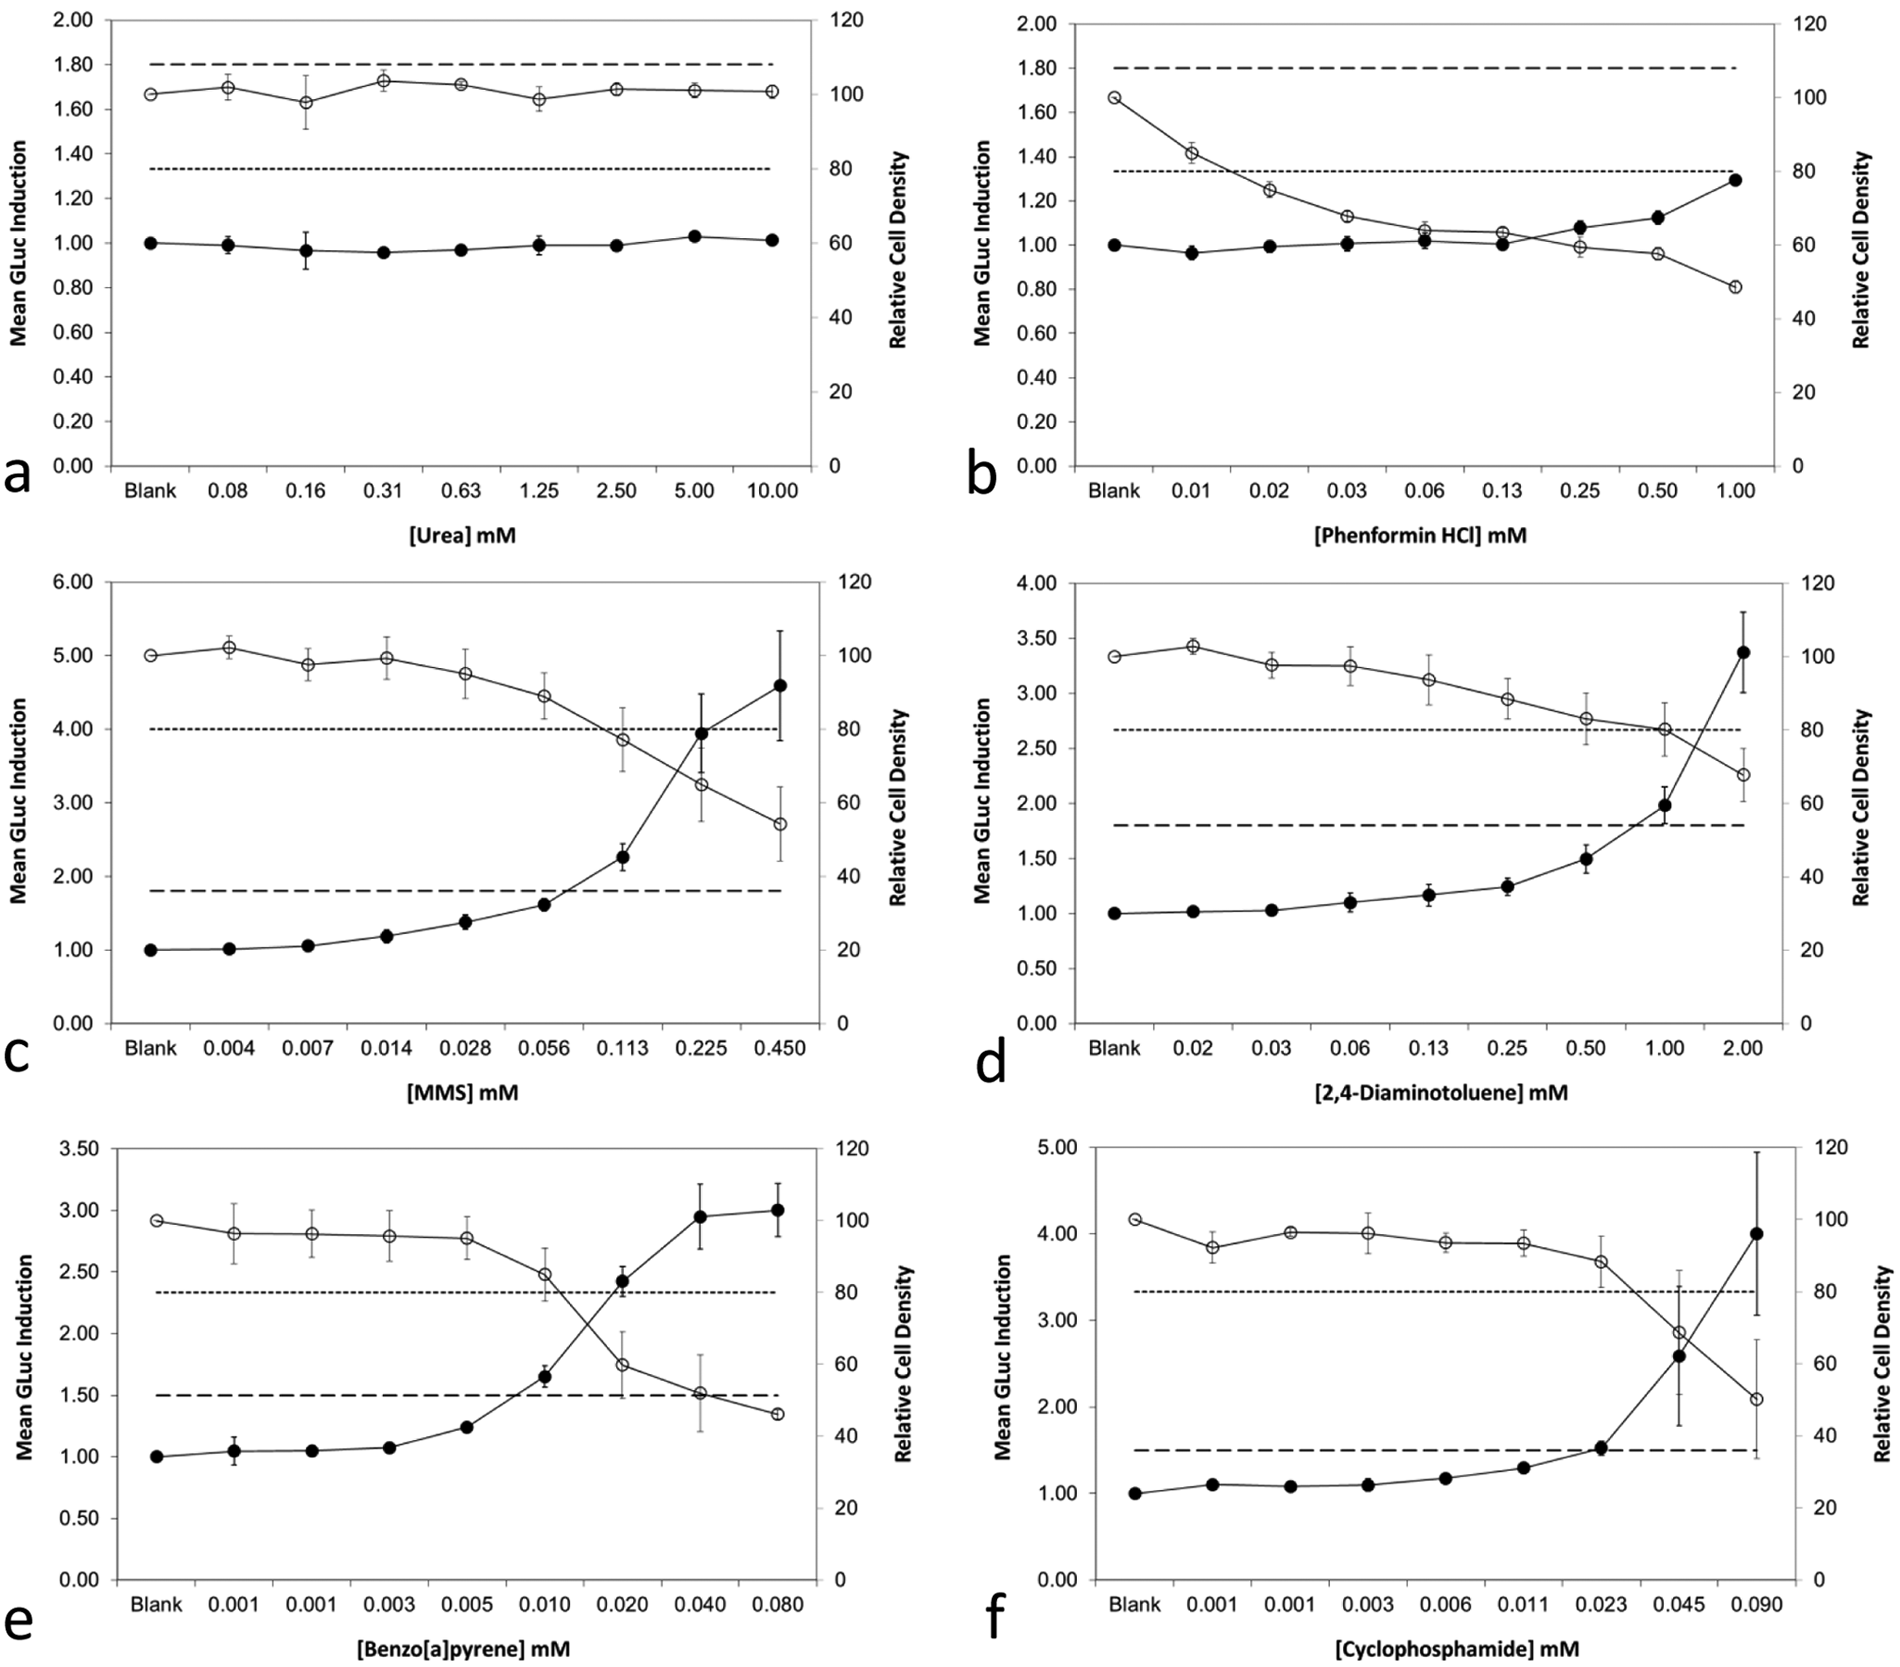
Example dose-response data from the GADD45a-GLuc “BlueScreen HC” assay, showing positive results for genotoxins and pro-genotoxins and negative results for nongenotoxins. Graphical data are presented (
The GADD45a-GLuc Assay Generates Valid Data from Highly Fluorescent Compounds
Fluorescein was used to investigate the utility of the GLuc reporter in the assessment of genotoxicity of highly fluorescent samples. Figure 3 presents both GFP and GLuc dose-response data for three samples: MMS (row 1), fluorescein (row 2), and MMS spiked with fluorescein (row 3). In the GFP assay, two cell strains are used: The “test strain” carries a functional GFP gene in the GADD45a reporter, whereas the “control strain” has a missense mutation in the GFP gene and cannot express GFP. The fluorescence of the control strain, which is primarily contributed by test compound autofluorescence, is subtracted from that of the test strain to remove this component of interfering fluorescence. This correction is less effective in extreme cases of test compound autofluorescence. A control strain is not necessary in the luciferase assay because, unlike fluorescence, luminescence is an extraordinarily rare chemical property.
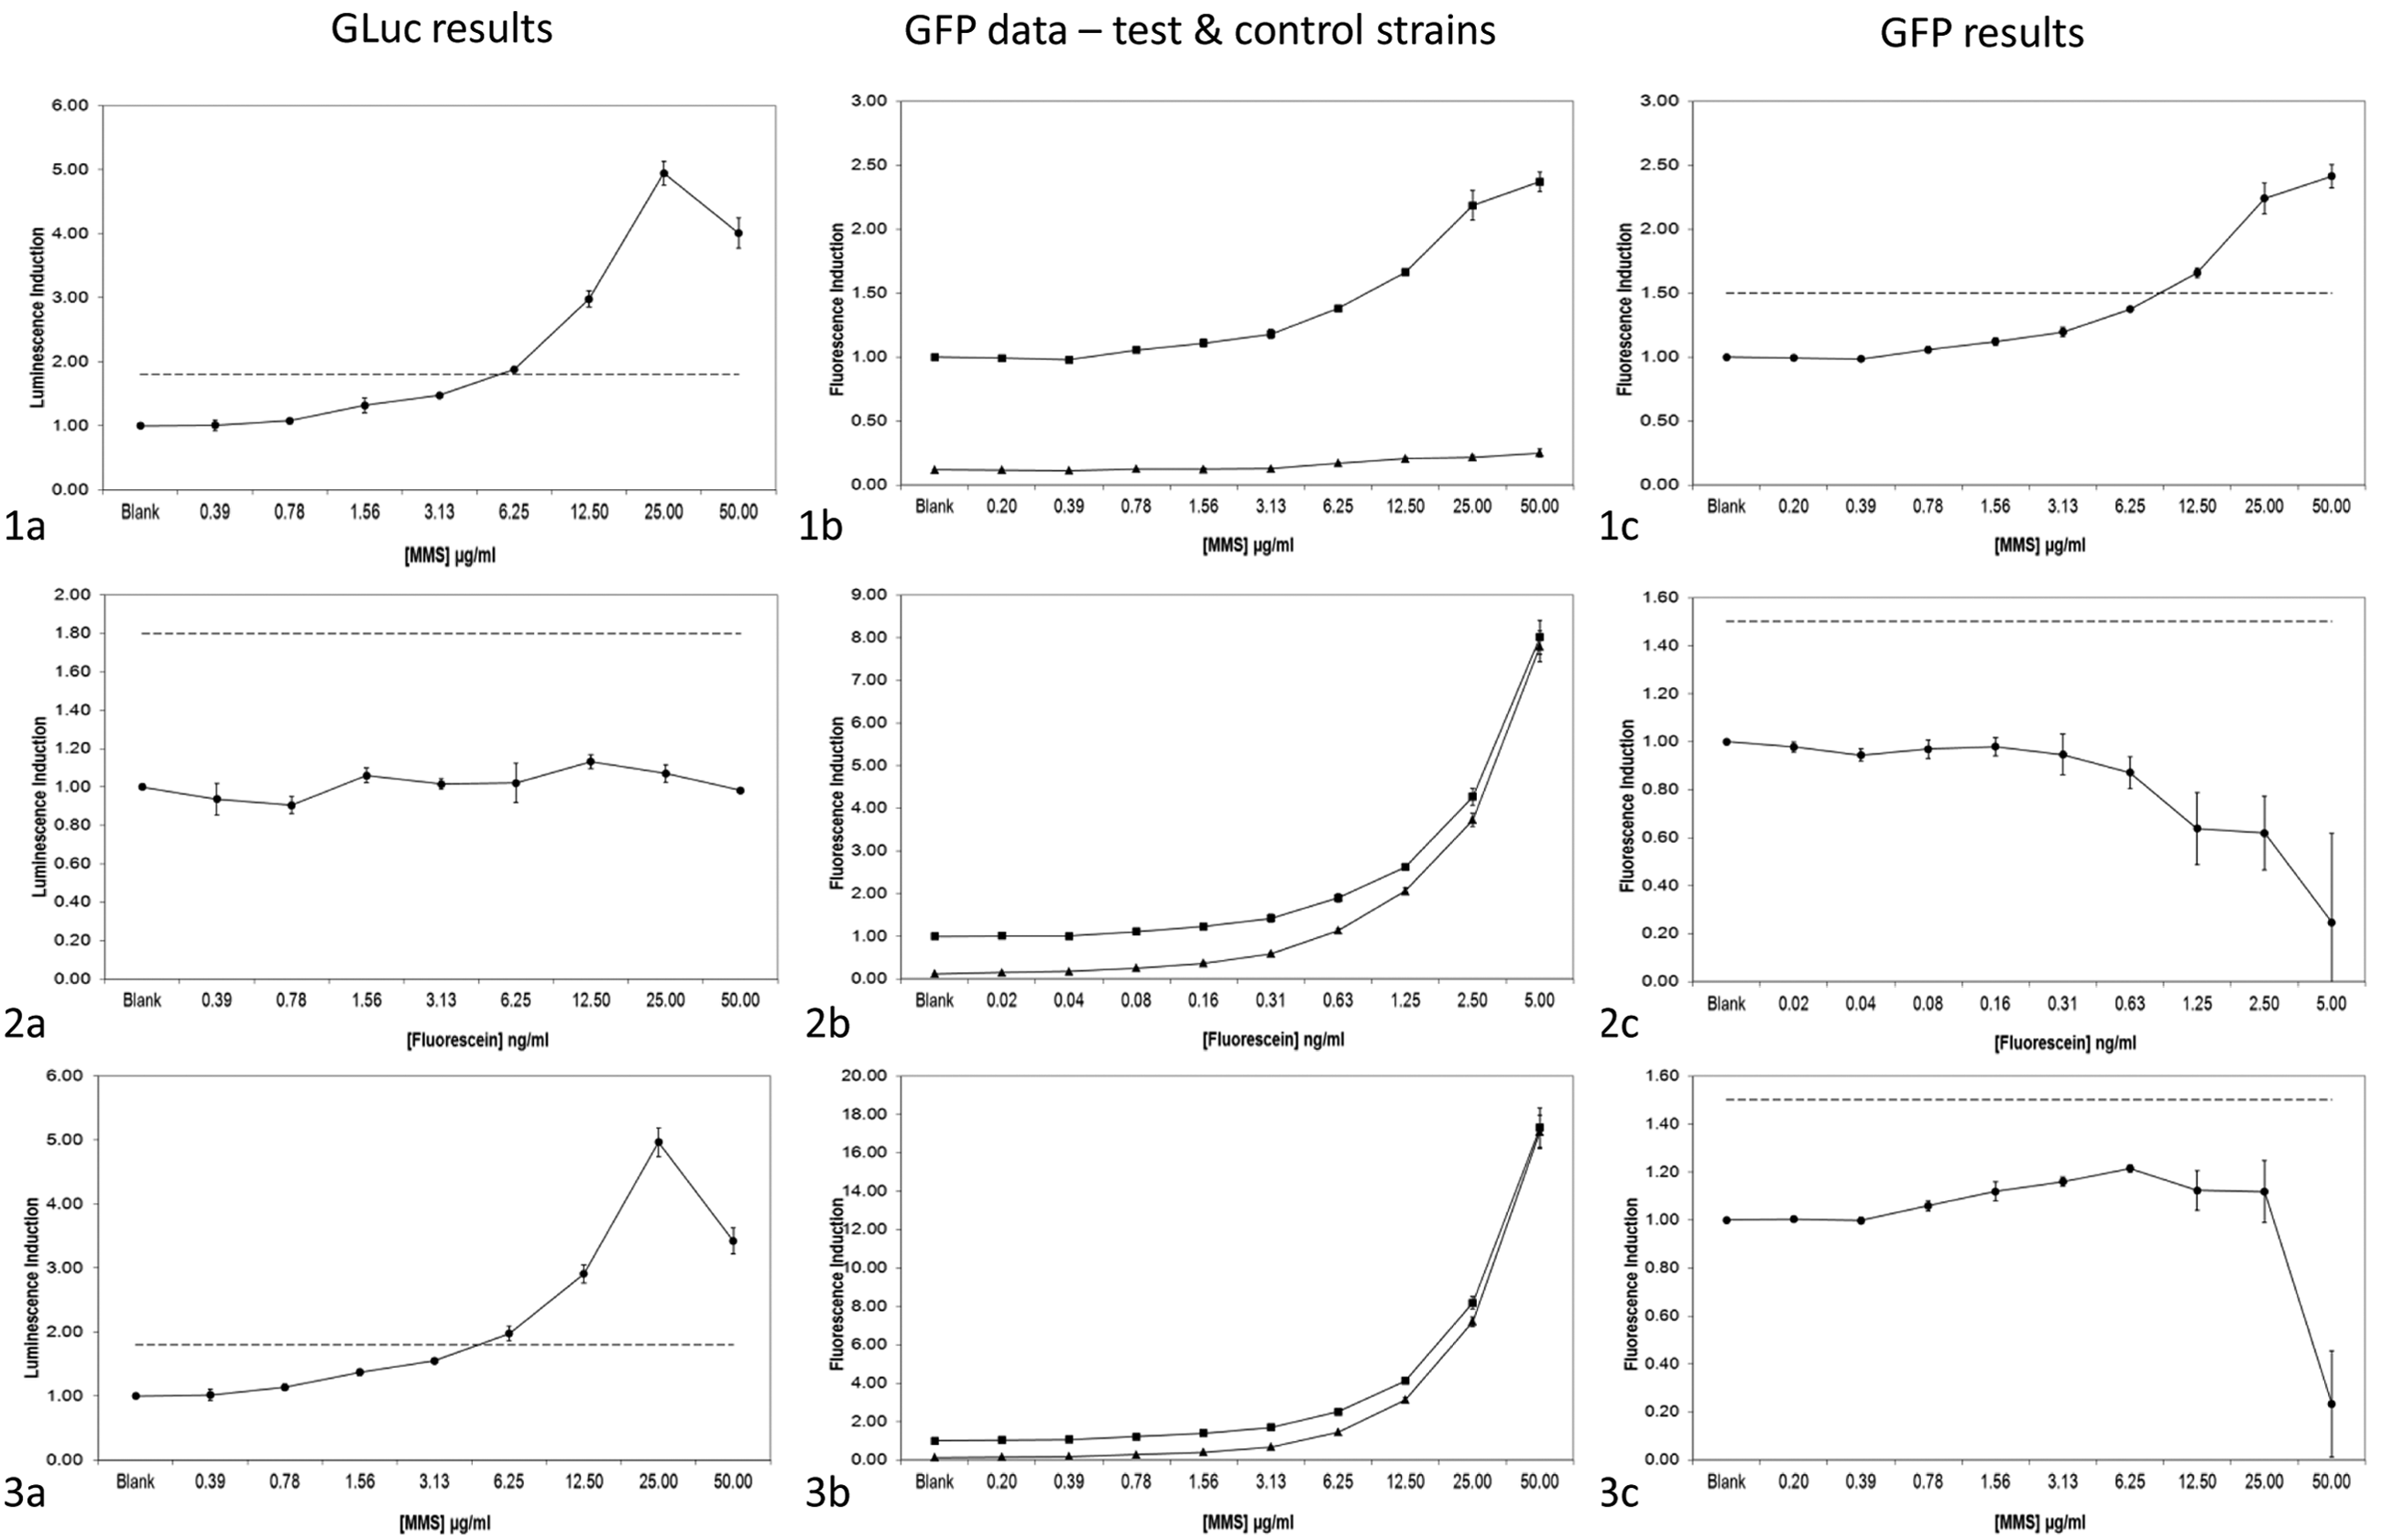
Data from the GADD45a-GLuc “BlueScreen HC” and GADD45a-GFP “GreenScreen HC” assays in the presence of a highly autofluorescent compound. Row 1 (a–c) shows data for methyl methanesulfonate (MMS; 50 µg/mL) tested alone; row 2 (a–c) shows data for fluorescein (5 ng/mL) tested alone; row 3 (a–c) shows data from the testing of MMS (50 µg/mL) spiked with 5 ng/mL fluorescein. Panels labeled a all present data from the GADD45a-GLuc assay, whereas panels b (individual strains) and c (control strain subtracted from test strain) show the corresponding data from the GADD45a-GFP assay. Closed circles (●) represent relative luminescence (a) or corrected relative fluorescence (c) induction; squares (●) and triangles (▲) in b represent the green fluorescent protein (GFP) “test strain” and “control strain,” respectively; error bars represent the standard deviation from the mean (n = 3); dashed line represents the relative luminescence or fluorescence induction threshold.
MMS exposure produced clear induction of the luciferase reporter (row 1, panel a). For the GFP reporter, there was clear induction in the test strain (squares; 1b) and none in the control strain (triangles; 1b). Row 1, panel c shows the control strain data subtracted from the test strain data and clear reporter induction.
Fluorescein exposure did not induce the luciferase reporter (2a), but both test and control GFP strains showed a similarly strong dose-dependent increase in fluorescence (2b). When the control strain data were subtracted from the test strain data, no induction was apparent (2c). In the GFP assay, the strong compound fluorescence would generate a warning (from wells containing the test compound alone), and the overall result might be classified “uninterpretable.”
MMS spiked with fluorescein produced clear induction of the luciferase reporter (3a). As in 2b, both test and control GFP strains showed increasing fluorescence (3b), but the data subtraction did not resolve the MMS-induced GFP signal (3c), producing a negative result. This demonstrates a clear advantage of the GLuc assay.
Evaluation of the GADD45a-GLuc Assay Using Compounds from the ECVAM-Recommended List
Reproducibility
Among the 42 definitive positive (group 1) and negative (group 2) compounds, tested with and without S9 (84 assays in triplicate), all but 1 compound produced results that were unequivocally positive or negative. The exception was EDTA with S9, which produced one positive result and two negative results. Thus, a single test result is representative of a triplicate test and hence sufficient to give a reliable result.
This 96-well format assay is suited to low- and moderately high-throughput screening, and because of this, each assay plate is self-contained with internal acceptance criteria applied in each case. In HTS, assay performance is often assessed by calculating the Z factor, which takes into consideration both the dynamic ranges and the data variations of the signal measurements. It is generally agreed that an excellent HTS assay should have a Z factor >0.5 and a signal-to-background (S/B) ratio >3. 26 To determine a Z factor in this assay, we compared GADD45a-GLuc induction in wells containing NQO-treated cells (“signal”: four wells per microplate) with vehicle-treated cells (“background”: eight wells per microplate) for 11 microplate assays from 4 separate days’ experiments. This produced a Z factor value of 0.64 ± 0.13, with the Z factor for no microplate falling below 0.35 (range, 0.35–0.82). The average S/B ratio was 7.67. The further development of this assay into the higher throughput 384-well format will be described in a following paper from a pharmaceutical screening group.
Group 1
The GADD45a-GLuc assay results for these compounds are shown in Table 1 . These comprise in vivo genotoxins, which should be detected as positive in the in vitro mammalian cell genotoxicity tests. Of the 20 compounds in this group, 16 produced positive results in the absence and/or presence of S9. Hence, the sensitivity of the GADD45a-GLuc assay in this collection was 80%.
Twelve of the 14 Ames-positive in vivo genotoxins produced positive results in the assay, including all O6 and N7 alkylators, polyaromatic hydrocarbons, and aromatic amines. The two exceptions were cadmium chloride and p-chloroaniline.
Of the six in vivo genotoxins that were negative or equivocal in the Ames test, four produced positive results in the GADD45a-GLuc assay: etoposide, hydroquinone, sodium arsenite, and Taxol. Azidothymidine and chloramphenicol both tested negative.
Group 2
The GADD45a-GLuc results for these compounds are shown in Table 2 . These comprise non-DNA-reactive chemicals (including nongenotoxic carcinogens) that should give negative results in the in vitro mammalian cell genotoxicity tests. All 22 compounds tested in this group produced negative results. The specificity of the GADD45a-GLuc assay in this collection was 100%.
Group 3
The GADD45a-GLuc results for these compounds are shown in Table 3 . These comprise non-DNA-reactive chemicals (including nongenotoxic carcinogens), metabolic poisons, and others expected to give negative results in the in vitro mammalian cell genotoxicity tests but have been reported to produce positive results often at high concentrations or at high levels of cytotoxicity.
Eighteen compounds were tested in this group, and 12 of these yielded negative results in the GADD45a-GLuc assay. Of the seven noncarcinogens that were negative or equivocal for in vivo genotoxicity, five tested negative both in the absence and presence of S9. Tertiary-butylhydroquinone (TBHQ) was negative without S9 but tested positive in two of three tests with S9 in both GFP and GLuc assays. 1,3-Dihydroxybenzene was positive only without S9. Three of the other four noncarcinogens (no in vivo genotoxicity data) produced negative results (ethionamide, benzyl alcohol, and urea). Curcumin, previously uninterpretable in the GFP assay due to high autofluorescence, produced positive GLuc results in two of three tests both with and without S9. Among the six compounds for which prediction of other in vitro genotoxicity results is less clear, three compounds tested negative (p-nitrophenol, sodium xylenesulfonate, and isobutyraldehyde). Eugenol and propyl gallate both produced positive results in two of three tests both with and without S9. 2,4-Dichlorophenol was reproducibly positive only with S9.
Discussion
Replacement of the GFP gene with a Gaussia luciferase gene in a reporter for activation of the human GADD45a gene has generated a new microplate-format genotoxicity assay (“BlueScreen HC”). The use of a luminescent signal has some advantages over fluorescence: The GADD45a-GLuc assay can be used to collect data from highly fluorescent compounds using a multimode spectrophotometer. In the GADD45a-GFP assay, such samples require additional data collection, either using fluorescence polarization optics in a microplate reader 21 or by flow cytometry. 11 Advantage is also gained from the ability to collect GLuc data from ±S9 protocols using the same multimode microplate reader. A flow cytometer is used for data collection from the +S9 protocol in the GADD45a-GFP assay. A comparative disadvantage of using a GLuc reporter is the “flash” luminescence output, which is a destructive end point and hence cannot be subsequently reassessed. In contrast, GFP fluorescence can be noninvasively assessed at different time points and with repeated measurements of the same sample.
During early testing of the new GADD45a-GLuc reporter system, a drift in luminescence signal was observed when data were collected using a multimode microplate reader with a single reagent injector. This system is used to inject the coelenterazine substrate in a serial fashion (i.e., well by well), and luminescence data are collected between each injection. The time delay caused by the single-well inject-mix-measure cycle resulted in an inconsistent luminescence signal across the rows of a microplate. This is not an issue for higher throughput platforms capable of simultaneous reagent injection into all wells and parallel data collection. Stability of the coelenterazine substrate solution was suspected of being the root cause of the signal drift in a single injector system. Perhaps surprisingly, it was discovered that buffering to pH 7.4 was sufficient to reduce reporter signal variation to a level comparable with that in the GFP assay.
A further novel aspect to this study was the introduction of a fluorescence measurement for the estimation of cell culture density. The nucleic acid–binding cyanine dye, thiazole orange, provides a much greater, linear range for the estimation of cell concentration than optical absorbance measurements. This, together with the greater dynamic range of signal over the concentrations tested, enables smaller differences in brightness to be discriminated with increased confidence. This should increase the applicability of the GADD45a-GLuc assay where fewer cells are used, for example, in higher throughput screening in 384-well microplates.
The performances of the GADD45a-GLuc and GADD45a-GFP assays were compared using the ECVAM-recommended list of compounds for the assessment of new or improved genotoxicity assays. 6 One might anticipate that the conservative exchange of the reporter gene in the construct would have little effect on performance. However, although GFP is assayed within the cell and without substrate, GLuc is exported and assayed by supplying a substrate and measuring the product of the enzymatic reaction. The change in reporter chemistry means that it is conceivable that some test agents might interfere with the secretory pathway, inhibit the luciferase reaction, or in some way quench the luminescence of the excited luminophore. Such scenarios might lead to the generation of misleading negative data, although there have been no published reports of inhibitors associated with the use of GLuc. Comparison of the GLuc assay results in this study with those published for the GFP assay 12 suggests that chemical interference with GLuc may not be a common phenomenon, as most compounds produced the same results in the two assays. For this reason, only those compounds where results differ between the two assays are discussed further.
Among the in vivo genotoxins expected to produce positive results ( Table 1 ), four compounds produced negative results in the GADD45a-GLuc assay, and two of these were also negative in the GFP assay. These were p-chloroaniline, which is not a carcinogen but produces positive results in the in vivo comet assays, 6 and chloramphenicol, which has inadequate carcinogenicity data and only produces weak in vitro mammalian cell genotoxicity responses at high doses (>1 mM). 27 Cadmium chloride was positive only in the GADD45a-GFP assay in the presence of S9 but tested negative in the GADD45a-GLuc assay. In the S9 protocols of both assays, compound exposure is limited to 3 h, after which test compound and S9 are removed by cell washing. Since GLuc is secreted from the cells, cell washing removes any luciferase exported during the initial 3 h. The wash step is clearly not a general problem with the S9 protocol, as all other pro-genotoxins produced expected results. It is, however, conceivable that cadmium inhibits the reaction between coelenterazine and luciferase. It might also be that increased metallothionein synthesis, which is reported to be stimulated in cadmium-exposed humans, 28 is sufficient to neutralize the genotoxic stimulus beyond 3 h. The nucleoside analogue azidothymidine was positive only in the GFP assay without S9 and at 5 mM. This is not a very potent effect, and testing to this concentration is now considered excessive in the testing of human pharmaceuticals. 1 Both GLuc and GFP signals produced dose-dependent increases, although only the GFP signal crossed the threshold. It is not clear why there was a different result for the two assays.
All the compounds expected to produce negative results did produce negative results in the GADD45a-GLuc assay. The replacement of GFP with GLuc has clearly not adversely affected the assay’s specificity—a key performance indicator. The GADD45a-GFP assay produced only one misleading positive result in this category (EDTA) and only in the S9 version of the assay at a high concentration (5 mM). 12
Among the less well-characterized compounds ( Table 3 ), curcumin could not be classified in the GADD45a-GFP assay due to high autofluorescence. The GLuc assay yielded positive results. Like propyl gallate and TBHQ, curcumin is an antioxidant of the quinone class, and there is evidence to suggest that such compounds can become genotoxic pro-oxidants. 29 Three compounds gave different results between the two assays. 1,3-Dihydroxybenzene (resorcinol) was positive only in the GADD45a-GLuc assay and at the second highest dose tested (5 mM). It is slightly autofluorescent, and hence this may have had an impact on the GFP result. p-Nitrophenol was positive only in the GADD45a-GFP assay at the highest tolerated dose (10 mM) in the S9 protocol. 12 Eugenol was positive only in the GADD45a-GLuc assay and at the highest tolerated dose (−S9, 1.25 mM; +S9, 2.5 mM). Had these compounds been tested to the new recommended top concentration (1 mM), 1 all would have produced negative results. However, this lower limit would not have affected sensitivity, as all of the expected positive results for compounds in group 1 were produced at concentrations <1 mM.
The replacement of GFP with Gaussia luciferase has produced an alternative reporter assay for the induction of the GADD45a gene, in a human cell line. The two assays have similar performance characteristics in terms of sensitivity and specificity in the detection of genotoxic compounds, but the new assay will have additional utility both in the HTS context and in studies of fluorescent compounds.
Footnotes
Declaration of Conflicting Interests
RMW is the founder and Chief Scientific Officer of Gentronix Ltd, and all other authors were employed by Gentronix Ltd when this work was performed.
Funding
This work was in part supported by the UK National Centre for the Replacement, Refinement and Reduction of Animals in Research [G0600339].
References
Supplementary Material
Please find the following supplemental material available below.
For Open Access articles published under a Creative Commons License, all supplemental material carries the same license as the article it is associated with.
For non-Open Access articles published, all supplemental material carries a non-exclusive license, and permission requests for re-use of supplemental material or any part of supplemental material shall be sent directly to the copyright owner as specified in the copyright notice associated with the article.