
Abstract
“Firefly rats” ubiquitously express the luciferase reporter gene under the control of constitutively active ROSA26 promoter in inbred Lewis rats. Due to the minimal immunogenicity of luciferase, wide applications of Firefly rats have been reported in solid organ/cell transplantation studies for in vivo imaging, permitting quantitative and non-invasive tracking of the transplanted graft. ROSA26 is a non-coding gene and generally does not affect the expression of other endogenous genes. However, the effect of ubiquitous luciferase expression on islet morphology and function has not been thoroughly investigated, which is critical for the use of Firefly rats as islet donors in islet transplantation studies. Accordingly, in vivo glucose homeostasis (i.e., islet function in the native pancreas) was compared between age-matched luciferase-expressing Firefly rats and non-luciferase-expressing rats. In vivo assessments demonstrated no statistical difference between these rats in non-fasting blood glucose levels, intraperitoneal glucose tolerance tests, and glucose-stimulated serum C-peptide levels. Furthermore, islets were isolated from both rats to compare the morphology, function, and metabolism in vitro. Isolated islets from both rats exhibited similar in vitro characteristics in post-isolation islet yield, islet size, beta cell populations, insulin content per islet, oxygen consumption rate, and glucose-stimulated insulin secretion. In conclusion, ubiquitous luciferase expression in Firefly rats does not affect their islet morphology, metabolism, and function; this finding is critical and enables the use of isolated islets from Firefly rats for the dual assessment of islet graft function and bioluminescence imaging of islet grafts.
Introduction
Bioluminescence imaging (BLI) has been widely used in many experimental applications to explore biological processes1–4. Advancement of the molecular probes for the BLI played an essential role in establishing BLIs, and luciferase (Luc) is one of the most well-established probes used in BLI. Luc catalyzes the reaction of Luc’s substrate, luciferin, which emits the bioluminescent light in the presence of ATP. Because ATP is an essential molecule to maintain cell metabolism, light emission from this Luc reaction reflects the metabolic activity of Luc-expressing cells.
In transplantation studies using the Luc (+) cells or organs into the wild-type (WT) recipients, BLI can identify the location of the graft (as a qualitative assessment). More importantly, BLI allows for non-invasive quantification of the viability or survival of the transplanted cells or organs longitudinally with multiple assessments. This is in contrast to the classical histological evaluation of grafts, in which investigators only assess the graft at a single timepoint in the same animal. In addition, the cost-effectiveness and ease of visualization of Luc signal in animal models make the Luc-BLI a highly useful imaging modality in transplantation studies. Other non-invasive imaging modalities include ultrasonography5–7, magnetic resonance imaging8,9, computerized tomography, and positron emission tomography10–12. Although they have their advantages, including high spatial resolution with magnetic resonance imaging and computerized tomography and functional assessment with positron emission tomography, the high cost and logistics of using radioactive tracers may be the disadvantages in experimental settings.
Due to the many advantages of BLI, numerous transgenic animal models using Luc reporter have been established for imaging specific biological and pathological processes, such as hypoxia, inflammation, pancreatic islet function, and pathological muscle and bone tissues13–20. “Firefly rat” is a transgenic rat that ubiquitously expresses the Luc reporter gene in inbred Lewis (LEW) rats 21 . The tissue from the Firefly rats demonstrated low immunogenicity in the skin graft model 21 , which allows investigators to utilize their cells and organs for transplantation studies with minimal graft rejection risk after transplantations. For example, a segment of Firefly rat’s intestine transplanted into WT animals for the treatment model of short bowel syndrome demonstrated stable engraftment using BLI 22 . In pancreatic islet transplantation studies, islets isolated from Firefly rats are transplanted into WT animals and the engraftment is tracked by measuring the luminescent intensities over the long-term observation period. The effect of the various treatments on the engraftment of transplanted islets can be quantified by the BLI23–26.
While many studies confirmed the low immunogenicity of the tissues from Firefly rats 21 , the functionality of the tissue and cells retrieved from Firefly rats has yet to be thoroughly investigated. Because the major goal of the transplantation is to improve the lost function by replacing the organs and cells, the function of the donor organs and cells should be assessed and confirmed unaffected by the genetic changes. For example, obtaining fully functional islets in islet transplantation studies is a requisite for its success. Therefore, in this study, specifically for the use of islets from Firefly rats, we examine the effect of Luc expression on the changes in morphology and function of the islets. Our finding will add to the fundamental knowledge necessary for assessing the graft function after islet transplantations when investigators use islets from Firefly rats.
Materials and Methods
Overview of the Study
An overview of the study is described in Fig. 1. Age-matched Luc (+) rats and Luc (–) rats were prepared to investigate the effect of Luc expression on the islet phenotype and function. The islet function–related phenotypes in the native pancreas were examined in vivo, including non-fasting serum glucose, growth curve, and glucose tolerance test. Animals were then subjected to islet isolations, and the in vitro biological analyses in isolated islets were performed, including morphology, cell type composition, metabolism, and function.

Overview of the study. Green-colored rats and islets are wild type without Luc expression; blue-colored Luc rats and islets express Luc.
Firefly LEW Rats
The first “Firefly rats” were generated by Eiji Kobayashi, one of our authors, and his team in 2006. In these Luc-Tg rats named Firefly rats, the Luc reporter gene is ubiquitously expressed under the control of constitutively active ROSA26 promoter in inbred LEW rats
21
. The strain was given to City of Hope and maintained in the Animal Resources Center of Beckman Research Institute at City of Hope. In our study, male hemizygote Firefly rats were used because fertility is known to be reduced in homozygotes within several generations; fertility in hemizygotes is similar to those of WT animals. Phenotyping was performed by the BLI at 4 weeks old using a Lago X imaging platform (Spectral Instruments Imaging, Tucson, AZ, USA) to select Luc-Tg rats. Bioluminescence signals were captured over 60 s per image under general anesthesia, 5 min after the intraperitoneal administration of D-luciferin (1.5 mg/body,
Observation of Rats for Non-Fasting Blood Glucose and Body Weight
Age-matched WT and Luc-Tg LEW rats were prepared (n = 9 per group). Non-fasting blood glucose and body weight (BW) were measured weekly at 12–2 pm in rats between the ages of 5 and 17 weeks.
In Vivo Assessments of Glucose Homeostasis
An intraperitoneal glucose tolerance test (IPGTT) and serum C-peptide measurement were performed as in vivo functional assessments in 16-week-old WT (n = 9) and Luc-Tg rats (n = 9). Recipient rats fasted for 6 h before the intraperitoneal administration of glucose solution at 2 g glucose/kg BW to assess glucose tolerance 27 . Blood glucose was measured at 0, 15, 30, 60, and 120 min after the glucose injection. Area under the curve (AUC) of the blood glucose was calculated between 0 and 120 min. Blood samples were obtained at pre-glucose injection and 60 min after the glucose injection to collect serum samples. Rat serum C-peptide was measured using a rat C-peptide ELISA kit (Mercodia, Uppsala, Sweden). The stimulation index of the serum C-peptide was calculated in each rat as the ratio of C-peptide at pre-glucose injection over C-peptide at 0 min.
Preparation of Isolated Islets
WT and Luc-Tg rats at the age of 16 weeks were used for islet isolation. Islets were isolated using our standard procedure, as described previously28,29. Briefly, collagenase (2.5 mg/ml; Sigma-Aldrich, St. Louis, MO, USA) dissolved in ice-cold Hanks’ balanced salt solution (HBSS; Sigma-Aldrich) was injected into the pancreatic duct through the common bile duct, followed by pancreas dissection and enzymatic digestion. Islets were isolated through density gradient centrifugation in Dulbecco’s phosphate-buffered saline (DPBS) (Corning Life Science, Corning, NY, USA); supplemented with 1% fetal bovine serum (FBS) (Corning Life Science), 10 mM HEPES (FUJIFILM Irvine Scientific, Santa Ana, CA, USA), and 1× penicillin-streptomycin-glutamine (Gibco, Waltham, MA, USA) and Histopaque-1077 (density: 1.077 g/ml; Sigma-Aldrich); and then hand-picked for purity. In preparation for the subsequent in vitro assays, islets were allowed to recover overnight at 27°C in CMRL 1066 culture media (Corning Life Sciences) supplemented with 0.5% human serum albumin, 0.1 μg/ml insulin-like growth factor-1 (Cell Sciences, Newburyport, MA, USA), and 10 U/ml heparin sodium (Sagent Pharmaceuticals, Schaumburg, IL, USA) in a 5% CO2 incubator. Islets from individual donors were cultured in 10 cm dishes separately with 8 ml of culture media/dish.
In Vitro Bioluminescence Images of Isolated Islets
Fifty islets were incubated in a 24-well plate with
Analysis of Islet Yield and Islet Size
Islets were transferred to a 35-mm dish and imaged in the bright field (microscope: SZ61, Olympus, Tokyo, Japan; camera: Infinity2, Teledyne Lumenera, Ottawa, ON, Canada). Captured images were analyzed using cellSens software (Olympus) to measure the islet particulate number and two-dimensional (2D) area of each islet. Islet area data were converted into a 2D circular model, which assumes that the islets are spherical (thus circular in 2D), to calculate the islet diameter. Islet area data were also converted to the estimated islet equivalent (IEQ). One IEQ is defined as an islet 150 µm in diameter 30 ; therefore, the 2D area of 1 IEQ is 17,671 µm2 (=75 × 75 × π).
Histological Assessment of Isolated Islets
Isolated islets were fixed in 10% formalin (Thermo Fisher Scientific, Waltham, MA, USA) and embedded in 3% agar (Sigma-Aldrich) for subsequent paraffin embedding and sectioning. For the immunofluorescence staining, paraffin sections were deparaffinized and rehydrated, followed by antigen retrieval using Antigen Unmasking Solution (Vector Laboratories, Burlingame, CA, USA). After a 20-min blocking at room temperature [1% bovine serum albumin, 10% fetal donkey serum (Jackson ImmunoResearch Laboratories, West Grove, PA, USA), and 0.2% saponin (Sigma-Aldrich) in PBS], slides were incubated overnight at 4°C with primary antibodies (Supplemental Table 1). Slides were washed in PBS with 0.1% Tween (Sigma-Aldrich) and incubated with secondary antibodies and DAPI (Sigma-Aldrich) (Supplemental Table 1). The slides were mounted with Fluorescent Mounting Medium (Dako, Santa Clara, CA, USA). Images were captured using ZEISS inverted LSM 700 microscope and ZEN lite digital imaging software (Carl Zeiss, Oberkochen, Germany). To quantify the cell populations of alpha and beta cells within the islets, immunohistochemistry (IHC) staining was performed on Ventana Discovery Ultra IHC autostainer (Roche Diagnostics, Indianapolis, IN, USA) using the primary antibody (rabbit anti-insulin monoclonal antibody, dilution at 1:500; Cell Signaling, Boston, MA, USA) and Discovery HQ-HRP-DAB detection system (DISCOVERY anti-Rabbit HQ and DISCOVERY anti-HQ HRP; Roche Diagnostics). Images were captured using an IX50 microscope (Olympus) and cellSens software (Olympus). The area-based quantification of IHC-positive cells was performed in each islet (% to islet area); the average percentage to islet area of 10 islets was assessed from a single donor islet preparation.
Insulin Content of Isolated Islets
Approximately 100 IEQ of islets were lysed in 1 ml of cell lysate buffer composed of ethanol and hydrochloric acid31,32. The insulin concentration of the islet lysate was measured using a rat insulin ELISA kit (Mercodia) and normalized by IEQ applied.
Metabolic Assessment of Isolated Islets
The oxygen consumption rate (OCR) of isolated islets was measured using a Seahorse XFe24 analyzer (Agilent Technologies)33,34. After the pre-incubation of the islets at 37°C in a 5% CO2 incubator, islets (70–120 IEQ) were plated on a Seahorse XFe islet capture plate, followed by another 1-h incubation at 37°C in a non–CO2 incubator. The islet OCR was measured at baseline (3 mM glucose for 45 min), followed by glucose stimulation (20 mM glucose for 53 min). Measurements were repeated every 7.5 min until the end of the experiment. The basal OCR (OCR_basal) was calculated as the average OCR obtained on incubation in 3 mM glucose solution. The maximum OCR was obtained at least 1 h after the initiation of glucose stimulation. The OCR fold increase was defined as the maximum OCR/basal OCR (OCR_SI). OCR data were normalized by the IEQ applied.
Functional Assessment of Isolated Islets: Glucose-Stimulated Insulin Secretion (GSIS)
Approximately 100 IEQ per well in a 24-well plate cell culture insert (Millipore Sigma, Burlington, MA, USA) were preincubated in 1 ml of Krebs-Ringer buffer (KRB) solution containing 2.8 mM glucose for 4 h at 37°C in a 5% CO2 incubator, followed by a 1-h incubation in 1 ml of KRB solution containing 28 mM glucose. The buffer was collected after each incubation to measure insulin concentration using a rat insulin ELISA kit (Mercodia). Stimulation index (SI_GSIS) was defined as the ratio of high insulin secretion over low insulin secretion.
Gene Transduction Into Isolated Islets by Adeno-Associated Virus (AAV)
The pAAV-CMV-eGFP vector construct was co-transfected into HEK-293 cells together with pAAV_KP1, a packaging plasmid containing the AAV rep and cap genes and pHelper, an adenoviral helper plasmid, to produce AAV capsid variant, AAV-KP1 35 . The AAV-CMV-eGFP vector harvested at 72 h after transfection was precipitated with polyethylene glycol (PEG) and purified using the AAVpro Purification Kit based on the manufacturer’s recommendation (Takara Bio, Shiga, Japan). Physical vector titer was 4.8 × 10⁷ IU/ml, determined by quantitative polymerase chain reaction (qPCR) of the purified vector preparation (Addgene, Watertown, MA, USA). Four hundred islets isolated from the WT LEW rats were seeded in 1 ml of CMRL-based media described above in a 24-well plate and co-cultured with different concentrations of AAV-KP1-CMV-eGFP (0, 1.5 × 10⁵ and 1.5 × 10⁶ virus/well) at 37°C for 48 h. Gene induction was examined by immunofluorescence images using the anti-GFP antibody; details are described in section “Histological Assessment of Isolated Islets.”
Islet Transplantations
Islets were transplanted into a prevascularized subcutaneous site of LEW rats and co-transplanted with a scaffold mesh as described in our established method 26 . Female WT LEW rats (10–16 weeks old) were used for recipients, and a prevascularized subcutaneous site was created with the fibroblast growth factor–impregnated lyophilized agarose disc implantation for a week prior to the islet transplantation. Diabetes was induced by the single intravenous injection of streptozotocin at 60 mg/kg (Sigma-Aldrich) 4 days before transplantation, and blood glucose >400 mg/dl was confirmed in the recipients before islet transplantations. Luc (–) and Luc (+) islets were isolated from LEW rat donors and cultured overnight at 27°C in a 5% CO2 incubator for recovery before the transplantations. Six hundred islets with 12 µl of thrombin-fibrin gel were loaded between 7 × 7-mm Vicryl mesh layers (VICRYL® Woven Mesh; Ethicon, Somerville, NJ, USA) and transplanted into the prevascularized sites of the recipients (n = 4 for Luc (–) islet grafts and n = 5 for Luc (+) islet grafts). Recipients were monitored for non-fasting blood glucose and BW changes, twice a week for a month. After the completion of the observation, islet grafts were resected for histology assessments in hematoxylin and eosin (HE) and IHC for insulin-positive cells. IHC was performed on Ventana Discovery Ultra IHC autostainer as described above. Images were captured using an IX50 microscope (Olympus) and cellSens software (Olympus).
Statistical Analysis
Comparisons between the two factors were analyzed using the Student’s t test. All statistical analyses were performed using JMP 16.2.0 software (SAS Institute, Cary, NC, USA). A P < 0.05 was considered significant.
Results
Firefly Rats Exhibit Ubiquitous Expression of Luc in the Whole Body, Including Islets
Luc gene was inserted under the ROSA26 promoter to generate the Firefly rats and is ubiquitously expressed in the whole body
21
. We maintain Luc-Tg rats as hemizygotes by breeding with Luc-Tg LEW males and WT LEW females; half of the offspring express Luc. The phenotyping by injection of
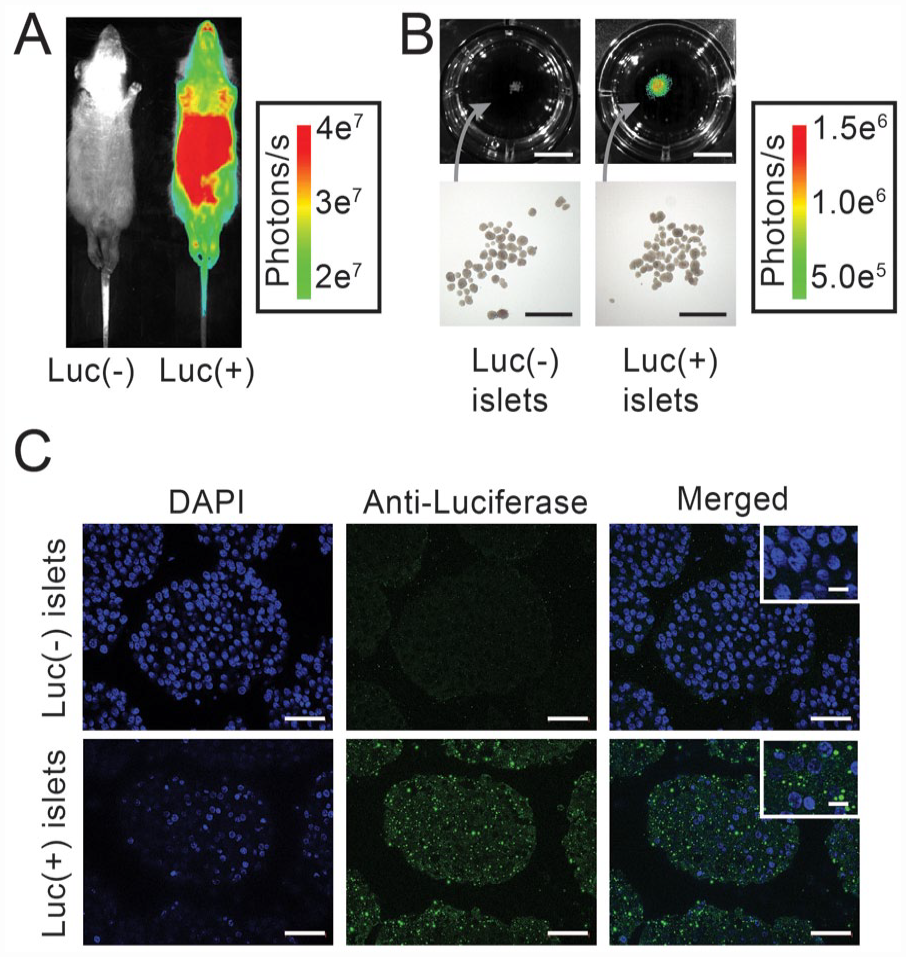
Ubiquitous expression of luciferase in Firefly rats. (A) The phenotyping by injection of
Expression of Luc Does Not Affect In Vivo Glucose Homeostasis
In vivo glucose homeostasis is determined by multiple factors, including the islet function in the native pancreas, as well as the insulin sensitivity of the tissues. Therefore, we examined the effect of ubiquitous Luc expression in the body on in vivo glucose homeostasis and compared the non-fasting blood glucose level between Luc (+) rats and Luc (–) rats; we found identical curves within the observation period of 5–16 weeks old (Fig. 3A), suggesting introduction of the Luc gene did not affect the glycemic balance. Glucose tolerance test and its quantification by AUC showed no statistical differences between the two groups (Fig. 3B, C; P = 0.5307 in AUC analysis). Islet function measured by the glucose-stimulated C-peptide secretion into the systemic circulation also exhibited no statistical differences between the groups (Fig. 3D; P = 0.4106 in basal and P = 0.9457 in glucose-stimulated media). The stimulation index also demonstrated no statistical significance (Fig. 3E; P = 0.1410).

Effect of luciferase expression on in vivo glucose homeostasis. (A) Non-fasting blood glucose level of Luc (–) rats and Luc (+) rats (5–17 weeks old). n = 9. (B) Intraperitoneal glucose tolerance test at 16 weeks old. n = 9 per group. (C) AUC quantification of intraperitoneal glucose tolerance test between 0 and 120 min. (D) In vivo islet function measured by glucose-stimulated C-peptide secretion. n = 9 per group. (E) Stimulation index of C-peptide secretion. n = 9 per group. n.s.: no statistical significance in the comparison of two groups using the Student’s t test. AUC: area under the curve.
Expression of Luc Does Not Alter the Islet Number, Size, and Endocrine Cell Composition
As a primary critical determinant in the islet transplantation setting is the islet function, the characterization of isolated islets from Luc (+) and Luc (–) donors is essential when considering their use in islet transplantation studies. Islet number, evaluated by the absolute islet yield as well as normalized by the BW, did not show the statistical difference [675 ± 62 IEQ (Luc (–)) vs. 685 ± 96 IEQ (Luc (+)), P = 0.9319, Fig. 4A; 1.59 ± 0.13 IEQ/BW-g (Luc (–)) vs 1.61 ± 0.22 IEQ/BW-g (Luc (+)), P = 0.9068, Fig. 4B]. The average size of isolated islets from Luc (+) and Luc (–) donors was similar [1.78 ± 0.06 IEQ/islet (Luc (–)) vs 1.85 ± 0.07 IEQ/islet (Luc (+)), P = 0.4214, Fig. 4C]; furthermore, both groups showed similar islet size distribution in all specific size ranges examined (Fig. 4D). Histological analysis revealed insulin-producing beta cells, the key endocrine component in islets, a similar distribution, and alignment within the isolated islets from Luc (+) and Luc (–) donors (Fig. 4E) and showed no statistical difference in percentage area/islets [60.0 ± 4.1% (Luc (–)) vs 61.6 ± 2.7% (Luc (+)), P = 0.7395, Fig. 4F]. Insulin content data in the isolated islets further supported the similar population of beta cells within Luc (+) and Luc (–) islets [24.2 ± 2.0 ng/IEQ (Luc (–)) vs 27.0 ± 1.0 ng/IEQ (Luc (+)), P = 0.2278, Fig. 4G].

Effect of Luciferase expression on the morphology of isolated islets. (A) Islet yield (IEQ) obtained from rat isolation. n = 9 per group. (B) Normalized islet yield by the body weight of islet donors [IEQ/BW (g)]. n = 9 per group. (C) The average size of isolated islets. n = 9 per group. (D) Islet size distribution in specific size ranges. The percentage population to the total islets by specific size range was calculated in individual rat isolations. n = 9 per group. (E) Representative IHCs with anti-insulin antibody of Luc (–) islets (left panels) and Luc (+) islets (right panels) demonstrate a similar distribution of insulin-positive beta cells within islets. (F) Area analysis of insulin-positive beta cells within islets expressed as percentage area to the whole islet area. (G) Insulin content measured in the islet lysate of Luc (–) islets and Luc (+) islets. n = 9 per group. n.s.: no statistical significance in the comparison of two groups using the Student’s t test. BW: body weight; IEQ: islet equivalent; IHC: immunohistochemistry; IEQ: islet equivalent.
Expressing Luc Does Not Affect the Metabolism and Function in Isolated Islets
Islet metabolism and function are the important factors determining the islet quality in post-isolation/pre-transplantation assessments. We examined glucose-stimulated islet metabolism measured by OCR. Both basal OCR and stimulated OCR did not demonstrate a significant difference between Luc (+) islets and Luc (–) islets (Fig. 5A). The stimulation index of OCR, calculated as the ratio of glucose-stimulated OCR to the basal OCR, also showed no statistical difference between the two groups (Fig. 5B). Next, we evaluated the insulin-secreting function of isolated islets by GSIS. Insulin secretion in both low glucose and high glucose conditions did not demonstrate a significant difference between the Luc (+) islets and Luc (–) islets (Fig. 5C). The stimulation index of GSIS, calculated as the ratio of high glucose–stimulated insulin secretion to the basal insulin secretion, exhibited no statistical difference between the two groups.

Effect of luciferase expression on the metabolism and function of isolated islets. (A) Metabolism of isolated islets measured by OCR. OCR of Luc (–) islets and Luc (+) islets in basal (left) and glucose-stimulated media (right). n = 9 per group. (B) Stimulation index of OCR calculated by fold increase in glucose-stimulated media over basal. n = 9 per group. (C) Insulin secretion of isolated islets in basal (left) and glucose-stimulated media (right). n = 9 per group. (D) Stimulation index of insulin secretion calculated by fold increase in glucose-stimulated media over basal. n = 9 per group. n.s.: no statistical significance in the comparison of two groups using the Student’s t test. OCR: oxygen consumption rate.
Expression of Luc in Islet Graft Does Not Affect In Vivo Transplantation Outcomes
Luc (+) and Luc (–) islets were transplanted with our established method into the prevascularized subcutaneous site of diabetic LEW rats and co-transplanted with a scaffold mesh 26 . We used the marginal number of islet grafts at 600 islets per recipient, demonstrating the gradual decrease in blood glucose (Fig. 6A) and increase in body weight (Fig. 6B) within a month post-transplant. The blood glucose and BW changes did not illustrate clear differences between recipients with Luc (+) islet grafts and Luc (–) islet grafts. Histology results also did not identify the engraftment difference between Luc (+) and Luc (–) islet grafts (Fig. 6C).

In vivo transplantations of Luc (+) and Luc (–) islets. Luc (+) and Luc (–) islets from LEW rats were subcutaneously transplanted into the prevascularized site of diabetic WT LEW rats and co-transplanted with a scaffold. (A) Post-transplant blood glucose changes over a month. (B) Post-transplant body weight changes over a month. n = 4 for Luc (–) islet grafts and n = 5 for Luc (+) islet grafts. Overall changes are expressed with smooth lines (spline method with lambda = 0.2; color bands demonstrating the confidence of fit). (C) Representative histology sections of Luc (+) and Luc (–) grafts in HE and IHC (anti-insulin). Arrowheads indicate graft sites. c: cutaneous tissue; HE: hematoxylin and eosin; IHC: immunohistochemistry; LEW: Lewis; s: subcutaneous tissue; *: scaffolds; WT: wild type. Scale bar: 1 mm for Overview panels and 100 µm for Enlarged panels.
Discussions
In this study, we demonstrated that the Luc expression under the ROSA26 promoter in “Firefly rats” does not alter the pancreatic islet morphology, metabolism, and function. This is critical knowledge when we use the Firefly rats as islet donors. ROSA26 is a non-coding gene and is considered not to affect the expression of other endogenous genes. However, to the best of our knowledge, this is the first report to demonstrate that islet morphology, function, and metabolism of Luc (+) islets from Firefly rats are similar to those of Luc (–) islets, allowing for the use of Firefly rats as donors for fully functional islets.
Our study demonstrated a similar in vivo glucose homeostasis in Luc (+) and Luc (–) rats. Although the beta cell function in the native pancreatic islets can be one of the primary determinants for in vivo glucose homeostasis, other factors, including the insulin sensitivity of the tissues, also contribute to overall glycemic control. Therefore, we further examined the morphology and function of isolated islets from Luc (+) and Luc (–) donors in conditions excluding the influences of non-islet factors, such as tissue insulin sensitivity. Our study showed comparable results between Luc (+) islets and Luc (–) islets in function and metabolism. The assessments used in this study were well-established methods in the quality control of isolated islets, including OCR and GSIS31,37. The equivalent morphology, metabolism, and function of isolated islets from Luc (+) donors and Luc (–) donors indicate that the islets from Firefly rats are suitable not only for the BLI but also for the post-transplant functional assessments.
There are two major contributions of in vivo bioluminescence imaging to experimental transplantation studies: qualitative assessments to demonstrate the existence of the cells (organs) and quantitative assessments of bioluminescence to examine the longitudinal changes of the cell viability/number. One example of the qualitative assessment is the post-transplant graft detection; when Luc (+) intestine was transplanted into the WT recipient, the graft was detectable as a luminescence-emitting segment in the non-luminescence-emitting WT recipient 22 . Examples of the quantitative analysis of graft viability/engraftment include islet graft tracking in the post-transplant period23–26. Graft deterioration can be assessed in longitudinal, multiple-timepoint assessments in the same animal. In addition, we demonstrated the utility of islets isolated from Firefly rats in assessing the efficacy of various treatments, including oxygen inhalation23,24, oxygenation device 25 , and scaffold 26 . Previous studies demonstrated that the isolated islets of similar number from Firefly and WT rats reversed diabetes when transplanted in diabetic rat recipients, suggesting that the islets from Firefly rats were as functional as those from WT rats. However, no studies previously have directly confirmed this fundamental question. In this study, we confirmed the comparable function of the isolated islets from Firefly and WT rats in vitro. Furthermore, we subcutaneously transplanted Luc (+) islets and Luc (–) islets in diabetic LEW rats in vivo, demonstrating similar transplantation outcomes and engraftment. However, the number of transplantations was limited; thus, a large cohort study including several transplantation models (various sites and procedures) is needed to demonstrate that Luc (+) islets are equivalent to Luc (–) islets in regard to the post-transplant graft function. Nonetheless, this study focusing on pre-transplant islets is critical fundamental knowledge and represents the first step toward a robust animal study.
For in vivo tracking of transplanted islets using BLI, we can utilize the Luc-transgenic donors to isolate the islets. In addition to Firefly rats, multiple studies reported transgenic mouse lines containing the Luc gene under the regulation of insulin promoter13–16. In these mice, Luc is expressed specifically in beta cells, allowing investigators to quantify beta cell activities or beta cell mass. Another method to prepare Luc-expressing islets is to introduce the recombinant Luc gene under the control of the desired promoter (e.g., CMV promoter) in WT isolated islets in vitro using adenoviral or lentiviral vectors 38 . For example, AAV is a widely accepted method to introduce the designated genes into single cells. However, in theory, the efficiency of the AAV-induced gene transduction is lower in isolated islets compared with single cells because of the islet’s size. Since an islet consists of thousands of cells, the islet core is physically hard to reach by viruses in a co-culture condition. In addition, the gene transfection efficiency is largely determined by the multiplicity of infection, that is, the ratio of viral particles to the target cells; high virus concentration would induce a high infection rate and high expression of designated genes, leading to the high bioluminescence signal. Our data with AAV-GFP clearly demonstrated two issues, size and viral concentration. Thus, these are critical considerations in choosing the appropriate system for islet BLI. If we only require the qualitative analysis in BLI (i.e., for the detection of the location and the presence of the Luc-expressing islets), the efficiency of gene introduction may not be the critical parameter. However, if we require the quantitative analysis of the Luc-expressing islets, islets that consistently express Luc are a fundamental criterion. For such purpose, using ubiquitously Luc-expressing islets isolated from Luc (+) rats could be advantageous over the virus-assisted gene introduction into isolated islets. Virus-assisted Luc introduction could fluctuate in Luc expression due to multiple parameters, including islet size and virus concentration.
Major limitations using islets from Firefly rats in islet BLI include the contribution of non-islet cells to the light-intensity quantification. Because Luc is ubiquitously expressed in all tissues in Firefly rats, investigators should consider, particularly, the purity of the isolated islets. If proliferative cells, such as fibroblasts, are contaminated in the isolated islet preparations, post-transplant in vivo BLI data could include significant light intensity emitted from highly proliferating non-islet cell types. Investigators should consider using donors with insulin promoter regulating the Luc gene to precisely quantify islet-specific activities13–16.
In summary, Luc expression in Firefly rats does not affect islet the morphology, metabolism, and function. Therefore, Firefly rats are suitable donors in islet transplantation studies not only for bioluminescence imaging but also for functional assessment of the graft.
Supplemental Material
sj-jpg-1-cll-10.1177_09636897231182497 – Supplemental material for Ubiquitous Luciferase Expression in “Firefly Rats” Does Not Alter the Pancreatic Islet Morphology, Metabolism, and Function
Supplemental material, sj-jpg-1-cll-10.1177_09636897231182497 for Ubiquitous Luciferase Expression in “Firefly Rats” Does Not Alter the Pancreatic Islet Morphology, Metabolism, and Function by Nelson Gonzalez, Hiroyuki Kato, Wilma Tixi, Jose Ortiz, Chris Orr, Hung-Ping Shih, Hsun Teresa Ku, Jiing-Kuan Yee, Fouad Kandeel, Yoko Mullen, Eiji Kobayashi and Hirotake Komatsu in Cell Transplantation
Supplemental Material
sj-xls-2-cll-10.1177_09636897231182497 – Supplemental material for Ubiquitous Luciferase Expression in “Firefly Rats” Does Not Alter the Pancreatic Islet Morphology, Metabolism, and Function
Supplemental material, sj-xls-2-cll-10.1177_09636897231182497 for Ubiquitous Luciferase Expression in “Firefly Rats” Does Not Alter the Pancreatic Islet Morphology, Metabolism, and Function by Nelson Gonzalez, Hiroyuki Kato, Wilma Tixi, Jose Ortiz, Chris Orr, Hung-Ping Shih, Hsun Teresa Ku, Jiing-Kuan Yee, Fouad Kandeel, Yoko Mullen, Eiji Kobayashi and Hirotake Komatsu in Cell Transplantation
Footnotes
Acknowledgements
We thank Sung Hee Kil, PhD, for critical reading and editing of the manuscript.
Availability of Data and Materials
All data required to evaluate the conclusions in the study are present in the paper and/or the Supplementary Materials. Additional data related to this paper may be available to researchers upon request.
Ethical Approval
This study was approved by the institutional review board of Beckman Research Institute, City of Hope. All the experimental animal procedures in this study were conducted in accordance with the Institutional Animal Care and Use Committee of Beckman Research Institute, City of Hope.
Statement of Human and Animal Rights
This article does not contain any studies with human or animal subjects.
Statement of Informed Consent
There are no human subjects in this article and informed consent is not applicable.
Declaration of Conflicting Interests
The author(s) declared no potential conflicts of interest with respect to the research, authorship, and/or publication of this article.
Funding
The author(s) disclosed receipt of the following financial support for the research, authorship, and/or publication of this article: This study was supported in part by grants from the Nora Eccles Treadwell Foundation to HKo (no grant number), JDRF to HKo (3-SRA-2021-1073-S-B), and National Institutes of Health to HKo (R03DK129958-01) and Wanek Family Project Innovative Grants Program to J-KY (no grant number). Research reported in this publication included work performed in the Pathology Core supported by the National Cancer Institute of the National Institutes of Health under grant number P30CA033572. The content is solely the responsibility of the authors and does not necessarily represent the official views of the National Institutes of Health.
Supplemental Material
Supplemental material for this article is available online.
References
Supplementary Material
Please find the following supplemental material available below.
For Open Access articles published under a Creative Commons License, all supplemental material carries the same license as the article it is associated with.
For non-Open Access articles published, all supplemental material carries a non-exclusive license, and permission requests for re-use of supplemental material or any part of supplemental material shall be sent directly to the copyright owner as specified in the copyright notice associated with the article.