
Abstract
In this study, we developed an in-line methodology that combines analytical with pharmacological techniques to characterize metabolites of human histamine H4 receptor (hH4R) ligands. Liquid chromatographic separation of metabolic mixtures is coupled to high-resolution fractionation into 96- or 384-well plates and directly followed by a cell-based reporter gene assay to measure receptor signaling. The complete methodology was designed, optimized, validated, and ultimately miniaturized into a high-density well plate format. Finally, the methodology was demonstrated in a metabolic profiling setting for three hH4R lead compounds and the drug clozapine. This new methodology comprises integrated analytical separations, mass spectrometry, and a cell-based signal transduction–driven reporter gene assay that enables the implementation of comprehensive metabolic profiling earlier in the drug discovery process.
Keywords
Introduction
The four human histamine receptors—hH1R, hH2R, hH3R, and hH4R—belong to the G-protein-coupled receptor (GPCR) family (IUPHAR database [http://www.iuphar-db.org/DATABASE/FamilyMenuForward?familyId=33]). GPCRs are integral membrane proteins that characteristically consist of 7-transmembrane (7TM) alpha helices. hH1R and hH2R are successful drug targets in the treatment of allergy and peptic ulcers, respectively. The hH4R gene was cloned in 2000, and the encoded receptor protein shares 37% amino acid similarity with its closest homolog hH3R 1 but less than 20% similarity with hH1R and hH2R. 2 hH4R induces immune cell chemotaxis toward histamine, which strongly links this receptor to inflammatory processes. 3 Diseases such as pruritus (itch) and rheumatoid arthritis could potentially be treated with specific hH4R-modulating ligands, 4 and numerous synthetic hH4R ligands have been identified during the past decade.5–12 Importantly, these receptor ligands are metabolized upon in vivo administration. On one hand, this may result in pharmacologically active metabolites, responsible for the actual therapeutic effect. Pro-drugs, inactive compounds that are converted into biologically active metabolites, 13 are widely used and include drugs such as morphine, 14 diazepam, 15 and hydroxytamoxifen. 16 In addition, pharmacologically active metabolites prolong the mode of action of drugs. 17 In contrast, addition of chemical groups to improve hydrophilicity and subsequent clearance by the kidneys can sometimes have undesirable effects. Parent drug molecules can be converted into dangerous metabolites via subtle chemical changes. Risks of metabolite formation include toxicity, change or loss of selectivity and/or functional activity, deposition/accumulation of metabolites, irreversible metabolite action, and acquired ability to cross the blood-brain barrier.18–20 Despite these significant in vivo issues, a limited amount of data is published on metabolic products of ligands and their pharmacological properties. This is related to the elaborate and costly processes of metabolite production or synthesis, purification, identification, and finally pharmacological analysis. The required safety experiments are for this reason often postponed until a later phase (ADME) in the drug discovery process before entering clinical trials. As drug metabolites are also very important for in vivo action, metabolic profiling at an early stage in drug discovery is desirable. However, this requires integrated analytical and pharmacological methodologies. Single-compound solutions can be readily analyzed in various analytical or pharmacological assays, but compound mixtures (e.g., metabolic mixtures) need to be chromatographically separated before analysis. A relatively new approach for efficient mixture profiling is the so-called nano-fractionation or high-resolution fractionation approach.21–23 In this approach, mixtures are separated by liquid chromatography (LC), identified in parallel by mass spectrometry (MS), and analyzed in a biochemical assay after high-resolution fractionation. This type of fractionation actually tailors the fractionation to peak shapes of eluting compounds and enables accurate correlation of identity to bioactivity. However, this approach has been demonstrated only for robust biochemical/biophysical experiments and not for cell-based signaling assays. Therefore, we have now developed an integrated methodology that incorporates the use of analytical separations and mass spectrometric identification techniques in parallel with pharmacological analysis to characterize hH4R ligand metabolites after microsomal incubations. The high-resolution fractionation in multiple plate reader formats decouples fractionation from downstream pharmacological (cell-based) assays and consequently allows multiple independent end points to be investigated and correlated. The methodology is suitable to characterize metabolites of lead candidates early in the drug discovery process. This article reports the development, evaluation, validation, and miniaturization of high-resolution fractionation followed by the in-line, cell-based, signaling-driven, cAMP-responsive element β-galactosidase (CRE β-gal) reporter gene assay, whereas the full structure identification of metabolites is discussed elsewhere. 24
Materials and Methods
Materials
All buffer salts were of analytical grade and obtained from Merck, Fluka, or Sigma-Aldrich. Glucose-6-phosphate and glucose-6-phosphate-dehydrogenase were bought from Sigma-Aldrich (Zwijndrecht, the Netherlands). Nicotinamide adenine dinucleotide phosphate (NADPH) tetra sodium salt was purchased from Applichem (Lokeren, Belgium). Acetonitrile (ACN; LC/MS grade) was from Biosolve B.V. (Valkenswaard, the Netherlands). Formic acid (FA) was from Merck (Zwijndrecht, the Netherlands). Magnesium chloride hexahydrate was bought from Fluka (Zwijndrecht, the Netherlands). G418 and ortho-nitrophenyl-β-galactoside (ONPG) were from Duchefa (Haarlem, the Netherlands). Triton X-100, β-mercaptoethanol, and forskoline were purchased from Sigma Life Sciences (St. Louis, MO).
Standard Mixture
All optimization steps were performed with a standard mixture consisting of several hH4R ligands with different bioactivities (order of elution): histamine (Sigma Aldrich), A-940894, clobenpropit, pyrilamine (Sigma Aldrich), clozapine (Tocris, Bristol, UK), and thioperamide.25,26 Compounds with no supplier reference were synthesized in-house at the VU University Medicinal Chemistry department.
Liquid Chromatography for the High-Resolution Fractionation Approach
Fractionation of (metabolic) compound mixtures was performed using a Gilson 215 liquid handler controlled by in-house written software (“GilsLua”; source code available upon request). The liquid handler was modified to support polyetheretherketone (PEEK) high-performance liquid chromatography (HPLC) tubing on the movable arm and was programmed to fractionate eluents into 96- or 384-tissue culture plates. The connecting PEEK tubing (internal diameter of 500 µm) exiting the UV detector to the high-resolution fractionation housed a silanol-deactivated silica capillary (internal diameter of 250 µm). This capillary tip contacted the edges of the wells during high-resolution fractionations to avoid hanging drops.
For the separations, 100-µL injections were performed in combination with chromatographic separations using a Shimadzu LC-20AB gradient pump (Duisburg, Germany) with a Waters (Milford, MA) xBridge C18 column (5-µm particles, 4.6 × 100 mm) and guard column. Separations occurred at 30 °C; mobile phase A was an H2O–ACN–formic acid (95%-5%-0.1%) mixture and mobile phase B an H2O–ACN–formic acid (5%-95%-0.1%) mixture. The flow rate used was 0.6 mL/min with the following gradient: 5 min at 2% B, in 15 min to 20% B, then in 15 min to 83.3% B, and then in 15 min to 98% B, finalized by 5 min at 98% B. UV detection of eluting compounds was at 210 nm with a Kratos Analytical (Manchester, UK) Spectroflow 757. After fractionation, 96-well tissue culture plates in low resolution (20 s/well) and high resolution (5 s/well) or 384-well tissue culture plates in high resolution (2.5 s/well) were subjected to different solvent evaporation approaches. Custom in-house plate lids were fabricated and used to prevent loss of frozen liquid from the well plates during evaporation under vacuum (20 mbar). Resulting dried high-resolution fractions were then reconstituted in 100 µL 50 mM Tris buffer or used directly for postfractionation cell seeding in cell culture medium.
During the optimization phase, we developed a script that allowed for heart-cutting chromatograms (e.g., fractionate only a selected time frame) to capture 8-min windows of a chromatographic separation in a single 96-well plate (5 s/well) or two chromatograms in one 384-well plate (2.5 s/well).
Mass Spectrometry
LC/MS was performed using electrospray ionization in positive-ion mode on a Shimadzu (‘s Hertogenbosch, the Netherlands) LC/MS ion-trap–time-of-flight hybrid instrument (IT-TOF). Full description of the experimental conditions is given elsewhere. 24
Microsomal Incubations/Metabolite Formation
Three of the four selected ligands were synthesized in house, whereas the well-known promiscuous hH4R agonist clozapine (8-chloro-11-(4-methylpiperazin-1-yl)-5H-dibenzo[b,e][1,4]diazepine) was purchased from Tocris. All ligands were dissolved in DMSO (stock solutions 10 mM) and stored at −80 °C.
The microsomal incubations were performed according to a modified protocol described in Reinen et al. 27 Liver microsomes (~20 mg/mL protein) were diluted 10-fold in buffer (50 mM KH2PO4 buffer containing 5 mM MgCl2 and 5 mM glucose-6-phosphate at pH 7.4 [adjusted with NaOH]) at 4 °C. Glucose-6-phosphate-dehydrogenase (5 activity units per mL) was added, followed by 100-µM compounds at room temperature (RT). Directly before the start of the incubations, 30 mM NADPH in 50 mM KH2PO4 buffer was prepared and the NADPH solution (10% [v/v] as compared with the starting total incubation volume) was added to the tubes at 37 °C. After 30, 60, and 90 min, additional NADPH (same volume, but a 10-mM concentration) was added to the incubations. After 2 h, 200% (v/v) as compared with the starting total incubation volume of ice-cold acetonitrile was added to all tubes followed by centrifugation for 5 min at 13 000 rpm for protein precipitation. The supernatants were then transferred to new tubes and evaporated in a Savant SpeedVac (Holbrook, NY). Prior to analysis, the samples were first redissolved in eluent B, and then this solution was supplemented with eluent A (30%/70% v/v ratio eluent B to A).
Cell Culture
SK-N-MC cells that express hH4R and contain the CRE-driven β-galactosidase reporter gene were maintained in Eagle’s minimum essential medium (EMEM) with Earle’s balanced salt solution without L-glutamine (Lonza BioWhittaker, Walkersville, MD) supplemented with 10% fetal bovine serum (FBS), 0.1 mg/mL streptomycin, 100 U/mL penicillin, 1% glutamine, 1 mM sodium pyruvate, 1× nonessential amino acids, and 600 µg/mL G418 at 37 °C in 5% CO2. 28
cAMP Response Element β-Galactosidase Reporter Gene Assay
Standard mixture or metabolite fractions in 50 mM Tris-HCl (pH 7.4 at RT) were added to a 96-well plate containing approximately 5 million cells and incubated overnight at 37 °C in 5% CO2. Alternatively, the metabolite fractions were spotted and freeze-dried directly on 96- or 384-well cell culture plates. Next, ~20 000 cells/well were seeded directly into these plates (i.e., direct plating) and incubated for 6 h at 37 °C in 5% CO2. All incubations were in serum-free culture medium supplemented with 1 µM forskolin. The cells and metabolite fractions were coincubated with 30 nM of the hH4R agonist histamine to measure competitive antagonism. Incubations were terminated by discarding the medium and adding 50 to 100 µL substrate buffer (100 mM sodium phosphate buffer [pH 8.0], 4 mM ONPG, 0.5% Triton X-100, 2 mM MgSO4, 0.1 mM MnCl2, and 40 mM β-mercaptoethanol). Lysed cells were incubated overnight at 4 °C followed by an additional 3 h at RT the next day before β-galactosidase activity was determined at 420 nm (96-well) with 700 nm reference with a Bio-Tek (Winooski, VT) PowerWaveX340 plate reader or at 425 nm (384-well) with a Victor 3 multilabel reader (PerkinElmer, Waltham, MA).
Results and Discussion
Pharmacological analysis of newly designed and synthesized drugs is the first step in drug discovery. However, after in vivo administration, P450 enzymes in the liver metabolize drugs. An early assessment of possible metabolite formation and function is very important. The aim of this study was to develop and optimize a methodology to screen metabolites of potential drug molecules for pharmacological activity. A chromatographic separation approach with high-resolution fractionation was followed by a cell-based hH4R signaling assay in SK-N-MC cells. 28 Mass spectrometry identification was performed in parallel. We used a standard mixture to evaluate and optimize the compatibility of the analytical and pharmacological parts and to eventually validate the new methodology. Furthermore, the functional assay was miniaturized into a 384-well format for a rapid, more efficient, and cost-effective profiling. Finally, the potential of the optimized methodology was demonstrated for analysis of hH4R ligand metabolite mixtures that were formed upon incubation with liver microsomes.
The hH4R is a Gαi protein-coupled receptor that inhibits adenylate cyclase activity and consequently decreases cAMP production in cells, resulting in decreased cAMP response element binding protein (CREB)–driven (reporter) gene transcription. The SK-N-MC cells were stimulated with 1 µM forskolin to directly increase adenylyl cyclase activity, which is required to detect inhibitory effects of Gαi protein activity. This setup allows measurement of both hH4R-mediated agonist and inverse agonist responses (traces “a” in Figs. 3 and 4 ). Competitive hH4R antagonists were identified in the presence of the agonist histamine (30 nM, EC80; traces “b” in Figs. 3 and 4 ).
Optimization of the CRE β-Galactosidase Reporter Gene Assay Readout
SK-N-MC cells were seeded 24 h or 48 h before ligand stimulation in 96-well plates at 50 000 or 30 000 cells/well, respectively, to obtain a semi-confluent monolayer. Culture medium was replaced with serum-free medium supplemented with 1 µM forskolin and the standard mixture of hH4R ligands. After a 6-h incubation period, the cells were lysed and the enzymatic β-galactosidase reaction with ONPG was performed at RT. However, the reaction was too slow to be measured on the same day as the ligand stimulation but too fast to allow overnight incubation (data not shown). Freezing (–20 °C) the plates denatured the β-galactosidase enzyme, whereas storage at 4 °C overnight slowed product formation but allowed convenient measurement after an additional 2- to 3-h incubation step at RT the next day.
Evaporation to Minimize Traces of Mobile Phase Constituents
The first objective was to make the chromatographic separation procedure compatible with the downstream CRE β-gal assay. Liquid chromatography and mass spectrometry require ACN and FA in the mobile phase. Different evaporation strategies were explored to minimize or exclude traces of mobile phase constituents and to determine the most efficient method. The 96-well plates with fractionated (20 s/well) standard mixture were subjected to three different methods and evaluated using the CRE β-gal assay: (I) direct transfer to the assay plate ( Fig. 1a ), (II) evaporation under medium vacuum ( Fig. 1b ), and (III) evaporation with a nitrogen flow on a heating block at 60 °C ( Fig. 1c ). For approaches II and III, the constituents of the wells were redissolved in the same volume as the original fractions with 50 mM Tris-HCl and subsequently added to the cells. Evaporation under vacuum reduced the background signal and resulted in a smoother graph compared with no evaporation ( Fig. 1a , b ). The limited capacity of only four plates per vacuum pump and desiccator and, moreover, a nonreproducible evaporation time of 24 to 48 h as well as sputtering effects (solvent sputtering sometimes out of the wells) made us decide not to continue approach II. Instead of our vacuum evaporation approach, a vacuum centrifuge could be used instead, when available. The large fluctuations caused by edge effects (more evaporation of ACN and FA) seen in approach I (but also approach II) made this approach not optimal for combining chromatographic separations to cell-based signaling assays. A 96-well nitrogen-blowing device supplemented with a heating block removed solvents after a few hours of evaporation. The drawback of this method was the edge effect fluctuation ( Fig. 1c ), possibly due to noncomplete evaporation of FA. Furthermore, the low throughput of one plate per run and the difficulty in creating a uniform flow over the wells prevented further testing. Finally, a freeze-drying method was tested, which had very high capacity and could be completed in an overnight run. For this, the fractionated plates were directly submitted for freeze-drying. During the freeze-drying process, the initiated evaporation cools down the solvents in the wells until they freeze (within ~5 to 15 minutes). After that, the complete freeze-drying process begins at RT until complete dryness the next morning. Our custom plate lids with a small 3-mm hole above each well facilitated freeze-drying and prevented the frozen contents of the wells to be ejected as frozen columns. Due to the combination of high capacity, convenient overnight freeze-drying, speed, and acceptable edge effects, the freeze-drying method was chosen for further optimization of the protocol. A subsequent high-resolution fractionation (5 s/well) was implemented, now over four 96-well plates ( Fig. 2a ). To maintain the same concentration in the wells (resolution now increased fourfold from 20 s/well to 5 s/well), four repeated injections of the standard mixture were fractionated over the same plates. Although agonists and inverse agonists can be distinguished in Figure 2a , edge effects are still visible. FA can cause these effects, but also other constituents in the CRE β-gal assay might be responsible, such as the volatile reducing agent β-mercaptoethanol. One way to cope with the edge effects was by correcting them using an algorithm. For this, the background signal from a plate column (eight wells) was measured, and subsequently the individual well deviations from the column mean were calculated. This correction was then applied to all columns of the plate ( Fig. 2b ) and to all experiments performed in a 96-well format. To detect hH4R antagonists, an EC80 concentration (30 nM) of the agonist histamine was added to each well of the same standard mixture ( Fig. 2c ).
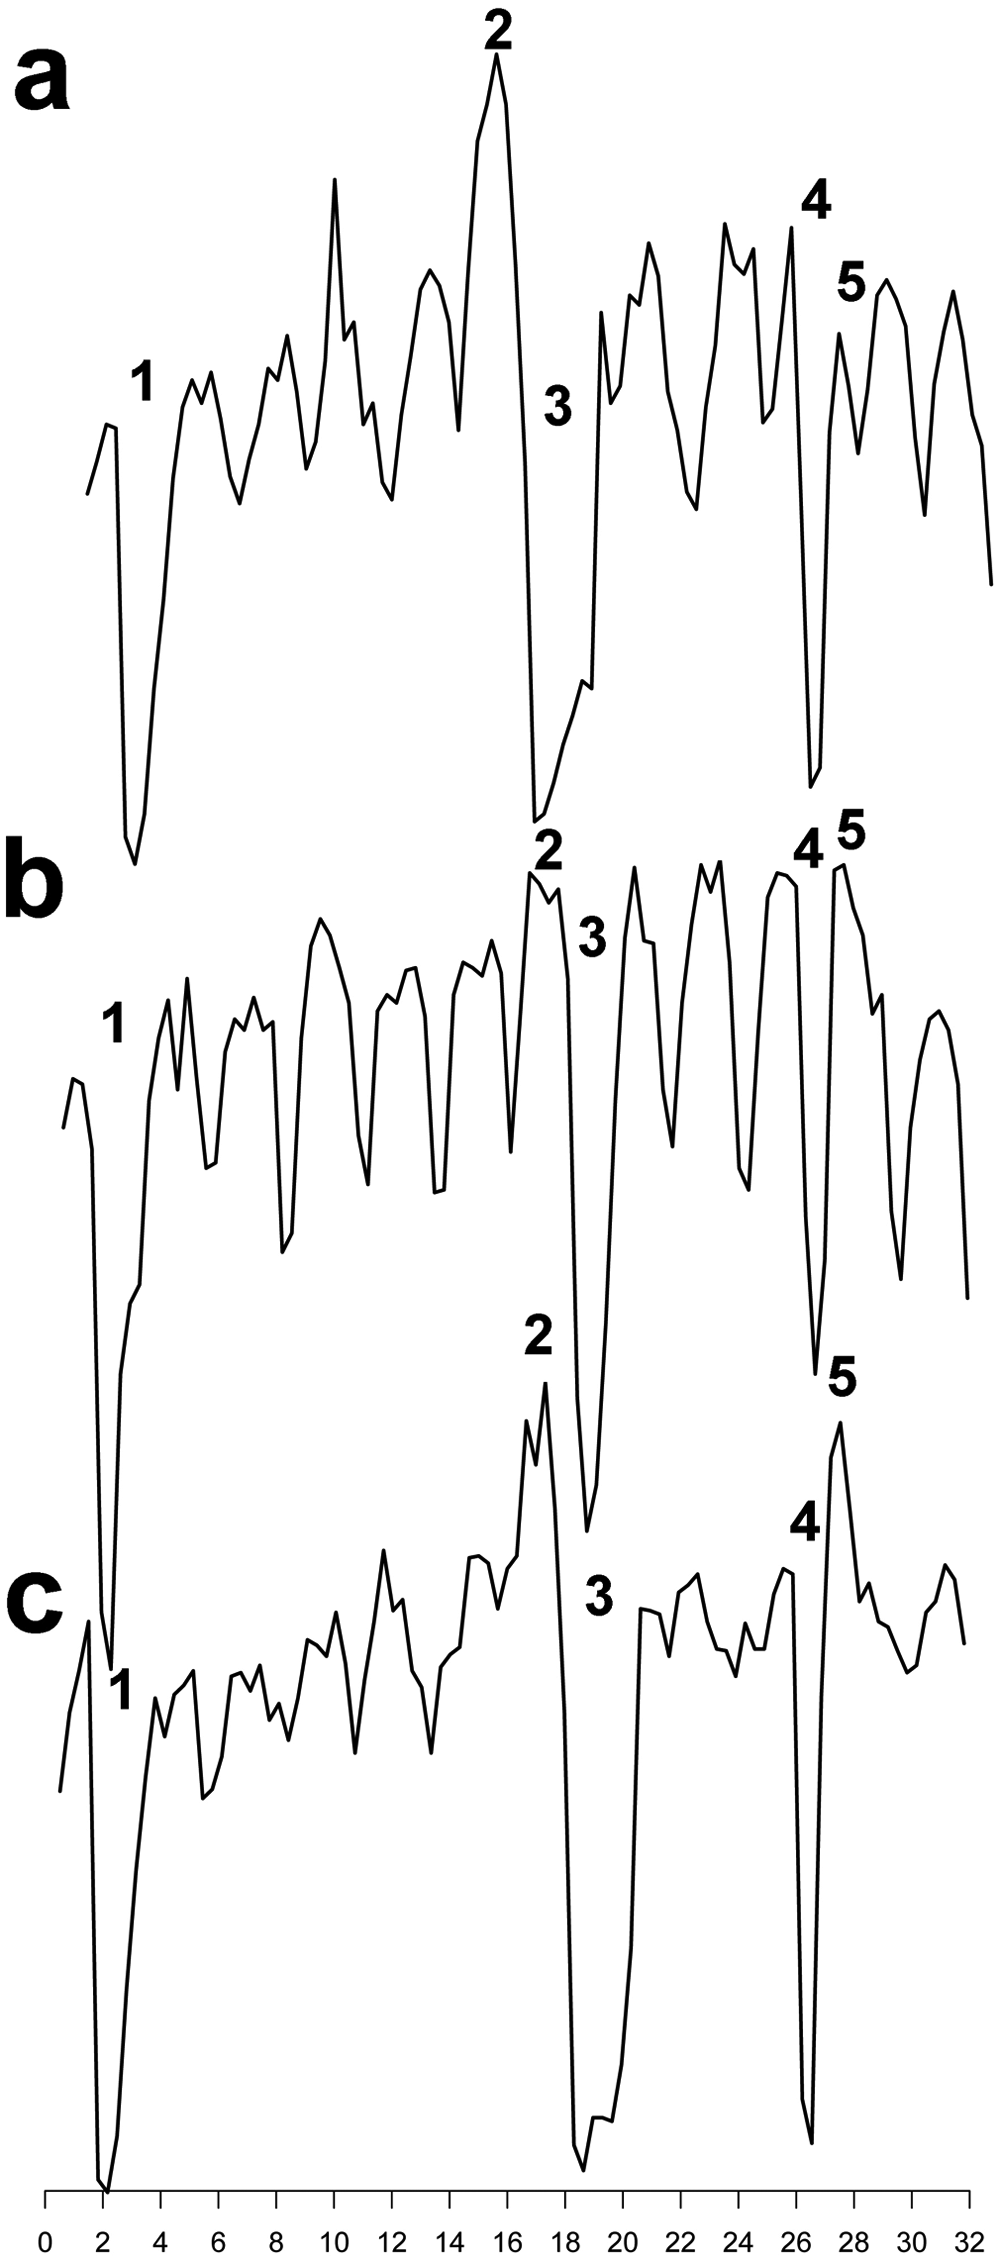
Evaluation of different evaporation methods for subsequent analysis with the cAMP-responsive element β-galactosidase (CRE β-gal) assay. Data shown are reconstructed bioassay chromatograms without baseline corrections. (
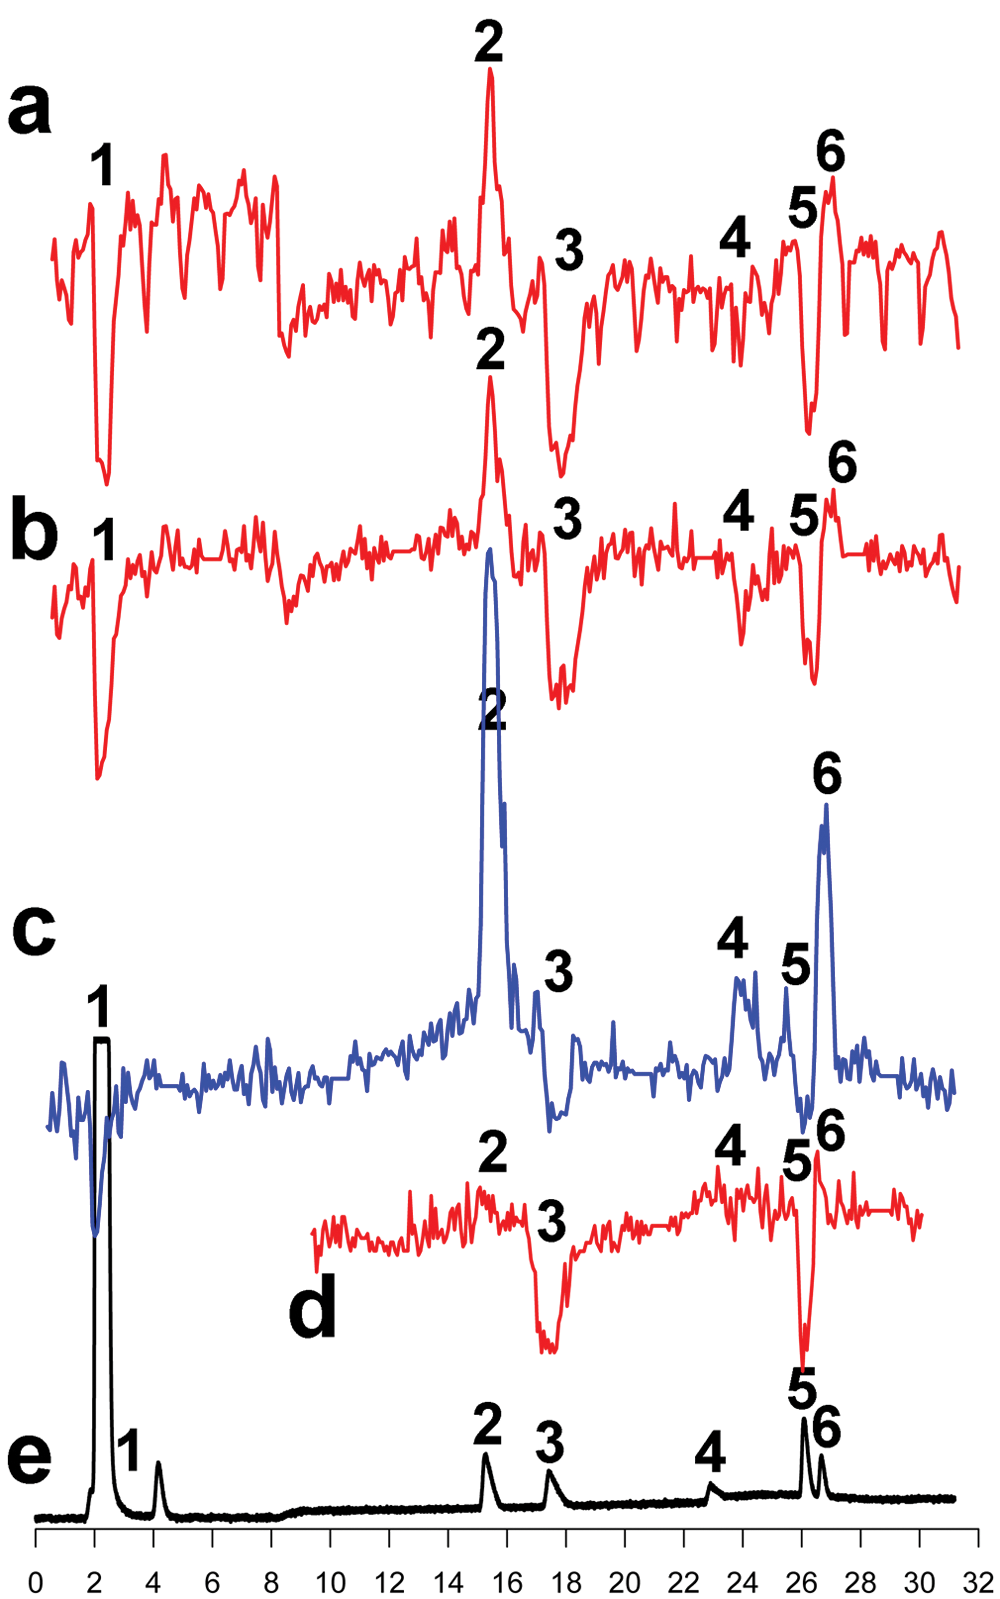
Evaluation of freeze-drying and direct plating method in the cAMP-responsive element β-galactosidase (CRE β-gal) assay. High-resolution fractionation (5 s/well) was used over four plates, and four repeated injections were used (10 µM for all compounds injected). Fractionations were followed by freeze-drying. Data shown are reconstructed bioassay chromatograms. (
Direct Plating Minimizes Pipetting
Routinely, freeze-dried fractions are redissolved and subsequently added to the preplated cells. However, this requires an additional pipetting step with associated error and time issues. Therefore, our next objective was to minimize the number of pipetting steps between fractionation and the CRE β-gal assay. To this end, the cells were seeded directly in the freeze-dried plates without prior redissolving of fractionated compounds/metabolites, so-called direct plating. An additional advantage was that the complete well content was used for screening, resulting in higher compound/metabolite concentrations. To ensure similar cell densities as in the preplating protocol, the cells were seeded at ~80 000 cells/well in 100 µL/well. The advantage of this protocol was that it provided more consistent compound amounts per well, circumvented an aspiration and pipetting step, allowed easier automation, and the entire assay could be performed within 24 hours. A potential concern of the direct plating approach is the redissolving capacity of the fractionated metabolite mixtures. Since we used compounds that contained protonated nitrogen atoms and their relatively polar metabolites, we did not have solubility problems. When working with very nonpolar compounds, however, or compounds known to have difficulty dissolving in aqueous solution, adding a small amount of 10% DMSO into the wells (with, for example, a contactless micropipetting/spotting robot or by post–column infusion during separation) before fractionation will ensure good solubility since a film layer of DMSO will be formed in the wells after evaporation. Cell morphology and adherence were monitored by microscopy. No decrease in cell viability or adherence was apparent between normal and direct plating. Furthermore, the CRE β-gal assay was also not affected by this direct plating method. We performed the CRE β-gal assay for the ~10- to 30-min time frame (two 96-well plates) of the chromatographic run ( Fig. 2d ). The direct plating protocol gives similar results as the transfer plating protocol. Concentration-response curves of the hH4R agonists histamine, clobenpropit, and clozapine were analyzed in the direct plating protocol to evaluate their potency values. The pEC50 values (histamine, 8.1 ± 0.02; clobenpropit, 7.7 ± 0.1; clozapine, 6.8 ± 0.02) were comparable with previously reported data in the same SK-N-MC cell line. 26 The introduction of direct plating of living cells in freeze-dried plates requires less manipulation and is a major advantage for both assay duration and the ability to automate the process by use of robotics. For our purposes, it is also very well suited for hyphenation approaches to chromatographic separations. Moreover, the direct plating protocol yields higher compound concentrations in the wells as compared with the transfer plating approach.
Miniaturization of the CRE β-Galactosidase Assay
The direct plating approach allowed miniaturization of the assay into 384-well plates as well as a further increase in fractionation resolution to 2.5 s/well (previously 5 s/well). Moreover, this resulted in an entire chromatographic fractionation run on a single plate. After freeze-dry evaporation, 20 000 cells/well were added in 50 µL/well serum-free culture medium to achieve similar compound concentrations and assay conditions as in the 96-well format. The fractionation was performed in an outward spiraling motion to keep ligands close to the center of the plate and to have stable background signals. This spiral fractionation also minimized edge effects and omitted the need for correction of these. The 384-well CRE β-gal assay results of the standard mixture ( Fig. 3 ; chromatographic time frame of 13–29 min was recorded) were comparable to those obtained in a 96-well format (compare Fig. 2d with Fig. 3a , agonist mode; Fig. 2c with Fig. 3b , antagonist mode). The signal-to-noise ratios observed were in the same range as those seen for standard dose-response curves obtained with the same assay in traditional format and with similar assay formats.
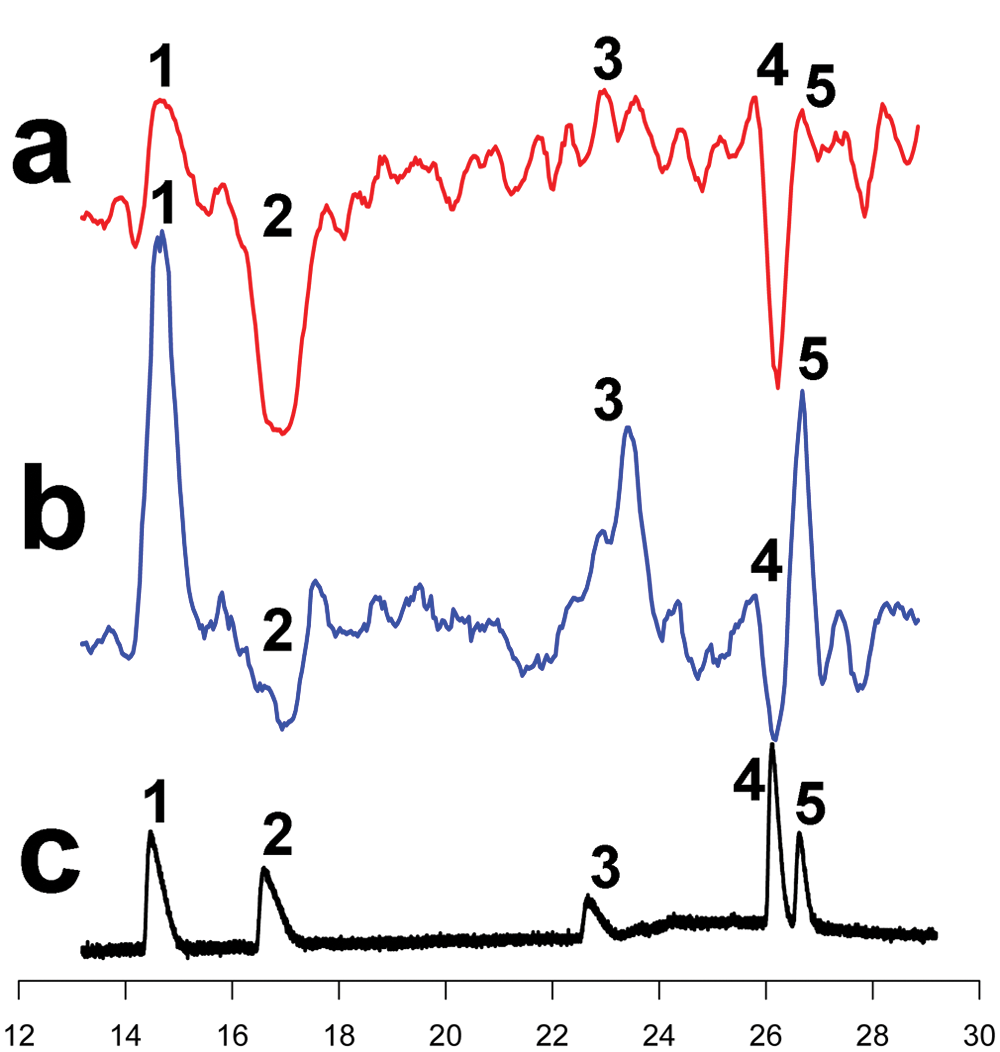
Miniaturization of the cAMP-responsive element β-galactosidase (CRE β-gal) assay to a 384-well format. High-resolution fractions were collected (2.5 s/well) in a 384-well plate, in an outward spiral fashion. This limits edge effects and does not require baseline corrections. The standard mixture was separated and the compounds were accurately correlated. Data shown are reconstructed bioassay chromatograms. (
One 384-well plate can accommodate a 16-min fractionation collection at 2.5 s/well. Considering that parent drug and its metabolites generally elute within 10 min on the column used by us, two metabolic profiling runs of 8 min can be analyzed on the same plate. Consequently, one complete functional characterization can be performed on a single 384-plate, with one run in agonist (without histamine) and the other in antagonist mode (in the presence of 30 nM/EC80 histamine).
Metabolic Profiling of hH4R Ligands
Microsomes, subcellular fractions of hepatic cell endoplasmic reticulum that contain cytochrome P450 enzymes, are well-characterized in vitro models for phase I drug metabolism research. The H4R ligands have been metabolized by pig liver microsomes. 27
Four hH4R ligands were selected based on (I) high activity of the parent ligand in the functional assay and (II) at least one active metabolite. The four ligands represent a selection of different scaffolds known as tricyclic dibenzodiazepines (clozapine), quinoxalines (VUF10148; ligand 1), and sulfonamide-substituted quinazolines (VUF11488; ligand 2 and VUF10519; ligand 3). The compounds VUF10148 29 and VUF10519 29 were previously designed and synthesized in-house. VUF11488 was recently developed and characterized (R. A. Smits, H. D. Lim, T. van der Meer, G. Coruzzi, M. Adami, W. Baumer, K. Rossbach, I. J. de Esch, and R. Leurs, unpublished observations). Clozapine is a promiscuous GPCR binder, which exhibits agonism on hH4R. 26
Figure 4 shows the comprehensive results of the metabolic mixtures analysis, including signaling in agonist mode (traces a), the antagonist mode (traces b), UV trace (traces c), and LC/MS trace (traces d). Data have been smoothed using a moving average algorithm and the baselines shifted for overlay plotting. The MS chromatograms have been shifted and stretched for overlay plotting to compensate for the smaller column diameter. Due to the parallel setup of the CRE β-gal assay with MS correlation, bioactivity can be correlated to structure identity. The structure elucidation with help of MSn is not within the scope of this study and is therefore described elsewhere. 24 This study used MS data only to demonstrate the developed methodology in a metabolic profiling setting. The complete platform generated hydroxylated/oxygenated and desmethyl metabolites. The metabolic profiles of the four compounds showed changes in functional efficacy, thereby proving the need for early assessment to generate comprehensive metabolic profiles of lead compounds early on in the drug discovery process ( Fig. 4 ). Surprisingly, all four metabolite fractionations contained a nonidentified contaminant around 23 min with m/z 257 that was identified as an hH4R antagonist.
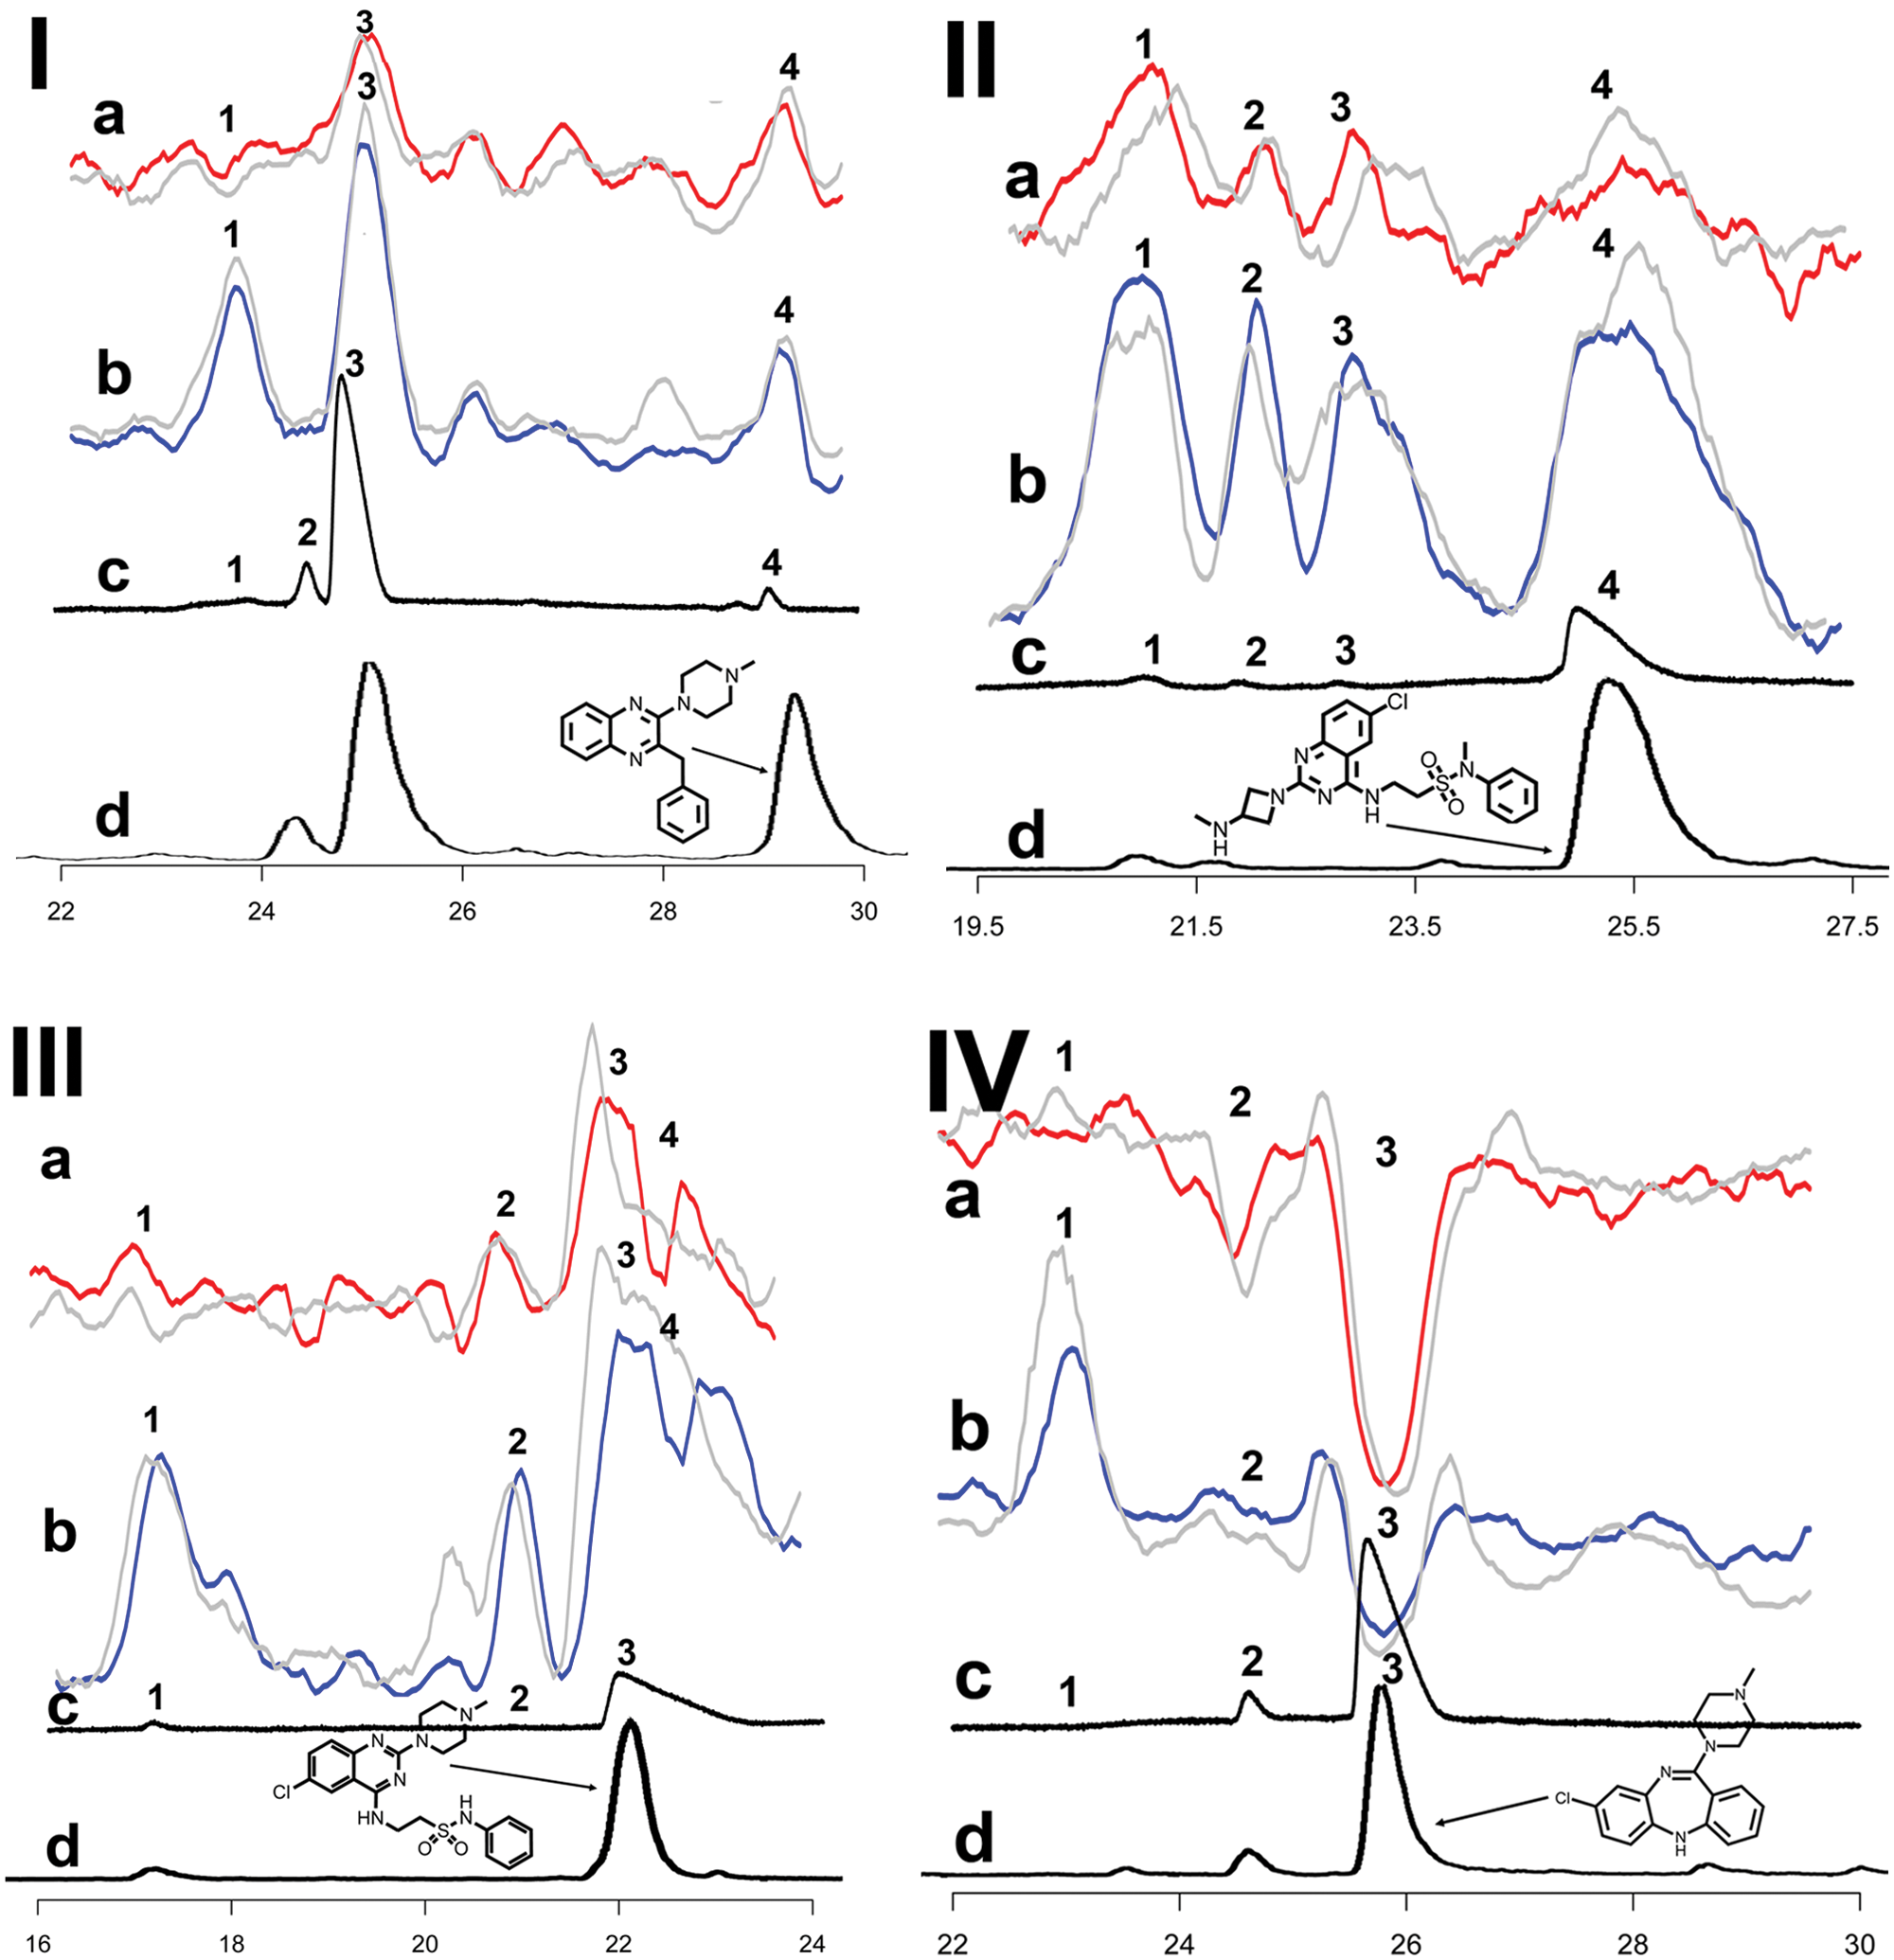
Analysis of metabolic mixtures of ligand 1 (I), ligand 2 (II), ligand 3 (III), and clozapine (IV) in a 384-well plate format using the direct plating approach. Parent structures are depicted as inserts in the figure, referring to their respective peak. Data shown are reconstructed bioassay chromatograms. Agonist (
Ligand 1 ( Fig. 4-I )
The parent (4) eluted at 29.3 min and was identified as an hH4R inverse agonist. A hydroxy-N-desmethyl metabolite (2) at 24.3 min did not show bioactivity, whereas a hydroxyl metabolite (3) at 25.1 min was detected as hH4R inverse agonist. The contaminant (1) at 23 min could be identified as a competitive hH4R antagonist.
Ligand 2 ( Fig. 4-II )
The parent (4) was identified as an hH4R inverse agonist. A hydroxyl metabolite (1) at 21.2 min and an N-desmethyl metabolite (2) at 21.7 min were also shown to be hH4R inverse agonists. The antagonistic contaminant (3) was again at 23 min.
Ligand 3 ( Fig. 4-III )
The parent (3) eluted at 22.1 min and showed inverse agonism. The parent peak largely overlapped with the contaminant (4) at 23 min, but a decrease in parent signal could still be observed. This again indicated that the contaminant is a competitive hH4R antagonist. A hydroxyl metabolite (1) at 17.2 min was identified as a competitive hH4R antagonist. Furthermore, a minor hydroxy metabolite (2) was found at 21.0 min, which is an hH4R inverse agonist.
Clozapine ( Fig. 4-IV )
The parent (3) eluted at 25.8 min and was shown to be an hH4R agonist. An N-desmethyl metabolite (2) at 24.7 min contaminant (1) was again present at 23 min. Previous research has shown that desmethylclozapine (norclozapine) is the predominant metabolite of clozapine.30,31 Norclozapine was identified as a partial agonist for dopamine D2–dependent Ca2+ mobilization via Gαq/o. Interestingly, clozapine was not active in this assay. In contrast, at 5-HT1a, norclozapine appeared to be a partial agonist with higher efficacy than clozapine, as measured in [35S]-GTPγS, ERK1/2 phosphorylation. 32 Other metabolic products reported are clozapine N-oxide, a hydroxylated metabolite and a protein-reactive metabolite. 33 Previously, several methods have been reported in which clozapine and its metabolites were identified. In agreement with our results, the majority of methods measure clozapine and norclozapine, and only a few approaches identify clozapine N-oxide as well (e.g., Volpicelli et al 33 ). It has to be noted that Volpicelli et al 33 measured clozapine N-oxide in serum samples from patients.
As shown for the four hH4R compounds used to demonstrate the methodology in the miniaturized 384-well format with the direct plating approach, the data readily allow assessment of bioactivities of the metabolites. Moreover, the freeze-dried well plates can in theory be used in other different cell-based and/or biochemical assays. Although the current results show the application of our approach to the identification of metabolites of four model compounds, the system can easily be applied to other agonists/antagonists of the H4 receptor. The MS identification strategy is very much independent of the bioactivity assessment, meaning that any commonly available strategy of MS identification of metabolites can be applied to identify other ligands and their metabolites as well.
In summary, we developed a new high-resolution in-line methodology for the functional analysis of biologically active GPCR ligand mixtures, specially focused on metabolic mixture analysis. Analytical separation strategies and high-resolution fractionation techniques were combined with a mammalian cell-based hH4R signaling assay. Hyphenation of the analytical part with the cell-based hH4R signaling assay was achieved after a number of evaluation, optimization, and validation steps. First, we minimized traces of mobile phase constituents by a freeze-dry evaporation step. Second, a direct plating protocol was introduced to minimize liquid handling. Finally, we miniaturized both the analytic fractionation (2.5 s/well) and CRE β-gal assay to 384-well formats. The optimized methodology was demonstrated with four hH4R ligand metabolic mixtures. These data readily allowed rapid assessment of altered bioactivities (functional efficacy) for the metabolites formed. Parallel mass spectrometric analysis was done to identify metabolite structures and correlate them to their bioactivities.
Footnotes
Acknowledgements
We kindly acknowledge Tim Lovenberg (Johnson & Johnson, La Jolla, CA) for the SK-N-MC line that stably expresses hH4R and CRE-driven β-galactosidase.
Declaration of Conflicting Interests
The authors declared no potential conflicts of interest with respect to the research, authorship, and/or publication of this article.
Funding
The authors received no financial support for the research, authorship, and/or publication of this article.