
Abstract
Cell-based assays to detect Gαi signaling are often indirect, frequently involve complex pharmacological interventions, and are usually blind to the kinetics of the signaling. Our goal was to develop a simple, direct measure of Gαi signaling in living cells. We previously reported our fluorescent cADDis assay and showed that it reliably detects Gαs-mediated increases in cAMP levels. Agonists that stimulate a Gs-coupled receptor produce changes in the intensity of bright green or red fluorescent protein sensors that can be followed over time using automated fluorescence plate readers or fluorescence imaging systems. Since the cADDis sensors can monitor Gαs-mediated increases in adenylyl cyclase activity, in theory they should also be capable of detecting Gαi-mediated decreases. Here we apply our green fluorescent cADDis sensor to the detection of Gαi-mediated inhibition of adenylyl cyclase activity. We validated and optimized the assay in living HEK 293T cells using several known Gαi-coupled receptors and agonists, and we report robust Z′ statistics and consistent EC50 responses.
Introduction
Many important G-protein-coupled receptors signal through the Gαi pathway. The classic paper of Taussig and colleagues showed convincingly that the GTP-bound, myristoylated version of Gαi could inhibit Gαs-stimulated adenylyl cyclase, which clarified how hormones could directly affect cellular levels of cAMP. 1 Assays for Gαi activity frequently involve single-time-point, destructive, biochemical measurements. Our goal was to develop a simple assay to detect real-time Gαi-mediated decreases of cAMP with the following requisites: (1) it should yield high Z′ values on the large installed base of fluorescence plate readers; (2) it should produce reliable dose–response relationships with minimal variability and large assay windows; (3) it should be simple to use, flexible, and easy to multiplex with sensors for other signaling pathways; and (4) it should be as direct a measure of Gαi signaling as possible, involving a minimum of pharmacological interventions and potential confounders.
Previously, we developed the genetically encoded fluorescent cAMP indicator, cADDis, and demonstrated that it is effective in detecting Gαs-mediated increases in cAMP production on automated plate readers. 2 The cADDis sensor contains the cAMP binding domain of EPAC fused to a circularly permuted form of mNeonGreen or red mApple. The fluorescent protein mNeonGreen was chosen because it is the brightest green protein available, 3 and the signal it produces can be readily detected on fluorescence plate readers. 4 There are two versions of the sensor; one shows an increase in green fluorescence as cAMP increases (Upward cADDis), and the other decreases in fluorescence as cAMP increases (Downward cADDis). These sensors contain a single cAMP binding domain and have dynamic range of 0.1–50 µM cAMP, with an EC50 of 0.46 µM, which is quite similar to other sensors constructed using portions of EPAC. 5 The cADDis sensor is packaged in BacMam, a BSL-1 viral vector that reduces cell-to-cell expression variability, makes it possible to control sensor expression levels, and provides efficient delivery to virtually any cell type without the need for transfection reagents. The cADDis assay yields high Z′ values, produces large assay windows, and provides kinetic measures of Gαs-mediated cAMP production in living cells. 2 We reasoned that if cADDis can be used to follow physiologically relevant increases in cAMP, it could potentially be used to follow Gαi-mediated decreases as well.
Materials and Methods
BacMam Production and Titer
BacMam was produced following the methods described previously. 2 To establish BacMam titers, we quantified viral genes per milliliter using quantitative PCR (qPCR). BacMam samples are diluted 1:10 in Triton X-100. Samples are then exposed to two freeze/thaw cycles of 5 min in a dry ice/ethanol bath and 2 min in a 42 °C water bath. Samples were then diluted 1:50 in TE buffer in preparation for use as qPCR template. qPCR is performed using the SYBR Select Master Mix (Applied Biosystems, Waltham, MA) in a Qiagen Rotor-Gene Q thermocycler. PCR primers are specific to the VSVG gene (forward primer 5′-GCAAGCATTGGGGAGTCAGAC-3′, reverse primer 5′-CTGGCTGCAGCAAAGAGATC-3′). Viral stocks are tested monthly and are typically stable for 12 months when stored at 4 °C and protected from light. While viral genes per milliliter is a reliable, consistent measurement of viral concentration, the efficiency by which a viral stock successfully transduces mammalian cells will vary by cell type, the promoter used to drive expression, and the means by which transduction is detected.
Molecular Biology
All cDNAs for the β2 adrenergic receptor (β2-AR), muscarinic type 2 (M2), dopamine (D2), succinate, and adenosine type 1 (A1) receptor were obtained from the cDNA Resource Center (Bloomsburg University, Bloomsburg, PA). The constitutively active Gαs6,7 was provided by Dr. Catherine Berlot. The cDNAs encoding cADDis, the receptors, and the Gαs were cloned into the same vector, which put them under the transcriptional control of a CMV promoter.
Cell Culture and Viral Transduction
HEK 293T cells were cultured in Eagle’s minimum essential medium (EMEM) supplemented with 10% fetal bovine serum (FBS) and penicillin-streptomycin at 37 °C in 5% CO2. For BacMam transduction, cells were resuspended in media at a density of 50,000 cells per 100 μL. One hundred microliters of this suspension was combined with BacMam containing cADDis and the indicated receptors or constitutively active Gαs, 2 mM sodium butyrate (Sigma, St. Louis, MO), and EMEM in a final volume of 150 μL. For each experiment 4 × 10⁸ viral genes of cADDis virus were added to each well. The amount of virus carrying the constitutively active Gαs was systematically adjusted to optimize the assay, and in the context of HEK 293T cells, the optimal amount was empirically found to be 6.48 × 10⁷ viral genes. The virus carrying the β2-AR was added such that 9.45 × 10⁷ viral genes went into each well, and the different Gαi-coupled receptors were diluted such that 8.95 × 10⁷ viral genes were delivered to each well. The cell/transduction mixture was then seeded into 96-well plates and incubated for ~24 h at 37 °C in 5% CO2. Thirty minutes prior to fluorescence plate reader or imaging experiments, the media in each well was replaced with 150 μL of Dulbecco’s phosphate-buffered saline (DPBS) supplemented with Ca2+ (0.9 mM) and Mg2+ (0.5 mM).
Automated Plate Reader
Fluorescence plate reader experiments were performed on the BioTek Synergy Mx plate reader in 96-well plates. Fluorescence detection was recorded using a 488/20 nm excitation wavelength and 525/20 nm fluorescence emission filter. Drug was added manually with a multichannel pipette in a volume of 50 µL at the indicated time points. While all of the data reported here came from cells in 96-well plates, we and others have been successful using this assay in the 384-well format.
Fluorescence Imaging
Fluorescence images were collected with an inverted Olympus IX51 microscope fitted with a 20×, 0.9 NA objective, or an inverted Zeiss Axiovert 200 with a 20×, 0.9 NA objective. Computer-controlled blue LED and green LED illumination was used to excite cADDis fluorescence and R-GECO fluorescence, respectively (ThorLabs). The blue LED was filtered using a 480/40 nm filter. The red LED was filtered with a 535/50 nm filter. Images were obtained sequentially. A bandpass 514/30 emission filter was used to collect cADDis fluorescence, and a bandpass 617/73 emission filter was used to filter the R-GECO 8 fluorescence. Images were captured on a QImaging Retiga camera and pseudo-colored green (cADDis) or red (R-GECO) using the FIJI distribution of ImageJ.
All agonists and forskolin were obtained from Sigma. Forskolin was initially dissolved in ethanol. All working concentrations of drugs were dissolved in PBS and added manually to the HEK 293T cells at the indicated concentrations and time points.
Data Analysis
The fluorescence measurements from the time-lapse imaging and the plate reader were analyzed with Matlab (MathWorks) or IGOR (WaveMetrics) analysis software. The dose–response relationships were fit to a Hill function. To do this, we picked the time point at the maximal response and plotted the fluorescence relative to the concentration of drug in the well. All parameters were free during the optimization of the fit. The Z′ statistic was used to quantify the quality of the assay as originally established by Zhang and colleagues. 9
Results and Discussion
Gαi signaling inhibits the Gαs stimulation of adenylyl cyclase. It could be possible that the chronic level of Gαs activity in HEK 293T cells is sufficient to produce enough adenylyl cyclase activity that the inhibitory effects of Gαi would be detectable without any additional stimulation of adenylyl cyclase. To test this, we transiently expressed both the downward cADDis cAMP sensor and the D2 receptor in HEK 293T cells. There was no detectable change in fluorescence intensity following activation of the D2 receptor. These negative results could be due to very low levels of adenylyl cyclase activity, so we repeated the experiments but added a viral vector to express constitutively active Gαs to raise the level of adenylyl cyclase activity.6,10 As we increased the amount of virus expressing the constitutively active Gαs, the resting level of cytosolic cAMP increased. This was seen as a decrease in the fluorescence of resting cells expressing the green downward cADDis cAMP sensor since increases in cytosolic cAMP decrease the fluorescence. In turn, D2 receptor activation produced a large increase in fluorescence ( Fig. 1 ), indicating a drop in the concentration of cytosolic cAMP. Our interpretation of these results is that there is a very low level of adenylyl cyclase activity in unstimulated HEK 293T cells. This may not be the case in other cell types that express other isoforms of adenylyl cyclase or which have a higher Gs “tone.” 11
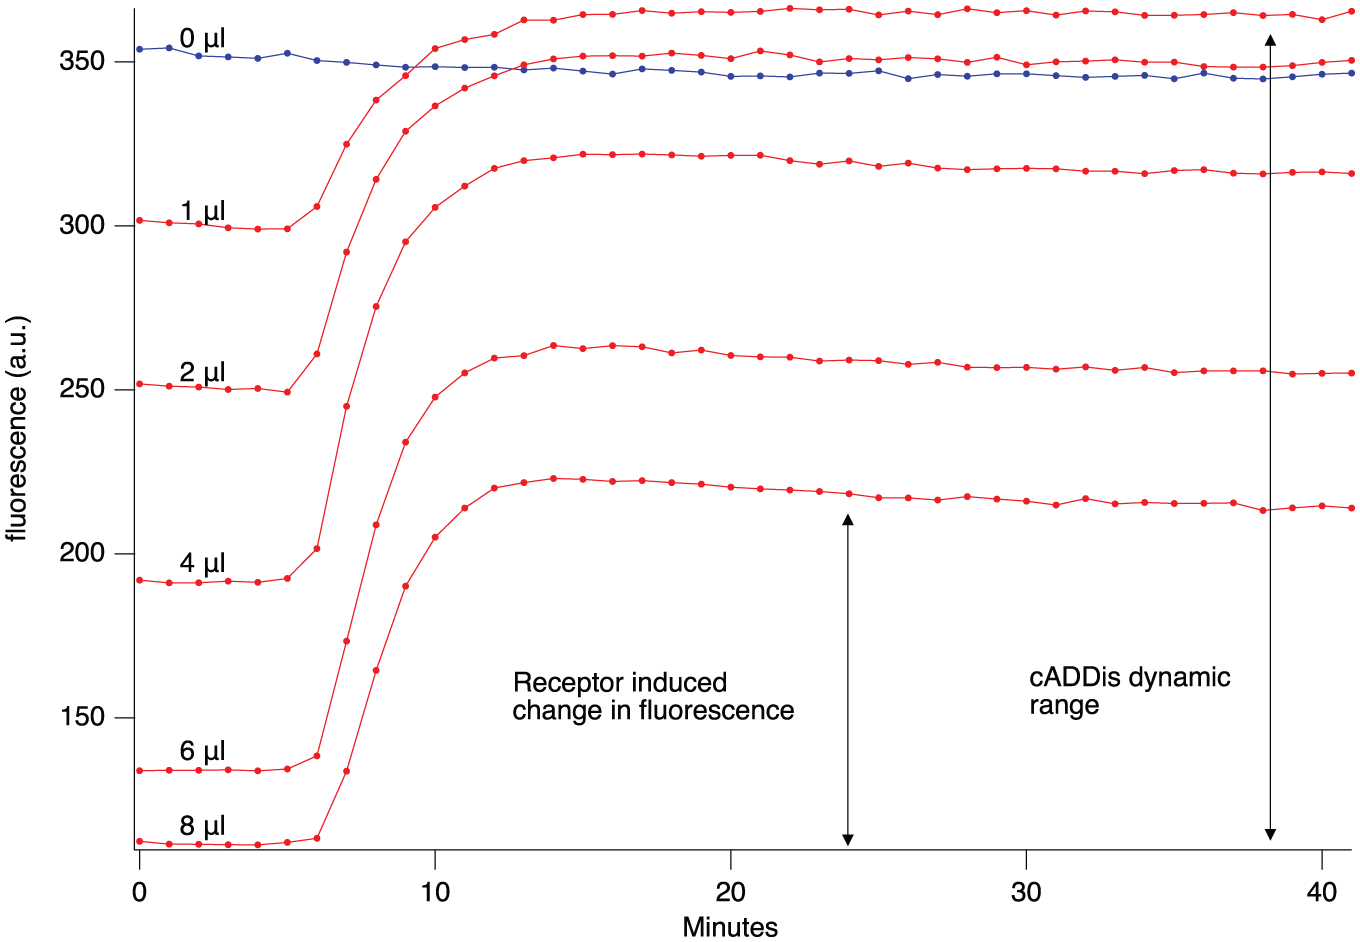
Tuning adenylyl cyclase activity by adjusting levels of Gαs activity. Wells of HEK 293T cells were transduced with viruses expressing the D2 receptor, the downward green version of cADDis, and different amounts of the virus expressing constitutively active Gαs. There was no detectable response to the application of quinpirole in the absence of constitutively active Gαs, but as increasing amounts of the virus expressing the constitutively active Gαs were added to the wells, the fluorescence of downward green cADDis decreased, indicating increased levels of cytosolic cAMP. The addition of quinpirole caused an increase in fluorescence, indicating a drop in adenylyl cyclase activity. The mean fluorescence signal from six wells is plotted for each condition.
Figure 1 shows that the magnitude of the D2 response, the drug-induced changes in fluorescence, is less than the total dynamic range of the cADDis sensor. In contrast, when a Gs-coupled receptor is activated, the amount of cAMP produced typically exceeds the dynamic range of cADDis. 2 Perhaps the amount of available Gi protein is limiting the magnitude of the response. Importantly, the maximal response takes 5–10 min, and then is maintained over 20–30 min. This is a reasonable assay time window in which to record the responses on standard fluorescence plate readers. The long response is most likely caused by the continued presence of drug in the well and the temperature of the cells (25 °C), and it is similar to what Gilissen and colleagues observed. 12 There are many examples of much briefer responses in superfusion experiments that rapidly administer and wash out the ligand. 13 In the case of 6 µL of Gs virus in Figure 1 (~6.48 × 10⁷ viral genes), the baseline before the application of the drug varied over time with a standard deviation of 163, while the application of drug caused an average increase in fluorescence of 13,385, which is a signal-to-noise ratio of ~82.
Encouraged by the robust response of the sensor to D2 activation, we further characterized the dose–response relationship of the assay.
Figure 2A
illustrates the raw data from six wells treated identically. The initial baseline (F0) varies from one well to the next, but the responses are quite similar. To normalize the responses, we divide the fluorescence at each time point by the initial baseline F0, which reveals that the changes in each well are quite similar in terms of both amplitude and kinetics (
Fig. 2B
). To plot the fluorescence response in relation to the agonist concentration, we chose the maximal fluorescence value, 20 min after drug application. This reveals an EC50 of 3.4 nM (
Figs. 2C
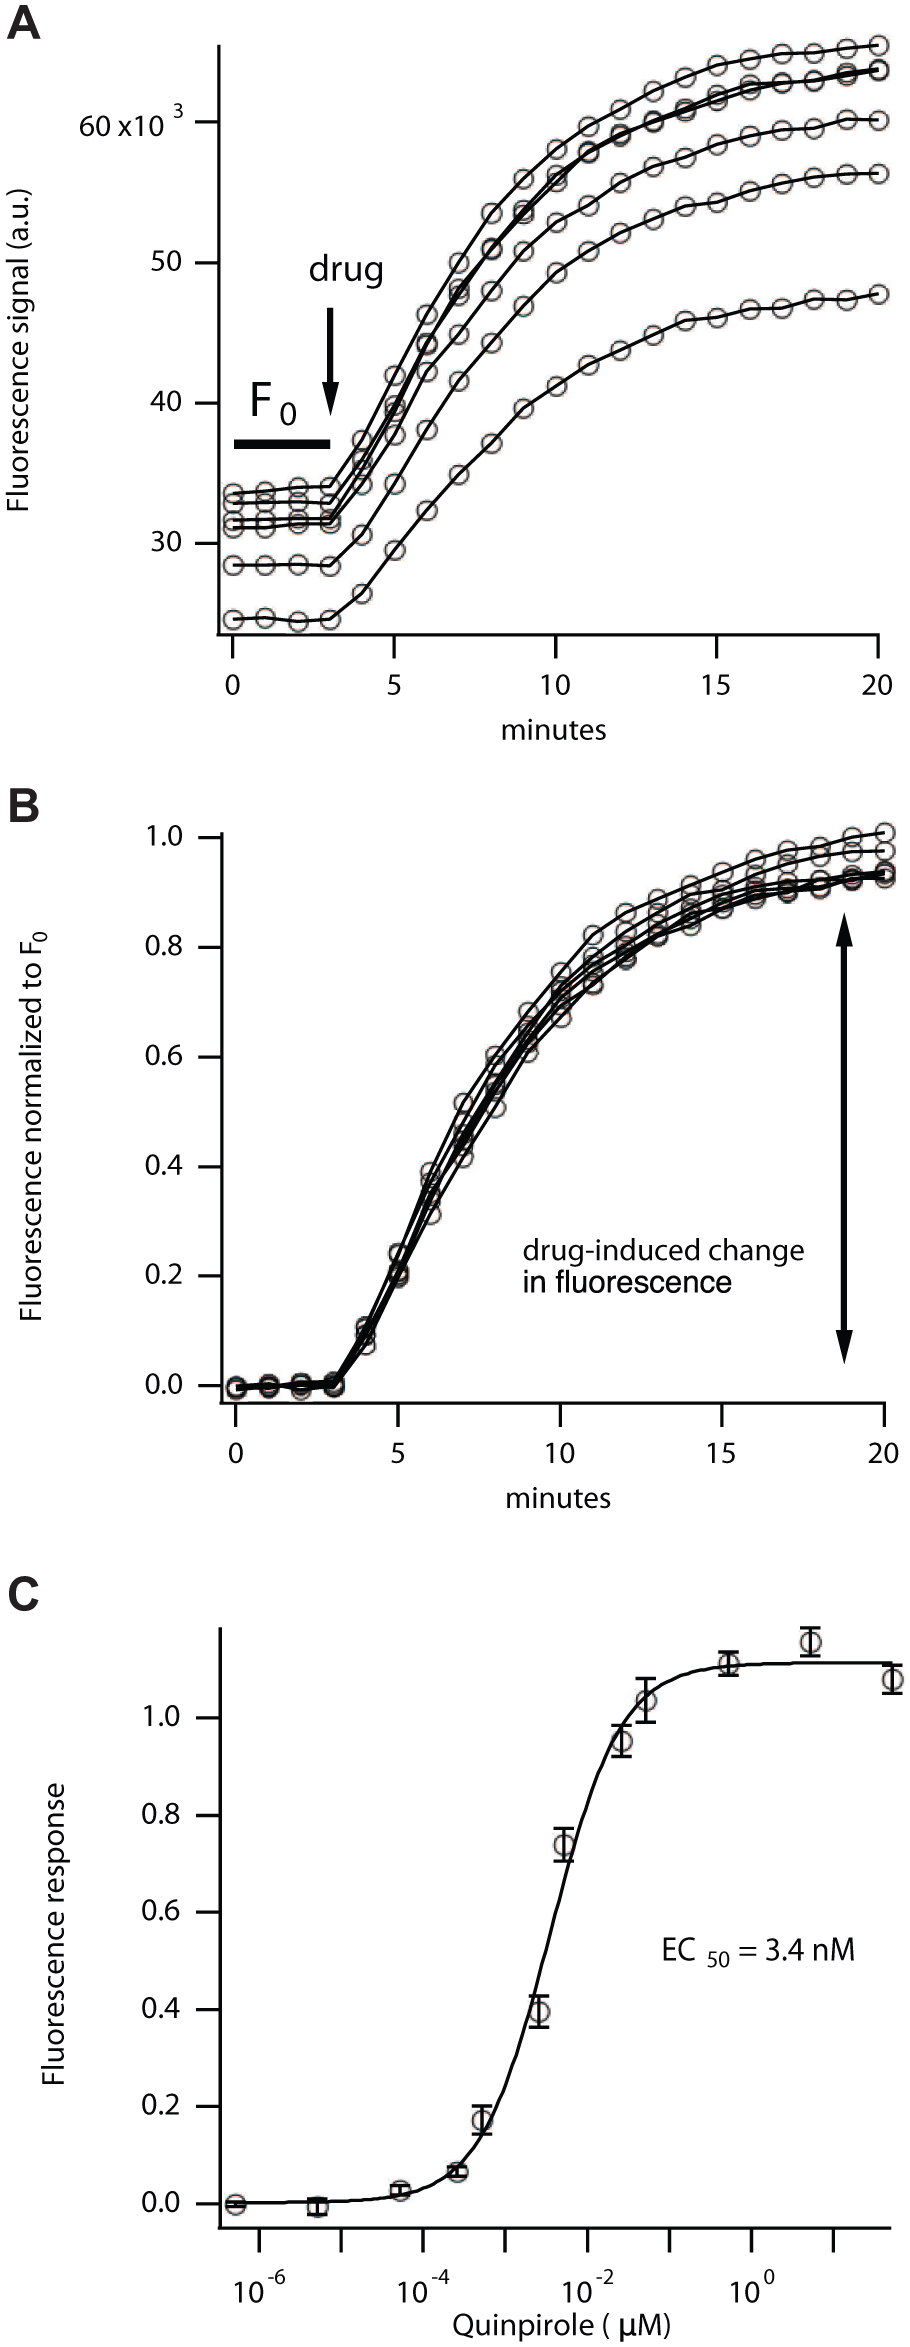
Measuring the dose–response relationship for the D2 receptor. Quinpirole produced a dose-dependent change in cADDis, but well-to-well variability is inherent in live cell assays (
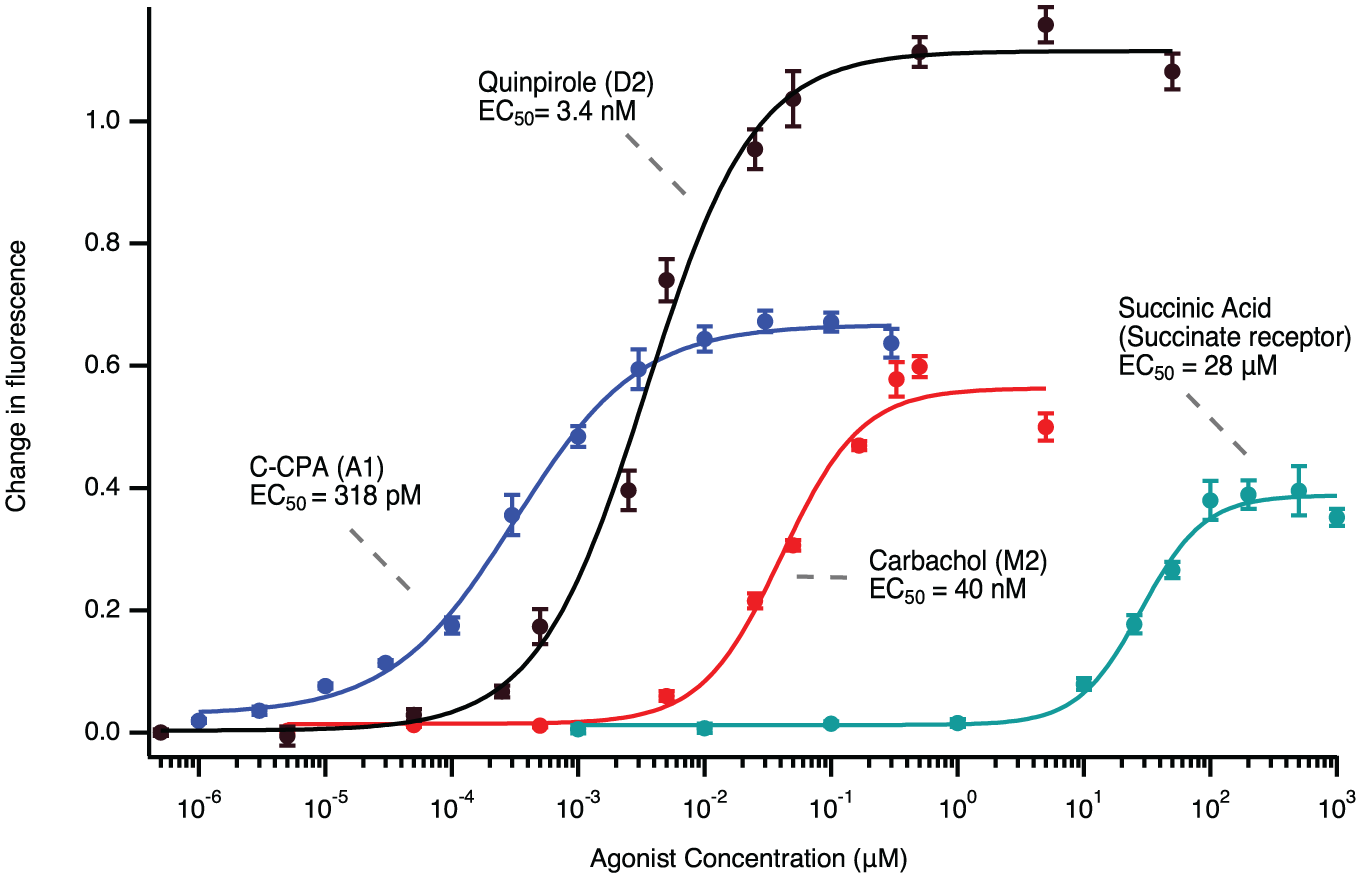
cADDis Gi assay characterization. Plots and Hill function fits of dose–response curves for the A1, M2, and succinate receptors. The D2 receptor is included for comparison. The agonists for the D2, A1, M2, and succinate receptors were quinpirole, C-CPA, carbachol, and succinic acid, respectively. Surprisingly, while the EC50 values are consistent with those in the literature, the maximum magnitude of the fluorescence change varies by receptor. Each measurement is the mean of six wells, with the standard deviation included.
Dose–response curves for three additional Gαi-coupled receptors—the succinate receptor, the M2 receptor, and the A1 receptor—were measured in the same manner ( Fig. 3 ). In each condition, HEK 293T cells were transduced with the same number of viral genes for each receptor. Despite this, the activation of the different receptors produced different amounts of fluorescence change. This could be due to a variety of factors. One explanation would be that there are differences in receptor expression levels or membrane trafficking. An interesting possibility is that at higher agonist concentrations the receptor could be signaling through multiple G proteins. Indeed, it has been shown that high concentrations of carbachol will cause M2 activation of Gαs, which could explain the relatively small M2 maximal response. 16 The A1 and succinate receptors are also known to couple to other G proteins at high agonist concentrations. The EC50 value for succinic acid was 28 μM, which is consistent with that found by Gilissen et al. (36 μM) in HEK 293T cells overexpressing the receptor. The EC50 value for the M2 receptor (40 nM) was significantly different from that seen in a FRET-based assay (5.1 µM) 17 but is consistent with the original descriptions of 71 nM.18,19 Repeating the M2 receptor measurements on a different day, on different plates, with different plate reader settings, returned a similar EC50 value of 66 nM. The EC50 values for the A1 receptor-mediated reductions in cAMP were also done on two different days, with different conditions, and they were 318 and 308 pM, which is similar to measurements of the C-CPA high-affinity binding site (0.61 nM). 20 All these Gi assays yielded a Z′ statistic of >0.5, and the M2, D2, and A1 receptors yielded Z′ > 0.85. 9
In most cells, the level of cAMP is regulated by the natural interplay of Gαs and Gαi at the adenylyl cyclases. To explore whether we could actually see this interaction, we transiently expressed the D2 receptor in HEK 293T cells. We stimulated the endogenous β2-AR of HEK 293T cells with isoproterenol to raise adenylyl cyclase activity and then added quinpirole to activate the D2-mediated Gαi inhibition. This worked, and it could be used to determine EC50 values (~12 nM) for the stimulation of the D2 receptor with quinpirole ( Fig. 4A , B ), which was similar to our previous measurements ( Fig. 2 , 3.4 nM). Stimulation of Gαi, and then Gαs, adding quinpirole before isoproterenol, also provided new views of the competition between Gαs and Gαi signaling pathways. While these competition experiments introduce a degree of pharmacological complexity, they could be quite useful for exploring the interactions of Gαs and Gαi pathways in biologically relevant cells such as primary cultures, organoids, isolated pancreatic islets,21,22 or cell types differentiated from induced pluripotent stem cells (iPSCs). 23 The versatility of BacMam makes deployment in specialized cell types quite feasible.
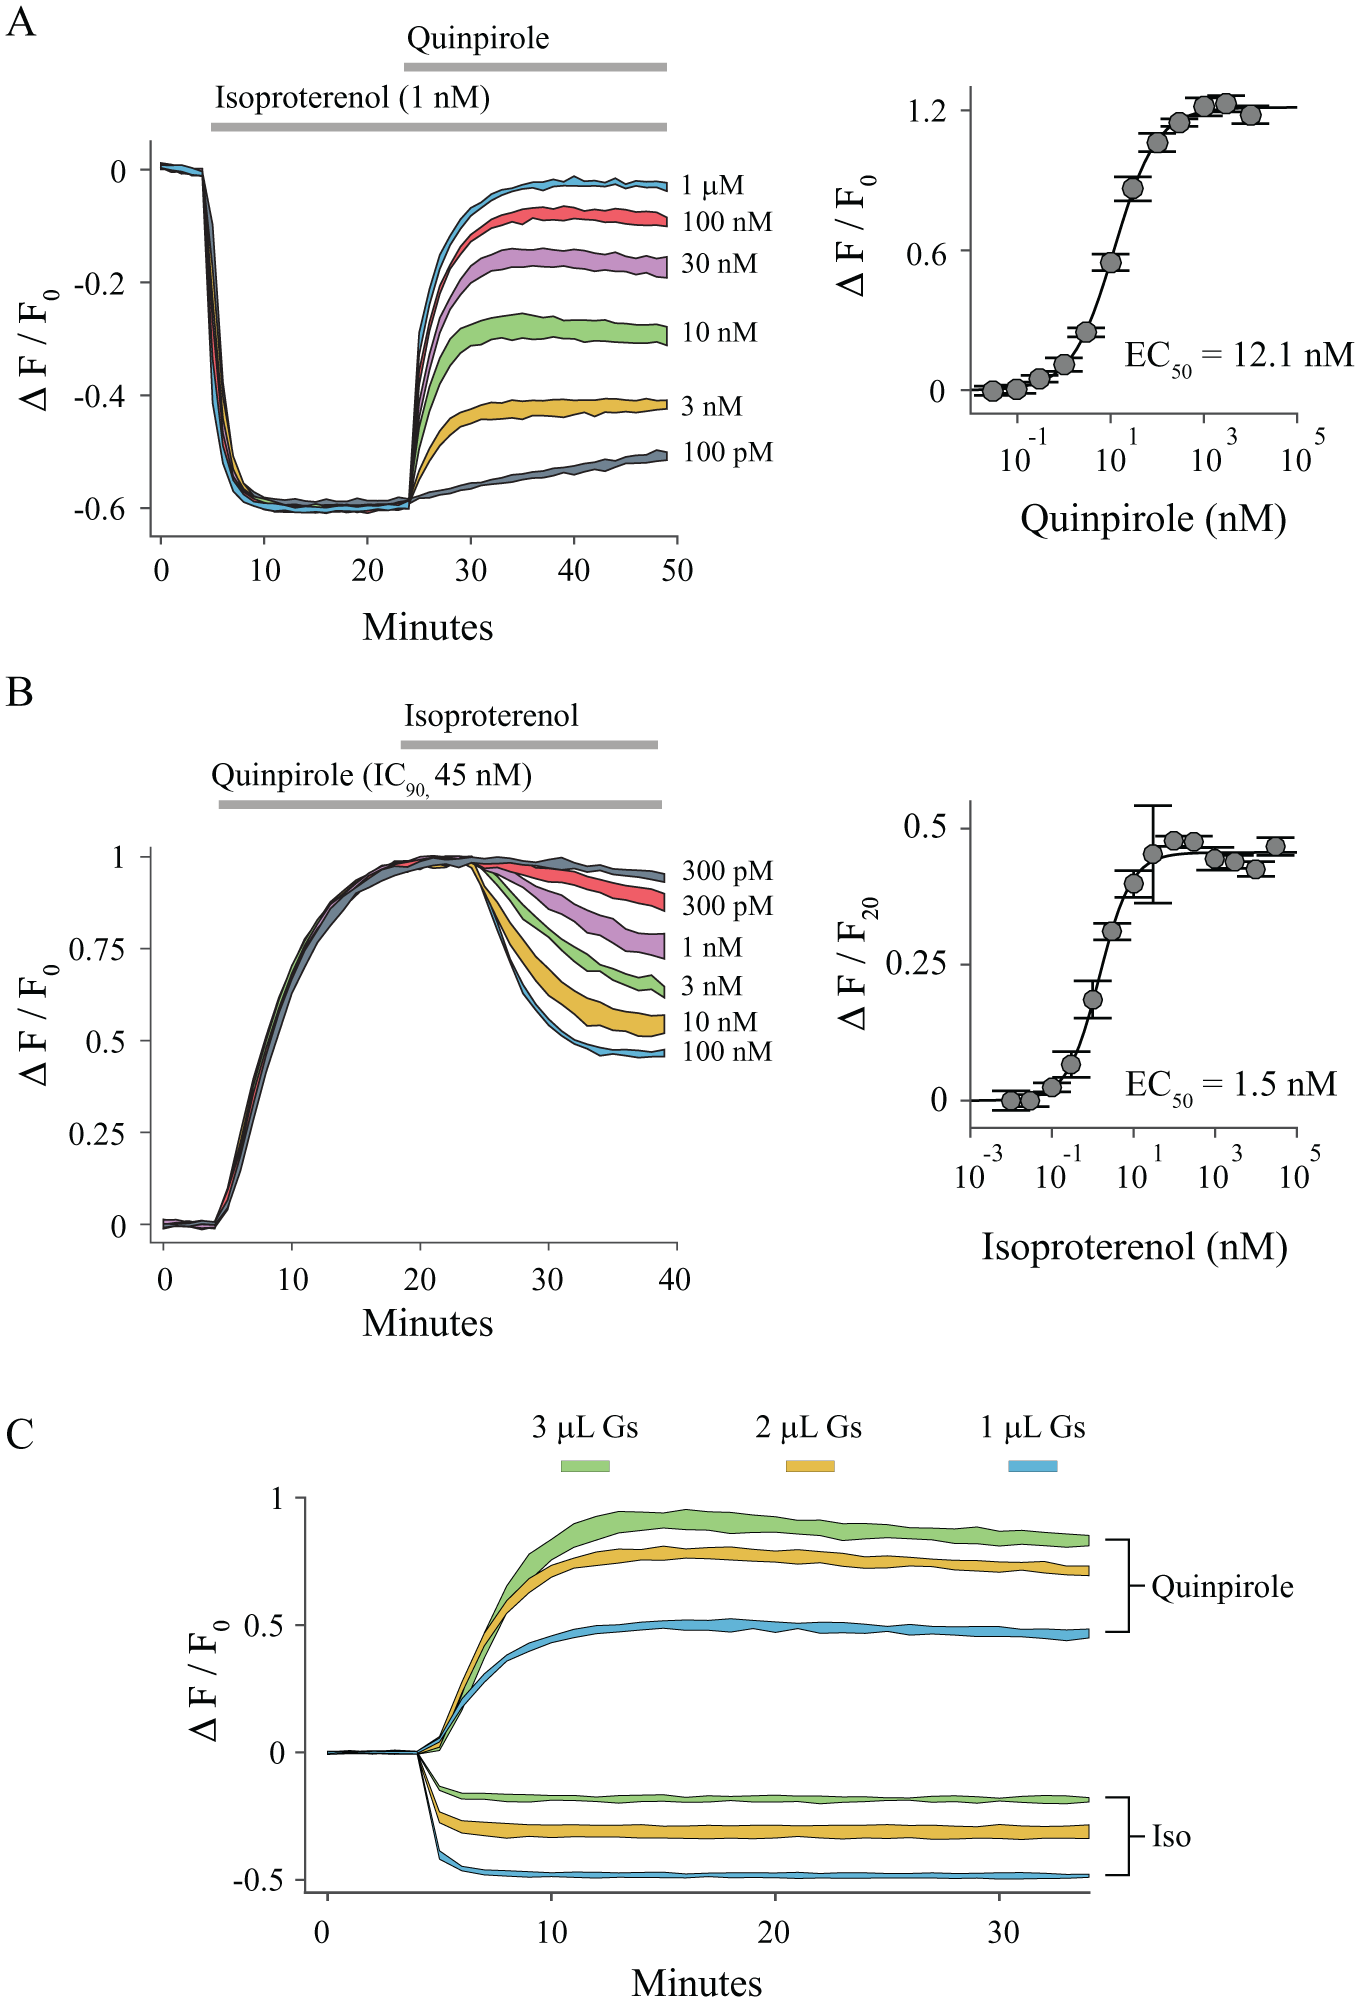
Detecting dynamic interactions of Gs and Gi signaling with cADDis. (
To test whether cADDis can distinguish between Gαs or Gαi-mediated signaling, we adjusted the expression of the constitutively active Gαs with the goal of moving the resting level of adenylyl cyclase activity to the EC50 of cADDis. HEK 293T cells were co-transduced with downward green cADDis, β2-AR, D2 receptor, and varying amounts of constitutively active Gαs. In each condition, we measured the cADDis response to either Gαs or Gαi stimulation, and as expected, increasing levels of the constitutively active Gαs led to larger Gαi signals at the expense of Gαs signals. Increasing levels of the constitutively active Gαs also led to a dose-dependent decrease in the average baseline fluorescence intensity of the cells. When HEK 293T cells were transduced with at least 1 µL of the constitutively active Gαs, cADDis reported either Gαs or Gαi signaling with high fidelity, with ~0.5 ΔF/F0 for both pathways ( Fig. 4C ). One can imagine that this approach would be quite useful in working with compounds of unknown action or receptors that could potentially couple to either Gαs or Gαi. Importantly, in some cell types, the adenylyl cyclase 2 and 4 isoforms are stimulated by Gβγ, but only in the presence of Gαs binding. 24 Adenylyl cyclase stimulation by Gβγ could potentially lead to the paradoxical result, where stimulation of a Gαi-coupled receptor and the subsequent release of Gβγ lead to an increase in cAMP production. Another application could be studying inverse agonists at constitutively active receptors.
Some adenylyl cyclases are also regulated by Ca2+, either negatively or positively, depending on the isoform.25,26 There is also the potential for cross talk between the Gαq and Gαi signaling pathways.27,28 To explore the potential for simultaneously recording both Gαi activity and Ca2+ signaling, we co-expressed cADDis with the red Ca2+ indicator, R-GECO,8,29 and the D2 receptor ( Fig. 5 ). In this experiment, isoproterenol-mediated β2-AR activation produced the expected rise in adenylyl cyclase activity, with little effect on Ca2+, but the subsequent addition of quinpirole to activate the D2 receptor produced the expected Gαi effect and an unexpected surge in intracellular Ca2+. There are many potential explanations for this. For example, there are reports of a synergy between D1/D5 receptors, expressed endogenously in HEK 293T cells, 30 and D2 receptors as heterodimers to cause Ca2+ increases in HEK 293T cells31,32 and in mouse striatum. 33
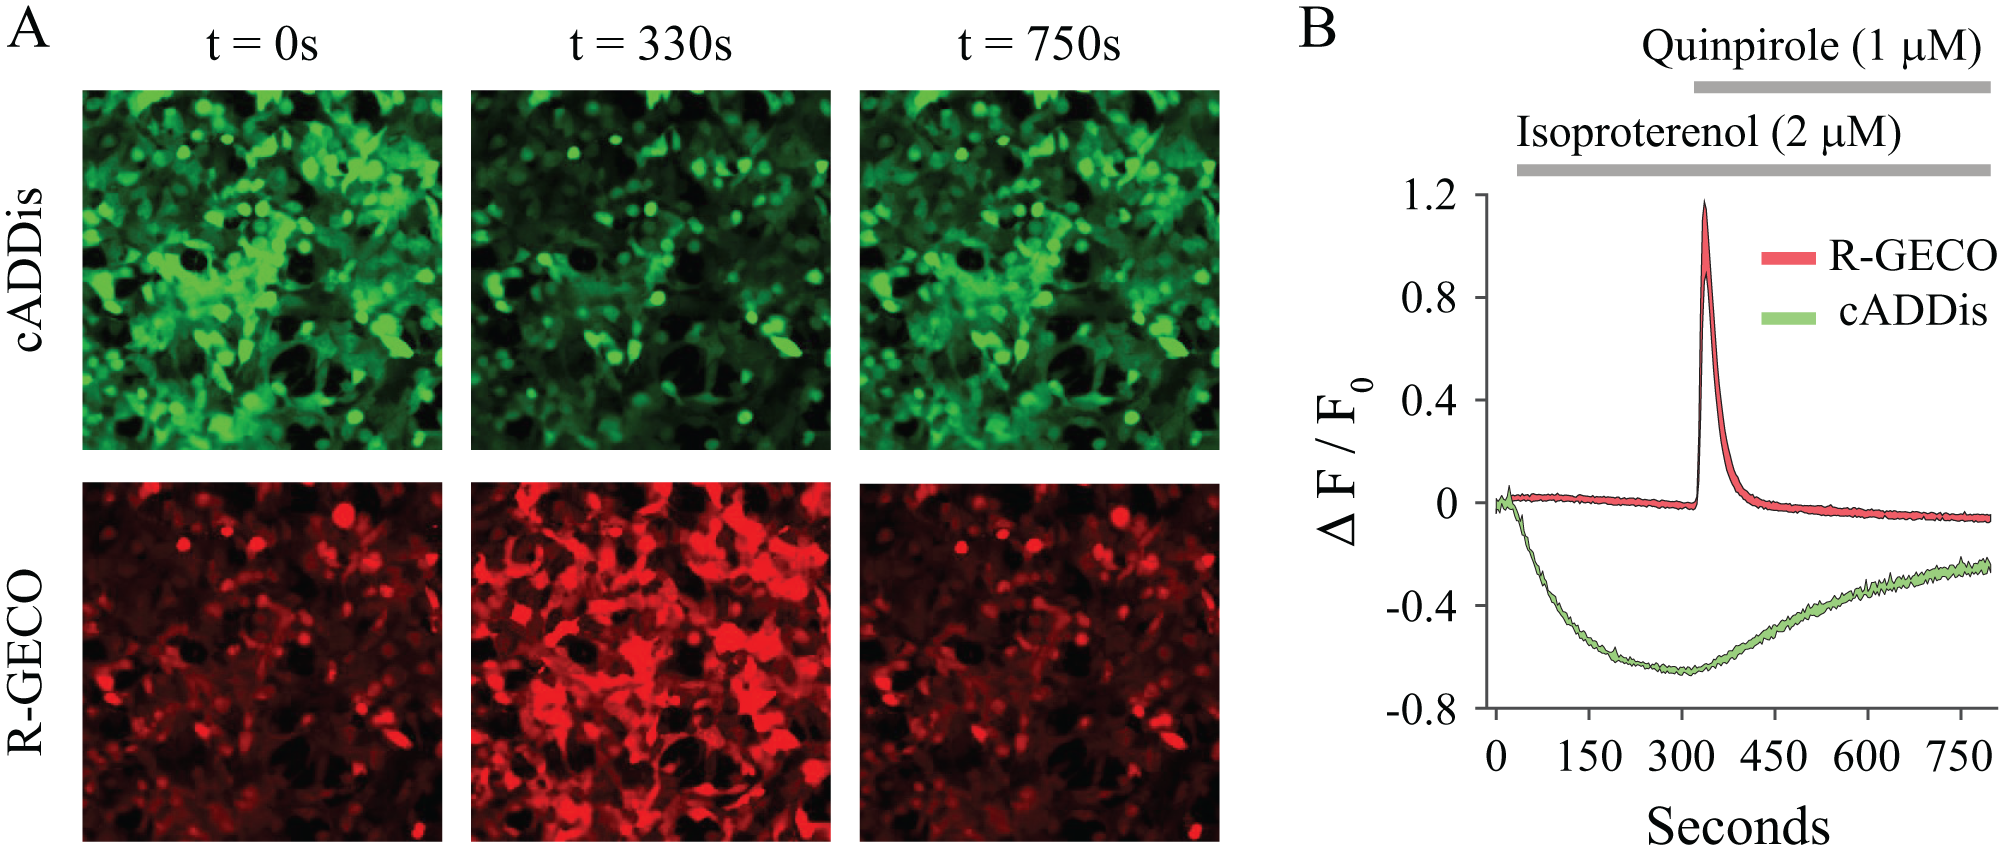
Simultaneous imaging of dynamic changes in cAMP and Ca2+. (
Many Gαi assays use forskolin to raise adenylyl cyclase activity to observe Gαi inhibition. 12 The cADDis sensor responded well in this context. Figure 6 compares the ability of the indicated Gαi-coupled receptors to reverse either isoproterenol or forskolin-stimulated adenylyl cyclase activity. In the case of the D2 receptor and the succinate receptor, the amplitudes of the forskolin- and isoproterenol-induced cADDis responses were indistinguishable. In the case of the M2 and A1 receptors, the amplitude of the forskolin response was greater than that of isoproterenol. A potential explanation for this discrepancy is that the M2 and A1 receptors, but not the D1 and succinate receptors, can stimulate a low level of Gαi activity in the absence of agonist, leading to a decreased amplitude of Gαs-stimulated adenylyl cyclase activity.
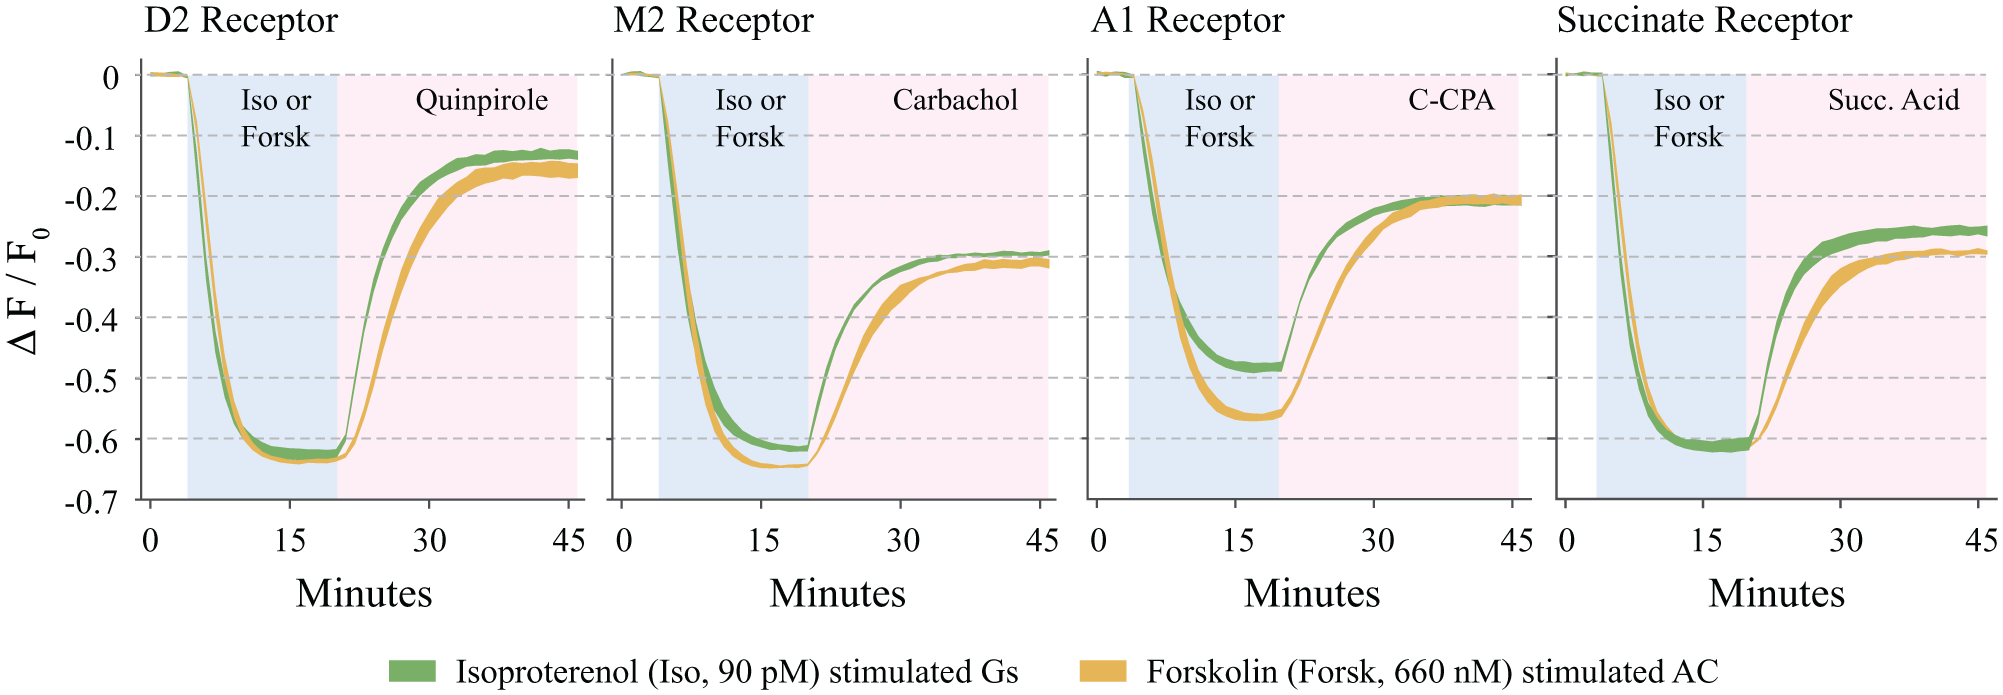
Comparison of Gi-mediated reversal of forskolin or isoproterenol-stimulated production of cAMP. cADDis signal in response to EC90 (90 pM) isoproterenol (green) or EC90 (660 nM) forskolin (orange) and subsequent stimulation of the Gi pathway in HEK 293T cells transduced with the indicated receptor and β2-AR. The shaded blue region indicates the presence of isoproterenol or forskolin, and the shaded purple region indicates the presence of Gi agonist and Iso or forskolin. All Gi receptors received EC90 concentrations of agonist. Fluorescence was recorded at 1 min intervals. Line width equal to mean ± SD; n = 6 wells from the same plate for all conditions.
The kinetics of the Gαi-mediated inhibition of adenylyl cyclase in the presence of forskolin were slower than those in the presence of isoproterenol ( Fig. 6 ). This is consistent with the observation that Gαi can inhibit Gαs-bound adenylyl cyclase more effectively than Gαs- and forskolin-bound cyclase, 34 and highlights the ability of cADDis to track subtle differences in adenylyl cyclase activity using automated plate readers.
Early genetically encoded indicators for cAMP relied on Förster resonance energy transfer (FRET), and these have been used to study the timing, 35 subcellular location,36,37 and mechanisms of cAMP signaling specificity. 38 The most recent FRET sensors have improved brightness and dynamic range. 39 However, genetically encoded FRET-based indicators typically require the detection of two fluorescence emissions and yield low signal-to-noise ratios (~1–10). 40 As such, genetically encoded FRET sensors are unsuitable for detecting either Gαs or Gαi signaling in automated plate readers. 41 In contrast, the fluorescent sensors built with single, circularly permuted fluorescent proteins, such as cADDis or GECOs, 8 are quite bright and have much better signal-to-noise ratios. The cADDis sensor signals seen in Figure 1 , for example, have a signal-to-noise ratio of ~80 (change in fluorescence/standard deviation of baseline fluorescence).
Recently, Gilissen et al. used Promega’s GloSensor to develop a forskolin-free assay to detect Gαi signaling in living cells.12,42 The GloSensor requires the detection of only a single luminescent emission and is compatible with many automated plate readers. Because it uses luminescence rather than fluorescence, it will not be susceptible to autofluorescence or the intrinsic fluorescence of some compounds. However, the luciferase used in the GloSensor is limited by the requirement of long enzyme–cofactor incubation times, which are necessary for light production of the sensor. This introduces additional time and liquid handling and minimizes its utility in complex living tissue. In addition, compounds in drug screening libraries can directly interact with luciferase, leading to nonrelevant hits and false positives. 43
Our goal was to design a direct, live cell assay for detecting changes in cAMP produced by either Gαs or Gαi signaling. The bright green fluorescence in cADDis assays can be combined with other genetically encoded red fluorescent indicators to detect two signals simultaneously, such as cAMP and Ca2+. 29 cADDis does not require enzyme–cofactor incubations and has been packaged in a variety of viral vectors, including BacMam, lentivirus, and AAV, for delivery to virtually any cell type, tissue, or animal. There are two advantages to using a genetically encoded sensor. First, the sensor can be targeted to very specific subcellular locations. Indeed, cADDis has been used to study cAMP signaling in the primary cilium and other microdomains.37,44 Second, cell-type-specific promoters or Cre recombinase-dependent expression can be used to target cADDis to rare cell types in complex tissues. 45
Footnotes
Acknowledgements
We would like to thank Julie Park for care and plating of the HEK 293T cells and Shane Tillo, Kevin Harlen, Phil Stork, and Maho Takahashi for a thoughtful review of the manuscript. We thank our two anonymous reviewers, who provided remarkably insightful suggestions for improving the paper.
Declaration of Conflicting Interests
The authors declared no potential conflicts of interest with respect to the research, authorship, and/or publication of this article.
Funding
The authors disclosed receipt of the following financial support for the research, authorship, and/or publication of this article: This work was funded by NSF SBIR Phase II 1430878, the Montana Board of Research and Commercialization Technology (grant no. 17-50-006), and the Montana SBIR/STTR Matching Funds Program.