
Abstract
The genome is constantly exposed to DNA damage agents, leading up to as many as 1 million individual lesions per cell per day. Cells have developed a variety of DNA damage repair (DDR) mechanisms to respond to harmful effects of DNA damage. Failure to repair the damaged DNA causes genomic instability and, as a result, leads to cellular transformation. Indeed, deficiencies of DDR frequently occur in human cancers, thus providing a great opportunity for cancer therapy by developing anticancer agents that work by synthetic lethality-based mechanisms or enhancing the clinical efficacy of radiotherapy and existing chemotherapies. Ataxia-telangiectasia mutated (ATM) plays a key role in regulating the cellular response to DNA double-strand breaks. Ionizing radiation causes double-strand breaks and induces rapid ATM autophosphorylation on serine 1981 that initiates ATM kinase activity. Activation of ATM results in phosphorylation of many downstream targets that modulate numerous damage-response pathways, most notably cell-cycle checkpoints. We describe here the development and validation of a high-throughput imaging assay measuring levels of phospho-ATM Ser1981 in HT29 cells after exposure to ionizing radiation. We also examined activation of downstream ATM effectors and checked specificity of the endpoint using known inhibitors of DNA repair pathways.
Introduction
Cells have to constantly deal with DNA damage induced both endogenously and exogenously. The cellular response to DNA damage is a complex and multistep process that includes recognition of the DNA damage; activation of checkpoint pathways, which arrest cell-cycle progression to allow DNA repair and prevent further damage through replication; and finally repair of the damage or trigger of apoptosis, if damage is too severe.1,2
The major regulators of the DNA-damage response are three proteins: ataxia-telangiectasia mutated (ATM), ATM and RAD3-related (ATR), and DNA-dependent protein kinase (DNA-PK).3–5 All three belong to a closely related protein family known as the phosphoinositide-3-kinase-related protein kinases (PIKKs). They are large kinases with significant sequence homology and a strong preference for phosphorylation of Ser and Thr residues that are followed by Gln, thus sharing many common substrates such as CHK1, CHK2, p53, γH2AX, and KAP1. ATR is activated primarily through single-strand breaks and collapse of replication forks, whereas ATM and DNA-PK are activated upon double-strand breaks (DSB). 6
ATM plays a key role in regulating the cellular response to ionizing radiation.7–9 Cellular irradiation induces rapid intermolecular autophosphorylation of serine 1981 that causes dimer dissociation and initiates cellular ATM kinase activity. Most ATM molecules in the cell are rapidly phosphorylated on this site after doses of radiation as low as 0.5 Gy, and binding of a phosphospecific antibody is detectable after the introduction of only a few DNA DSB in the cell. Recently, additional sites on ATM have been shown to be autophosphorylated in response to DSB. 10 Activation of the ATM kinase seems to be an initiating event in cellular responses to irradiation, and activation of ATM results in phosphorylation of many downstream targets that modulate numerous damage response pathways, most notably cell-cycle checkpoints.
To identify small-molecule inhibitors of ATM signaling, we developed the first reported high-content screening assay, using ionizing radiation to induce DNA damage in HT29 cells, monitoring ATM phosphorylation at serine 1981. We validated it using known DDR inhibitors and have shown its high-throughput screening (HTS) compatibility by running a subset of our proprietary library.
Materials and Methods
Cell Culture
HT29, HeLa, and HEK293T cells were maintained in Dulbecco’s modified Eagle medium (DMEM) supplemented with 10% fetal bovine serum and 2 mM L-glutamine. All cells were maintained at 37 °C under 5% CO2 atmosphere in a humidified incubator.
Irradiation
Cells were irradiated using a 137Cs source (Gammacell 3000 Elan MDS NORDION), with a dose rate of 4, 6, or 8 Gy.
Immunofluorescence Assay
Twenty-four hours before treatment, cells were seeded at 3.5 × 10³ cells/well in black 384-well plates with a clear, flat bottom (Costar, Corning) in a 40 µL volume. For single-shot screening, compounds were dosed at a concentration of 30 µM, and for dose-response, 30 µM to 30 pM concentrations were dispensed. All compounds were prepared in DMSO, and a Labcyte Echo Acoustic Liquid Handler was used to dispense the compounds. Final DMSO concentration in cell media was 0.3% (120 nL volume). Cells were incubated with compounds for 1 h and subsequently irradiated with 6 Gy. Cells were then left to recover for 1 h at 37 °C, 5% CO2, prior to fixing with 1.2% final concentration of formaldehyde in phosphate-buffered saline (PBS) for 20 min at room temperature (RT). Plates were washed once with PBS and cells permeabilized using 0.1% Triton X100 in PBS. After washing plates with PBS, cells were incubated with primary antibody in 3% bovine serum albumin/PBS and 0.05% Tween. Antibodies and dilutions used were the following: ATM pSer1981 (Upstate #MAB3806; 1/10 000 dilution), phospho-KAP1 (Ser824; Bethyl Laboratories #A300-767A, 1:800 dilution), phospho-CHK2 (Thr68; Cell Signaling #2661; 1:500 dilution), γH2AX (Millipore #05-636, 1:1000 dilution). Plates were incubated overnight at 4 °C and then washed three times with PBS/0.05% Tween. Secondary antibody (Alexa Fluor 488 goat anti-mouse IgG, Invitrogen #A11001, or goat anti-rabbit, Invitrogen #A11006; dilution 1/500) and Hoechst (Invitrogen, #H3570; dilution 1/10 000) in 3% BSA in PBS/0.05% Tween were added for 1 h. Plates were washed again three times with PBS/0.05% Tween; PBS was then added to all wells, and plates were processed as indicated below.
Image Acquisition and Analysis
The phosphoATM signal was measured using a Cellomics ArrayScan VTI system. Images of stained cells were acquired from the automated fluorescence microscope platform using a 10× objective lens. Images from four fields per well were collected, corresponding to 800 to 1000 cells. The acquired images were analyzed using a compartmental analysis algorithm. To measure the average fluorescent phosphoATM signal, object identification was set to cover solely the nucleus area, and an intensity threshold of ~300 fluorescent intensity units was set to filter the background.
Western Blotting
Twenty-four hours before treatment, cells were seeded at 1.0 × 10⁵/well in 24w plates (Costar, Corning) in 300 µL volume and incubated overnight at 37 °C, 5% CO2. Cells were then irradiated with 4 or 8 Gy, washed once at different times of recovery (0, 15, 30, or 60 min) with 2 mL of ice-cold PBS, and lysed by addition of 50 µL of sample buffer (50 mM Tris pH 8.0, 150 mM NaCl, 0.1% sodium dodecyl sulfate, 1 mM sodium orthovanadate, 1x protease inhibitors; Roche, Basel, Switzerland) to each well. For compound treatment, cells were dosed for 1 h with various concentrations of inhibitors in DMSO prior to irradiation with 6 Gy, and lysates were prepared as above. The cell lysates were sonicated briefly and heated for 10 min at 80 °C. Proteins were separated on 3% to 8% Tris-acetate or 4% to 12% Bis-tris gels and transferred to nitrocellulose membranes. After blocking in 5% BSA in TBST (20 mM Tris pH 7.5, 135 mM NaCl, 0.05% Tween 20), the membranes were incubated with anti-pATM (S1981; Millipore), anti-pCHK2 (T68; CST), anti-pCHK1 (S345; CST), anti-H2AX (Millipore), or anti-vinculin (Sigma) antibodies. The membranes were washed with TBST and incubated with IRDye 800CW-conjugated anti-mouse or IRDye 680CW-conjugated anti-rabbit IgG and washed again before being scanned on the Licor Odyssey.
Results
Assay Development
Optimization of the ATM activation conditions
Gamma irradiation causes single-strand breaks and DSB in DNA and induces DNA damage response.6,11 Efficient repair of DSB is critical to the cell because it is the most lethal form of DNA damage, and a single unrepaired DSB can be sufficient to kill the cell. In response to ionizing radiation, ATM is rapidly phosphorylated at serine 1981, a signature for ATM DDR pathway activation, and subsequently phosphorylates its downstream targets (
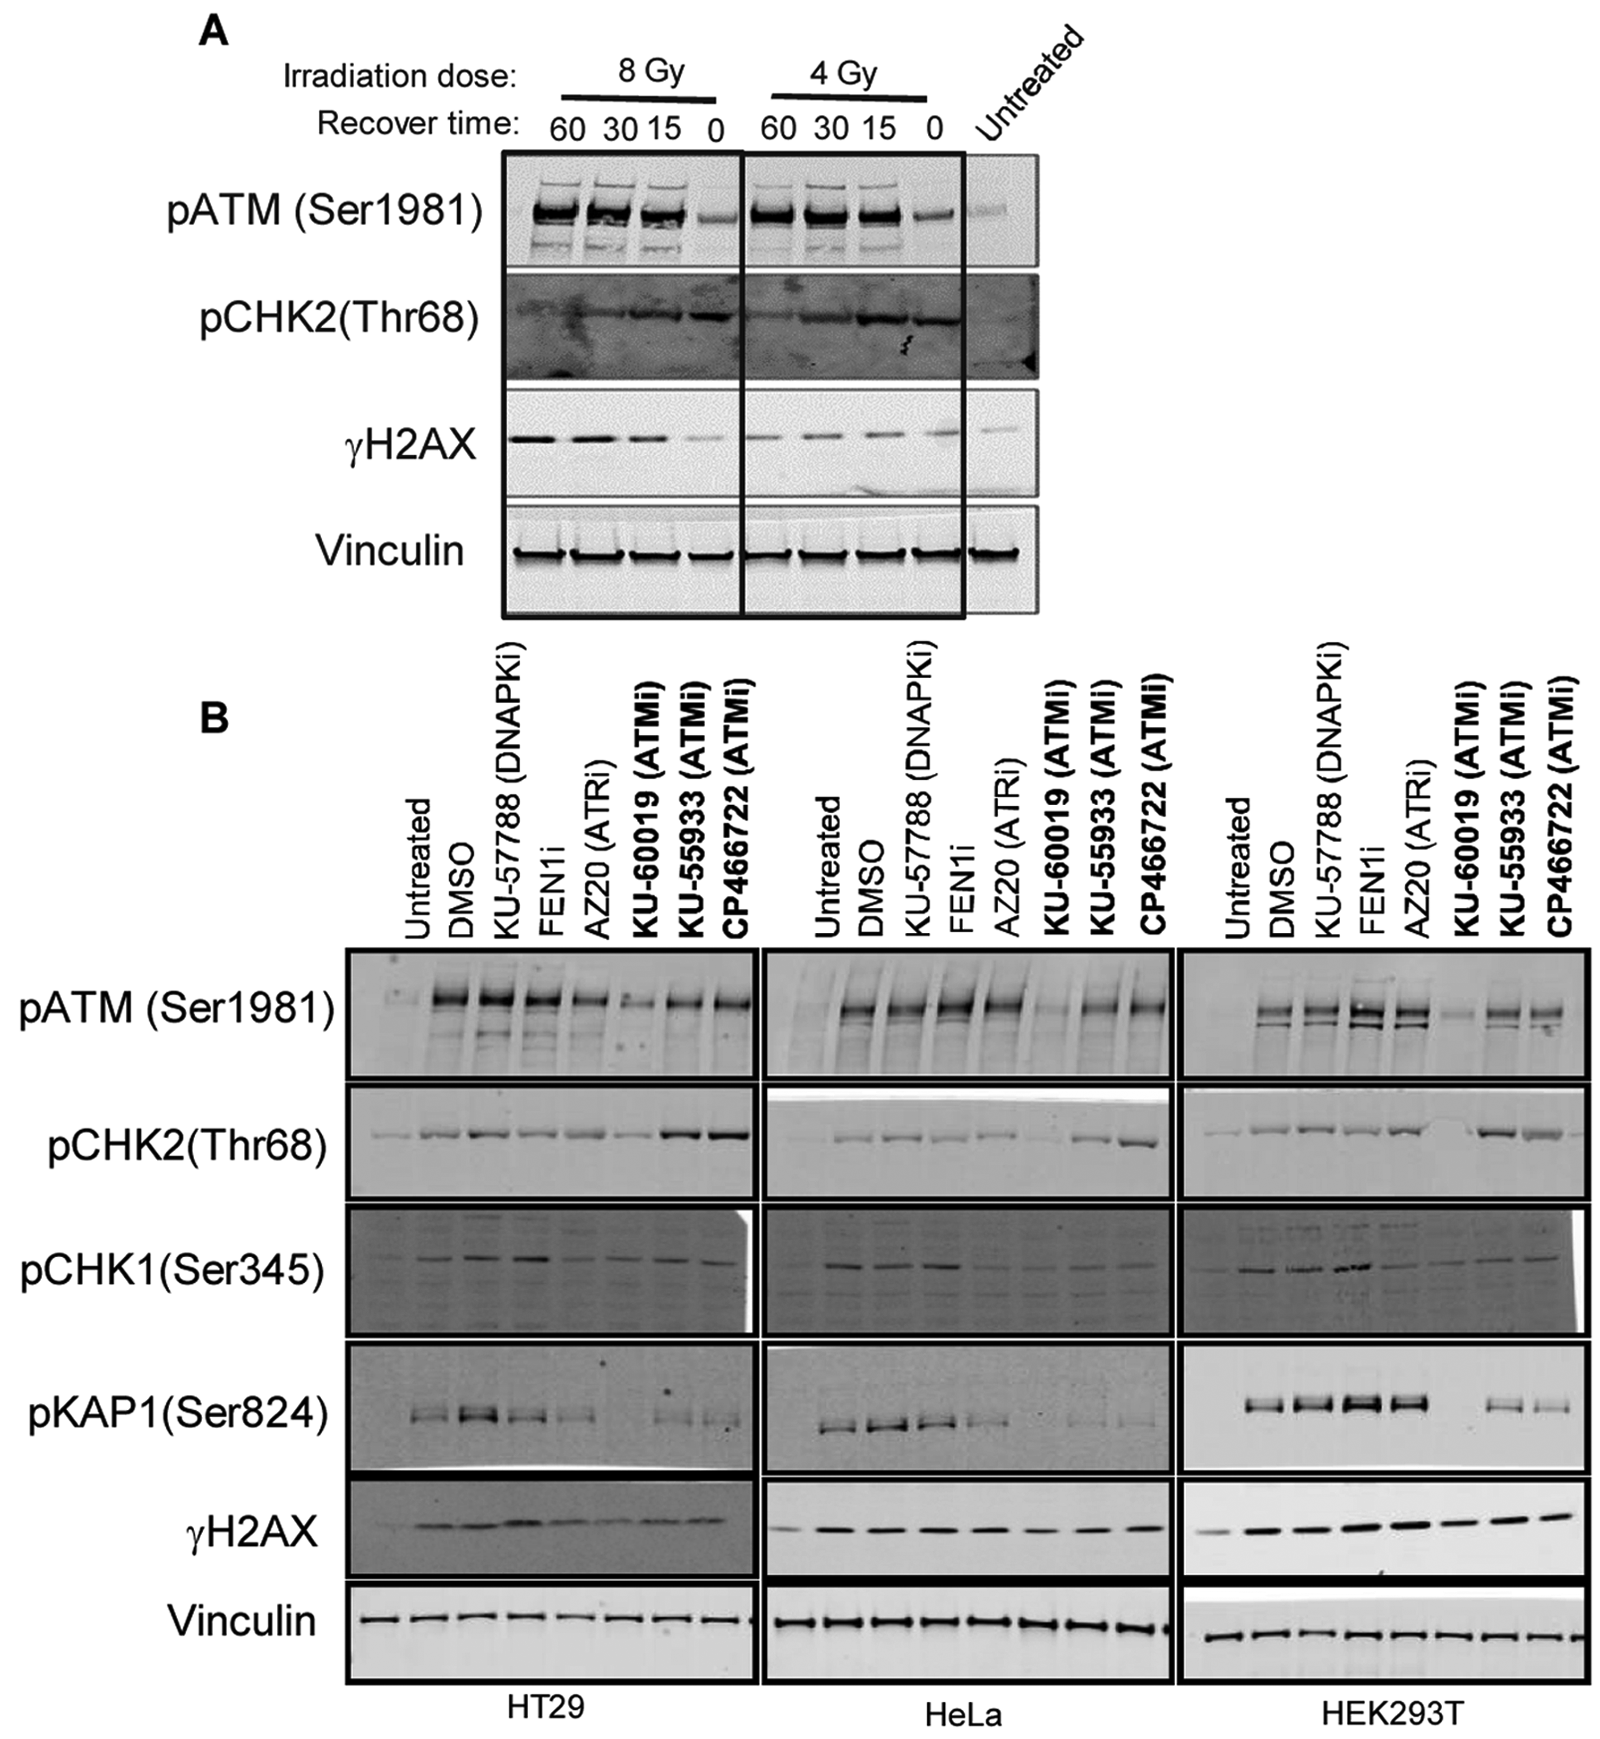
Validation of pATM (Ser1981) endpoint for cell-based screen. (
Validation of the antiphospho Ser1981 ATM antibody
We next examined the antibody specificity by testing whether known ATM inhibitors can specifically decrease the ionizing radiation (IR)–induced Ser1981 phosphorylation of ATM and if this inhibition has an effect on the downstream ATM target proteins using Western blots. HT29 cells were treated for 1 h with ATM-specific inhibitors KU-55933, 14 KU-60019, 15 and CP466722 16 and a range of other DDR inhibitors (DNA-PK: KU-57788, ATR: AZ20, and FEN1)3,17,18 at a concentration of 1 µM ( Fig. 1B ). The cells were then irradiated with 6 Gy and samples collected 1 h later. KU-60019 and to a lesser extend KU-55933 and CP466722 were able to lower the phosphorylation levels of ATM. For KU-60019, this inhibition was translated further downstream onto ATM targets, with pCHK2, pKAP1, and γH2AX levels also decreasing. The other ATM inhibitors showed a similar pattern when tested at higher concentrations (10 µM, data not shown). Similar effects were observed in HeLa and HEK293T cell lines, showing that response to IR and various inhibitors are not cell line specific. In contrast, DNA-PK and FEN1 inhibitors had no effect on phosphorylation levels of any of the proteins tested. Cells treated with the ATR inhibitor AZ20 showed a decrease in the phosphorylation level of CHK1, a downstream target of ATR, and also a slightly reduced level of γH2AX, also an ATR target. However, no apparent effect on ATM, CHK2, and KAP1 phosphorylation levels at this time point were seen for this inhibitor. pCHK1 levels were also decreased upon treatment of cells with ATM inhibitors. This is consistent with reports showing that ATM activity is necessary for rapid activation of ATR. 19
Development of the assay
We then sought to determine whether the phosphorylation of ATM and its downstream targets upon induction of DNA-damage with IR could be detected using an automated cell imager. To obtain a maximal signal, we treated cells with 6 Gy of ionizing radiation, and for a minimum signal, we either pretreated cells for 1 h with 10 µM KU-60019 prior to IR or did not expose them to radiation. After fixing and staining cells with pSer1981-ATM, pCHK2, γH2AX, and pKAP1 primary and Alexa Fluor 488–conjugated secondary antibodies, images of cells were collected using an ArrayScan VTI automated imager. Nuclei stained with Hoechst 33342 were considered to represent single cells, and average signal intensity using a compartmental analysis method was employed to measure activation of proteins in the ATM pathway ( Fig. 2A , B ). As seen in Figure 2A , all antibodies tested gave a good activation signal after IR treatment, and the algorithm used gave a good window between maximal and minimal (unirradiated or cells treated with KU-60019) signals. Because we showed that there was no difference between the basal level from unirradiated cells and the signal from cells treated with 10 µM KU-60019, we decided, for logistic reasons, to use the KU-60019 as the minimum signal control in the imaging assay being developed and subsequent HTS.
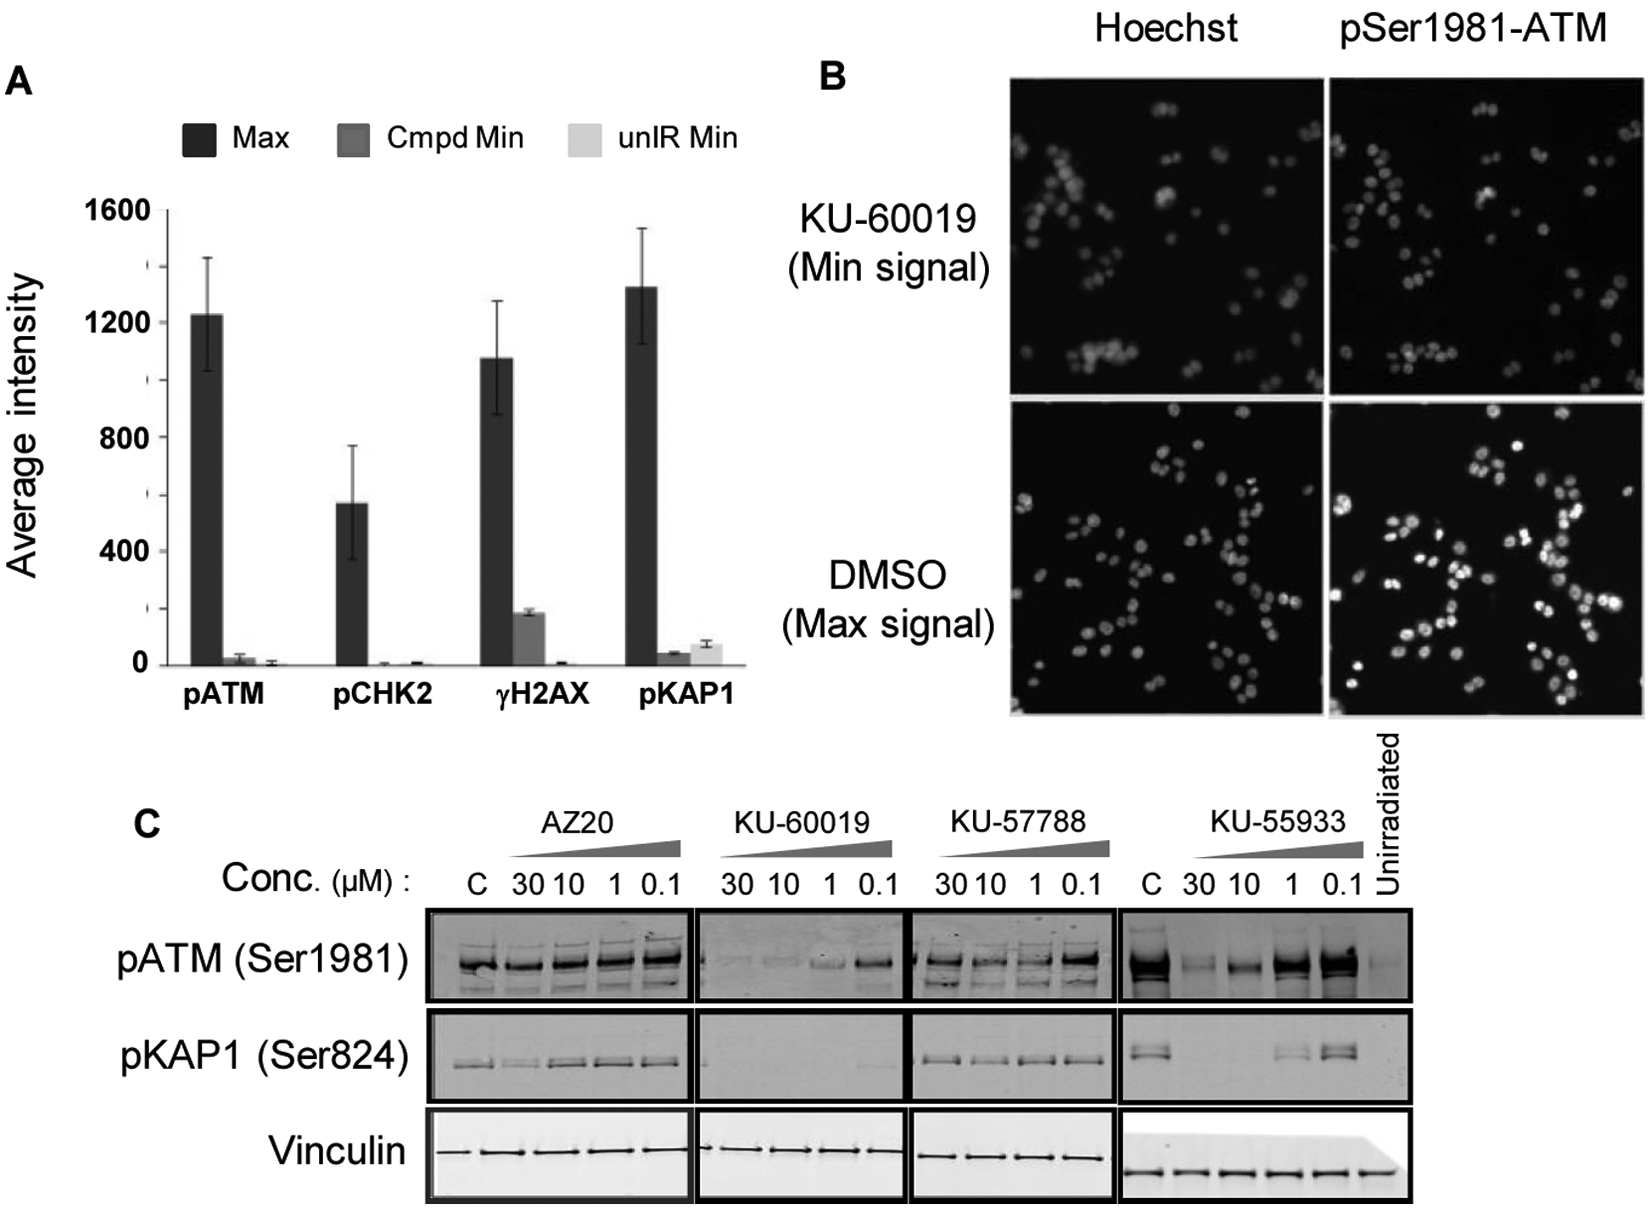
Measurement of phosphorylation levels of Ataxia-telangiectasia mutated (ATM) and its downstream substrates using high-content imaging and effects of inhibitors on the phosphorylation. (
We next investigated whether this quantitative imaging method was suitable for assessing the efficacy of known DDR inhibitors. We generated full dose-response curve for ATM inhibitors, KU-60019 and KU-55933, but also the ATR and DNA-PK inhibitors (AZ20 and KU-57788). As expected, pretreatment of cells with the ATM inhibitors decreased ATM Ser1981 phosphorylation and KAP1 levels in a concentration-dependent manner, measured both by Western blot analysis (
Fig. 2C
) and the cell fluorescent imaging assay (
Fig. 3
;
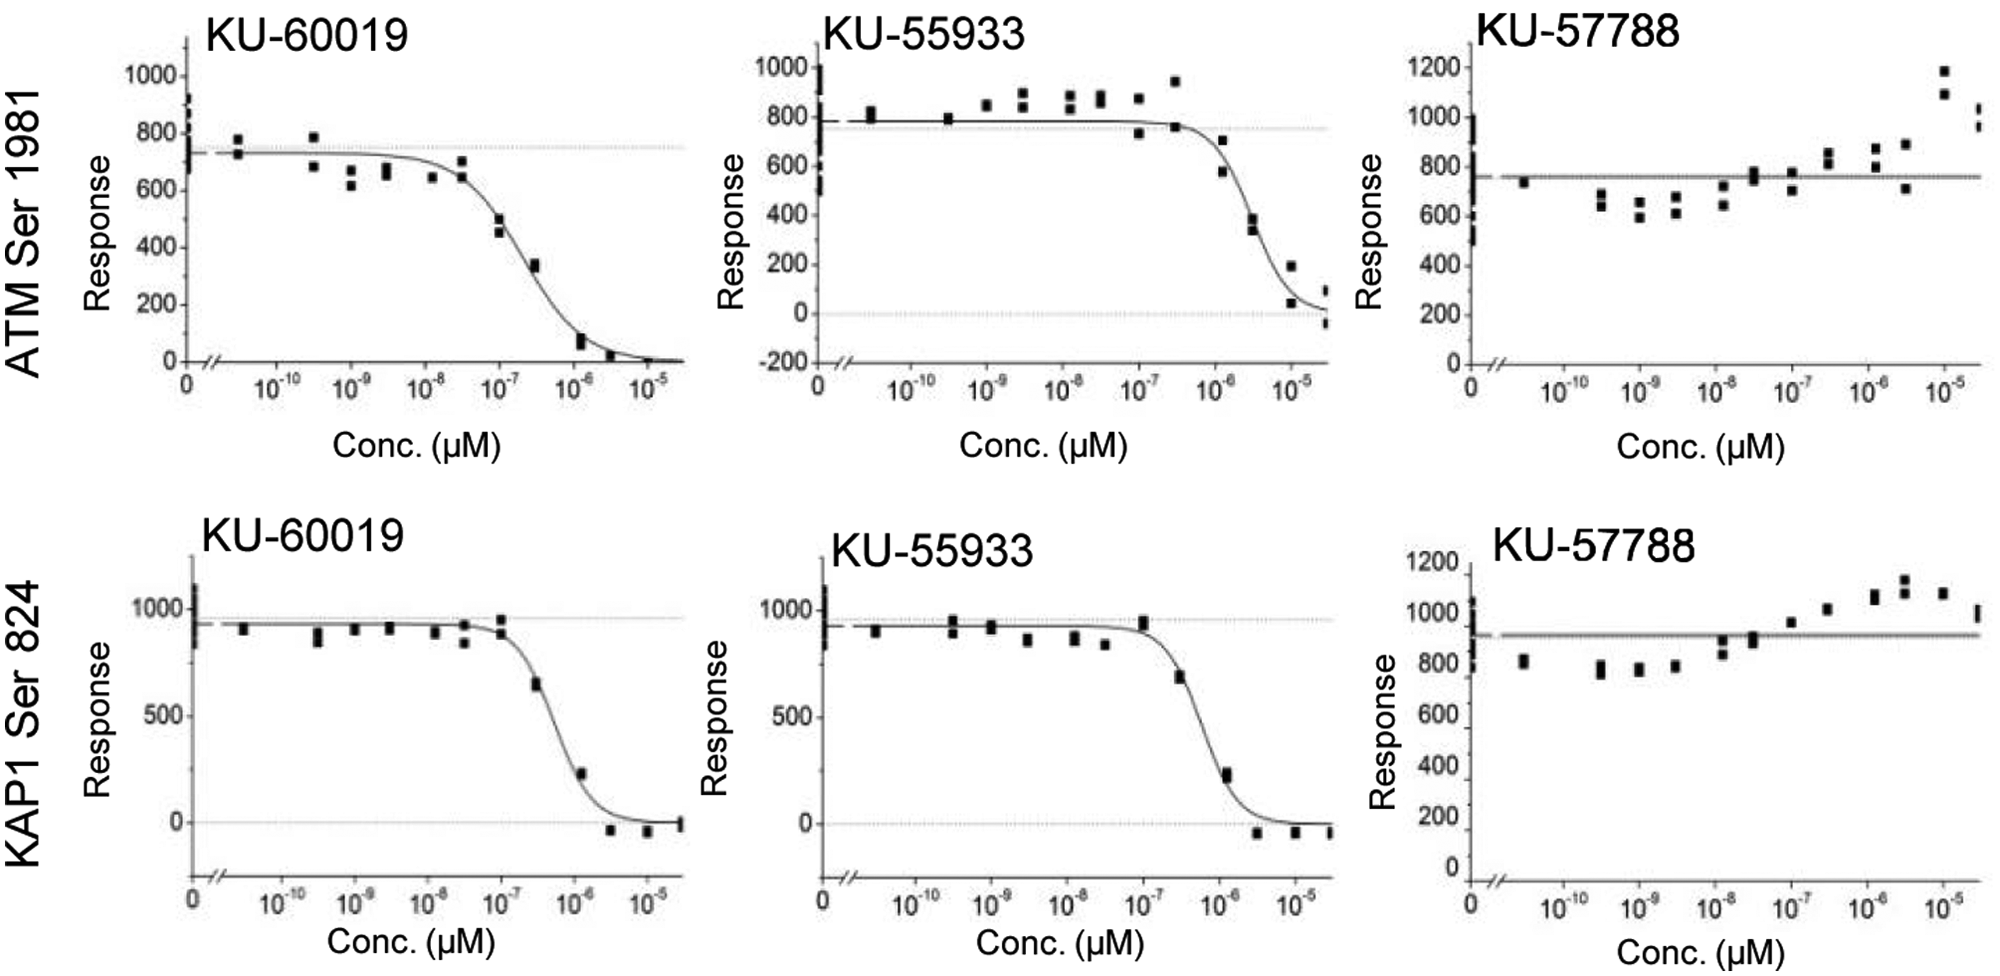
Dose-dependent inhibition of ataxia-telangiectasia mutated (ATM) and KAP1 phosphorylation. Cells were fixed and processed for pATM and pKAP1 immunofluorescence. The y-axis represents fluorescent signal response, where the Min signal was subtracted, and for curve fitting, Max and Min signal constrains were used. As Min signal cells were treated with 10 µM KU-60019, and for Max signal controls, cells were left untreated. Each plate contained at least 10 wells, with Max and Min controls randomly distributed across the plate.
Collectively, these results demonstrate that measuring the signal intensity of pSer1981ATM, pCHK2, and pKAP1 using high-content image analysis instruments can be used to identify inhibitors of the ATM pathway.
Assay Validation
Prior to initiating the full HTS, a pilot screen of a small set of the stratified compound collection (384 compounds) was conducted as a single shot at 30 µM. The compounds list included active compounds identified in a biochemical assay and confirmed as cell actives during the phospho-ATM cell assay development. Compounds were run in duplicate with a different plate/well distribution to estimate screening performance under fully automated conditions and assess assay reproducibility ( Fig. 4A ). In addition, a Max (irradiated cells), Min (cells pretreated with 10 µM KU-60019 before irradiation), and two Max/Min plates were included to establish signal-to-background ratios (defined as Max control divided by Min control) and Z′ factor ( Table 1 ). The Z′ factor is defined in terms of four parameters: the average (Av) and standard deviations (SD) of both the maximum (Max) and minimum (Min) controls. 21
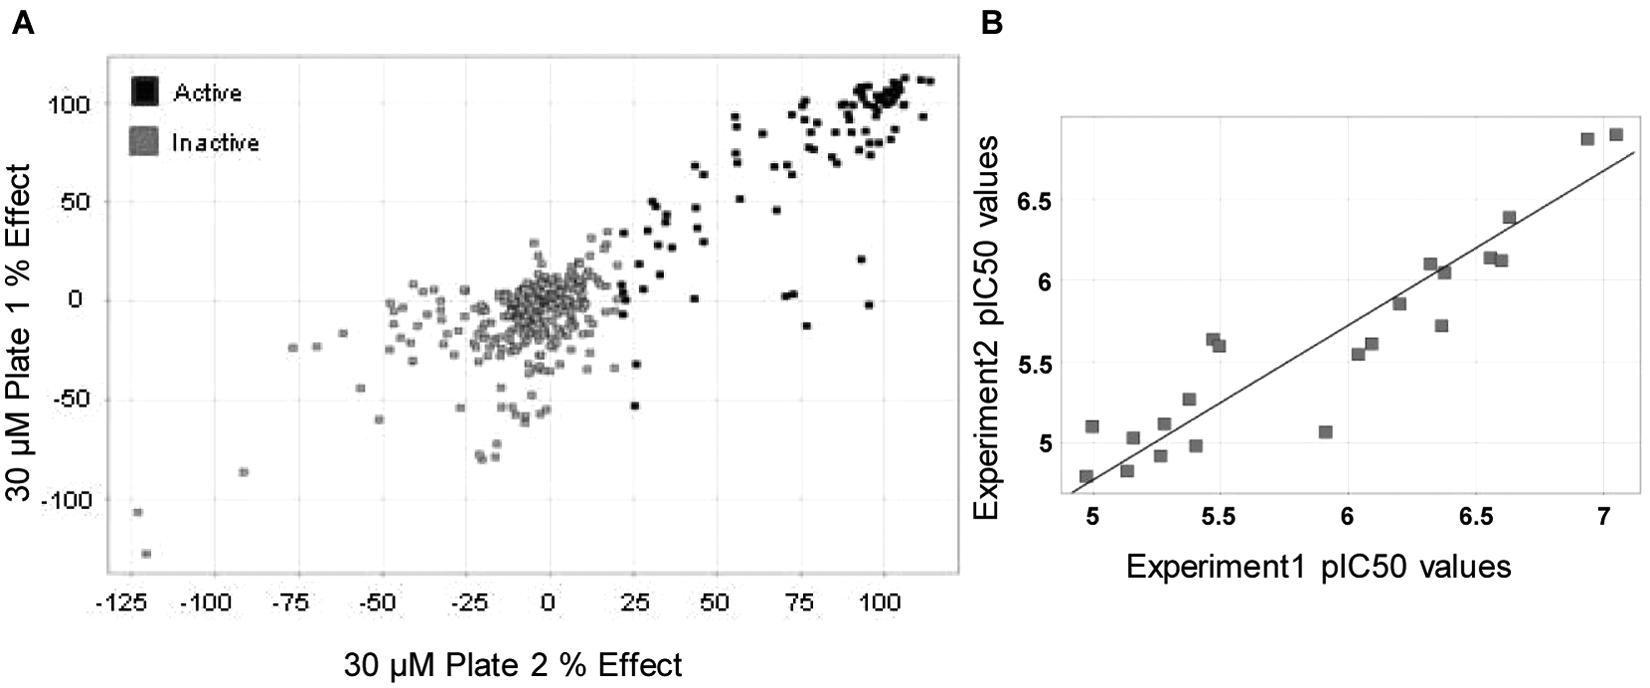
Validation of the established cell assay. (
Average Relative Fluorescence Unit Values Obtained for the Control Plates
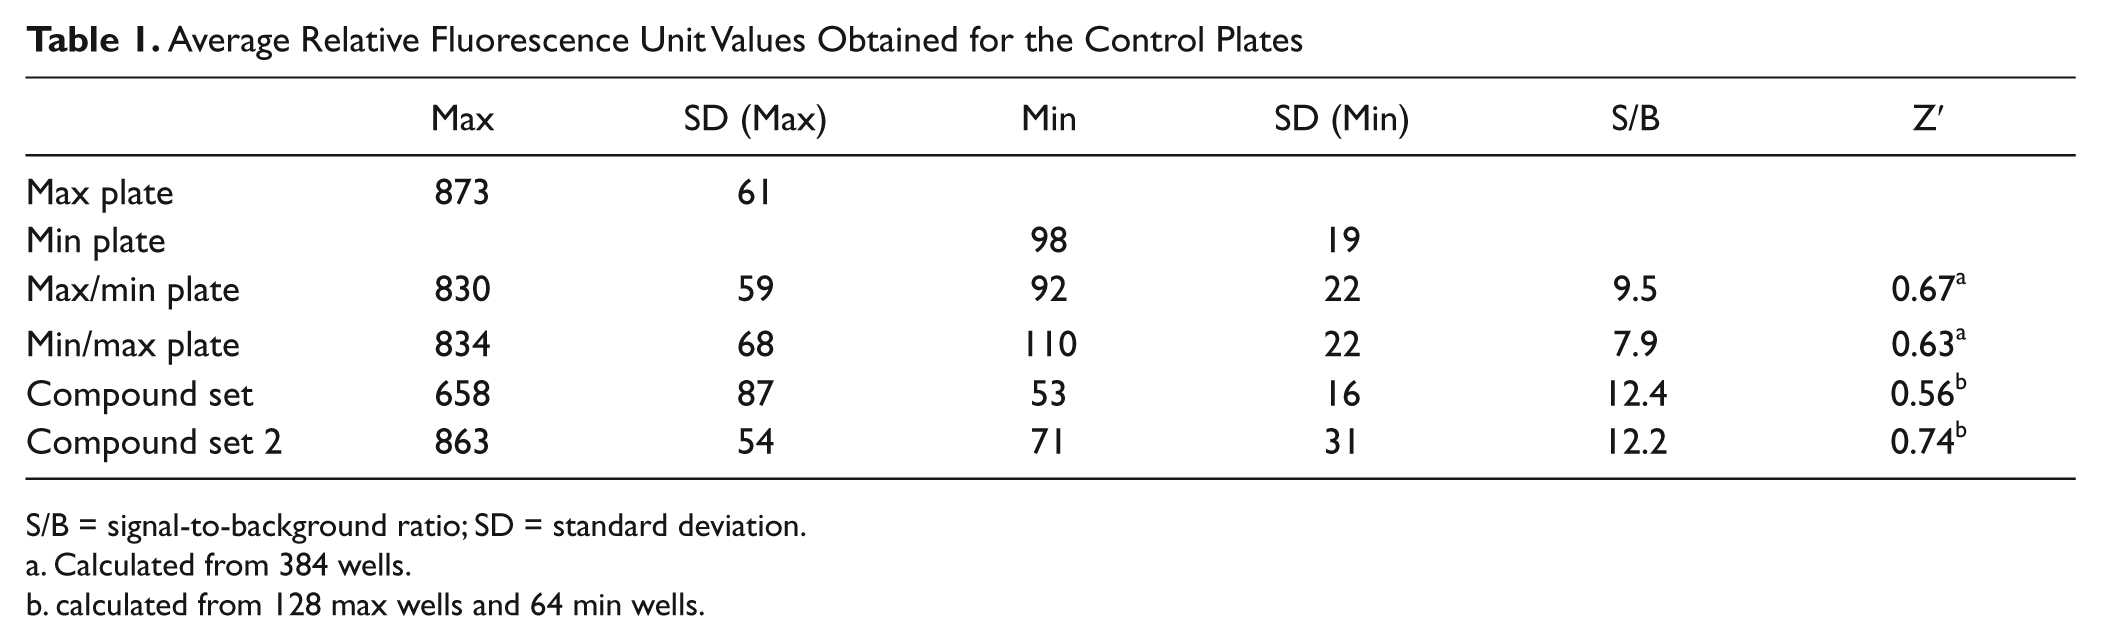
S/B = signal-to-background ratio; SD = standard deviation.
Calculated from 384 wells.
calculated from 128 max wells and 64 min wells.
Using a 21% inhibition threshold, the hit rate was calculated as 24%. The Z′ factor remained greater than 0.5 for all the plates, indicating the robustness of the assay and its suitability for a subset HTS run. We also performed dose responses of the active compounds on two separate occasions to further evaluate the assay reproducibility ( Table 1 ; Fig. 4B ). As can be seen, the Z′ factor for the two sets of compound plates was greater than 0.7, and the correlation between experiments is excellent, resulting in an orthogonal straight line fit equation of Y = 0.0011 + 0.952*X, R2 = 0.928.
HTS Compound Library Screening
Following assay validation, a subset of about 14 000 compounds, selected from the full screening collection, were tested. After pretreating cells for 1 h with 30 µM of each tested compound, cells were exposed to 6 Gy of ionizing radiation and incubated for an additional 1 h. Every batch of 10 plates in the screen included a control “Max/Ref/Min” plate, where DMSO was used for maximal signal (Max) and KU-60019 compound was used at 10 and 0.1 µM concentration for minimal (Min:100% inhibition) and reference (Ref: ~50% inhibition) signal, respectively. For data analysis, an in-house pattern correction algorithm was applied to correct for any potential spatial and temporal patterns (Kjellberg, unpublished data). The algorithm is based on the wavelet regression method, a computationally very efficient approach to data analysis. 22
Activity flag cutoffs were then based on both percentage effect from raw data and corrected data. The percentage effect for each compound was calculated as follows: %effect = 100 × [1 – (test compound – median min control)/(median Max control – median min control)]. Based on the average effect of the min control and two times their standard deviation, the cutoffs for active compounds was set at ≥35% for raw data and ≥28% for corrected data (i.e., any compound that exhibited greater average percentage activity than the cutoff parameter was declared active). An additional statistical cutoff >2 interquartile ranges below the 25th percentile has also been included in identifying active compounds ( Fig. 5 ). With these parameters, a hit rate of 4% was observed for a total of 449 hits. Thirty-six compounds were removed from the analysis because they showed cytotoxicity by affecting cell number, giving false-positive hits. The HTS compound concentration-response assay was run under identical conditions to the HTS single-shot version but in duplicate using a 10 mM starting concentration source plate and an eight-point dose response with a twofold serial dilution. Final assay concentrations were therefore 100 µM at the highest concentration and decreasing in half-log units accordingly.
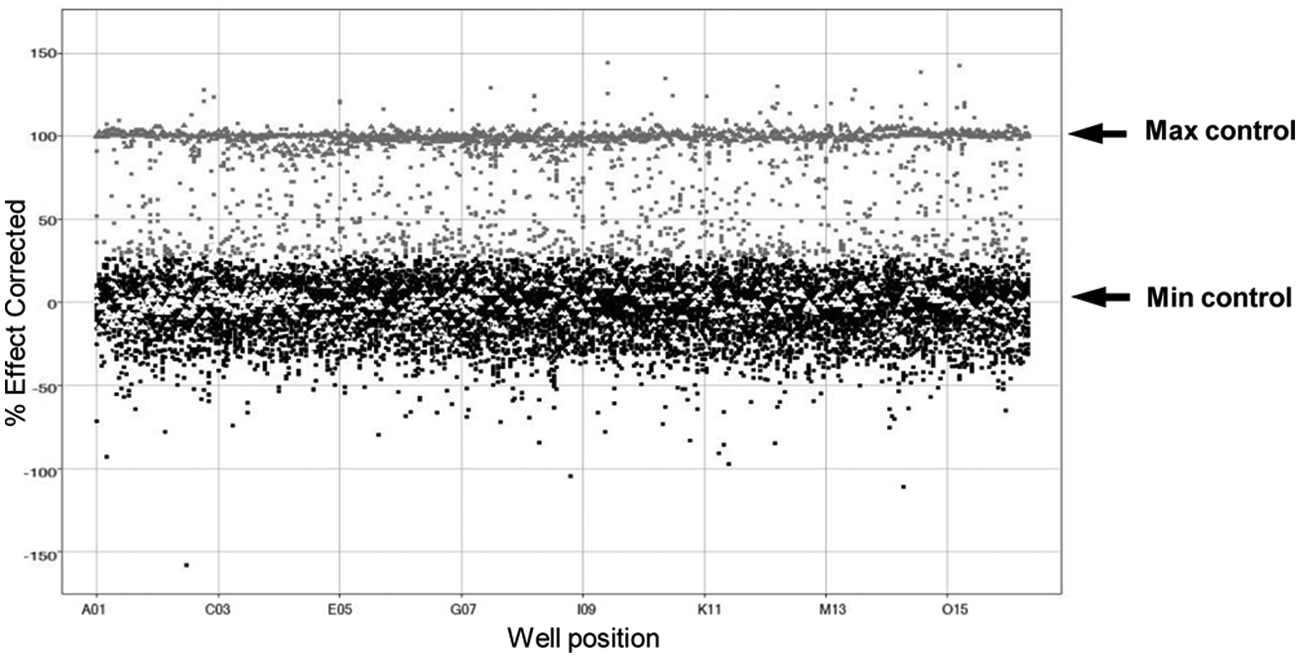
Analysis of the high-throughput screening campaign. Scatterplot data of single-shot data tested at 30 µM concentration is shown. Additional Max/Min plates were also added containing KU-60019 compound at 10 µM concentration as Min control (white triangles) and DMSO only as Max control (gray triangles). Data were collected, and percentage effect was calculated as a result. An activity threshold has been nominally set as: active ≥28% (gray squares), inactive <28% (black squares).
Discussion
Small-molecule inhibitors of the ATM pathway could represent a promising opportunity for cancer therapy, working either by enhancing the clinical efficacy of radiotherapy and existing chemotherapies or by synthetic lethality-based mechanisms. In this article, we describe the development and validation of a high-content HTS assay for the discovery of such molecules.
Several cellular methods have been described for measuring ATM activity. Most of them are low-throughput approaches such as Western blot or colony-formation assays. Recently, a reporter FRET biosensor was published allowing monitoring of ATM activity in live cells, but this approach has limitations because of its irreversibility. 23 Many commercial kits measuring the activity of ATM downstream targets (phospho-CHK2, phospho-p53, phospho-4E-BP1, γH2AX) exist, such as enzyme-linked immunosorbent assay (ELISA), SureFire, flow cytometry, and reporter assays. These assays can be adapted for high-throughput and drug discovery applications. We decided to develop a high-content imaging assay over a traditional ELISA because it allows quantification of multiple parameters simultaneously and enables further endpoint addition if needed. Furthermore, analysis of the acquired images can give a phenotypic characterization of the cells and the effects of the drugs on cell survival, proliferation, or apoptosis based on the nuclear morphology as well as on the intended biochemical target.
All published imaging assays for DDR have been following histone H2AX phosphorylation on Ser139 (γH2AX). γH2AX is a sensitive marker for DNA DSB. Upon DSB formation, one or more of the PI3K-like kinases such as ATM, ATR, or DNA-PK are activated and phosphorylate H2AX among other relevant substrates. A high-content method was published last year 24 looking at γH2AX foci formation following chemical-induced DNA damage to identify inhibitors of the DDR pathways. Our assay is specific for ATM inhibition, as we are measuring the direct effect on the auto-phosphorylation site on serine 1981. This is the first published assay looking at ATM autophosphorylation by high-content imaging following exposure of cells to ionizing irradiation. Furthermore, we have ensured this assay was amenable to HTS screening. These two points made it fairly innovative in the field.
Several publications showed that phosphorylation of S1981 is not DNA damage specific in itself in the ATM function25–27; however, the combination with ionizing radiation and therefore introduction of DNA damage link it to DDR. As an initial screen, our goal was to identify all inhibitors of ATM activity. These can be subsequently further analyzed for their activity in the ATM role in DNA damage response. As we mentioned earlier, the use of an imaging assay allows us to multiplex with other endpoints such as pCHK2 and KAP1 at a later stage in the lead generation process (i.e., post-HTS). Indeed, we have already showed that these endpoints can be successfully used in the imaging assay under the established conditions.
We started with three well-established cancer cell lines and quickly prioritized the HT29 line as these cells are well characterized, robust, easy growing, and therefore provided us with a simple and biologically relevant model system to develop our assay. IR has been shown to rapidly induce ATM autophosphorylation on serine 1981 that initiates ATM kinase activity. To our knowledge, this is the first time IR was used in an HTS format.
We initially investigated the best radiation dose and timing postexposure by measuring levels of ATM phosphorylation as well as γH2AX, a known marker of DNA damage, by Western blots. We tested the specificity of our assay by investigating downstream targets of ATM, such as CHK2 and KAP1, upon treatment of cells with known inhibitors of various DDR pathways. ATM inhibitors (KU-55933, KU-60019) and DNA-PK inhibitor (KU-57788) were discovered during previous drug discovery projects and have been well characterized. In agreement with previous measurements,14,15,17 we observed a decrease in the phosphorylation levels of ATM, which translated further downstream onto ATM targets, with pCHK2, pKAP1, and γH2AX levels also decreasing when cells were treated with ATM inhibitors. DNA-PK and FEN1 inhibitors had no observable effects on phosphorylation levels of any of the proteins tested, showing that our selected antibody was indeed specific for pATM and our assay sensitive to ATM inhibition and selective over other DDR pathway targets. These findings were confirmed by Western blots analysis, further reinforcing the validity of our assay. By running a pilot screen of selected active compounds, we showed the robustness and reproducibility of the assay and demonstrated Z′ values greater than 0.5 for all plates in the run. The slight effect noticed on pATM with KU-57788 on the Western blot ( Fig. 2C ) might suggest that inhibition of DNA-PK slows down the formation of DSB recognition complexes, resulting in a slower recruitment of the DNA repair machinery, leading to a lower activation of ATM. Such compounds inhibiting proteins recruited at the site could appear as false-positive in our assay.
Finally, we used this assay to run a 14 000-compound subset of our proprietary library. We established a logistics of 40 plates per batch to keep the relevant timing of the assay. The average effect of the min control and the standard deviation were used to define the cutoff parameter. This resulted in an overall 4% hit rate.
In summary, we have developed an HTS-compatible cellular assay for the identification of small-molecule inhibitors of ATM activity using high-content imaging technology. We have demonstrated that this assay is specific, robust, and sensitive, with an average Z′ factor greater than 0.5. This assay was used to screen a subset of 14 000 compounds from our library and allowed identification of positive hits, which were subsequently followed up by a dose-response analysis in a typical drug discovery approach.
Footnotes
Acknowledgements
We thank Claire Bannaghan for technical assistance during the HTS campaign and Michael Tonge and Carolyn Blackett for their expert support during the HTS data analysis. We would also like to thank Kerry Shea, Alan Lau, Pia Thommes, and Jonathan Wrigley for their comments on the manuscript and scientific input.
Declaration of Conflicting Interests
The authors declared no potential conflicts of interest with respect to the research, authorship, and/or publication of this article.
Funding
The authors received no financial support for the research, authorship, and/or publication of this article.
References
Supplementary Material
Please find the following supplemental material available below.
For Open Access articles published under a Creative Commons License, all supplemental material carries the same license as the article it is associated with.
For non-Open Access articles published, all supplemental material carries a non-exclusive license, and permission requests for re-use of supplemental material or any part of supplemental material shall be sent directly to the copyright owner as specified in the copyright notice associated with the article.