
Abstract
Rift Valley fever virus (RVFV) is an emerging infectious pathogen that causes severe disease in humans and livestock and has the potential for global spread. Currently, there is no proven effective treatment for RVFV infection, and there is no licensed vaccine. Inhibition of RNA binding to the essential viral nucleocapsid (N) protein represents a potential antiviral therapeutic strategy because all of the functions performed by N during infection involve RNA binding. To target this interaction, we developed a fluorescence polarization–based high-throughput drug-screening assay and tested 26 424 chemical compounds for their ability to disrupt an N-RNA complex. From libraries of Food and Drug Administration–approved drugs, druglike molecules, and natural product extracts, we identified several lead compounds that are promising candidates for medicinal chemistry.
Introduction
Rift Valley fever virus (RVFV) is a mosquito-transmitted bunyavirus that causes disease ranging from a mild influenza-like illness to hemorrhagic fever in humans. Domestic livestock such as sheep, goats, and cattle are also susceptible to RVFV infection. The mortality rate for young and newborn animals is close to 100%, and the virus causes abortion in pregnant livestock. 1 Although historically confined to sub-Saharan Africa, RVFV has spread north to Egypt and was discovered outside of Africa for the first time in 2000. Disease symptoms can be particularly severe when the virus encounters a naïve host, and outbreaks along the Nile River in Egypt and the Arabian Peninsula resulted in several devastating epidemics.2–5 Global climate change, international trade, and the ability of RVFV to infect a broad range of mosquito species demonstrate the possibility that RVFV will continue to disseminate geographically. Currently, treatment options for RVFV-infected individuals and livestock are extremely limited. Ribavirin has been used to treat patients during past outbreaks, but its use is limited because of undesirable side effects and concern related to the potential to cause birth defects.6,7 T-705 (favipiravir), a promising new broad-spectrum inhibitor of viral hemorrhagic fever, is able to inhibit bunyavirus replication in experimentally infected hamsters when administered 24 h after infection. 8 Studies with influenza virus showed that T-705 metabolite inhibits the viral RNA-dependent RNA polymerase. 9 However, the efficacy of the drug in RVFV-infected humans or livestock has not yet been determined. The paucity of drugs currently licensed and available to treat viral hemorrhagic fever infection, coupled with the ability of RNA viruses to mutate and develop resistance to drugs, emphasizes the need for continued identification of antiviral compounds.
RVFV has a tripartite single-stranded negative-sense RNA genome that encodes seven proteins. One of these gene products, the nucleocapsid (N) protein, is a 26 kDa RNA-binding protein that plays an important role during several stages of the viral replication cycle. N helps to package the RNA genome into the budding virus particle and regulates transcription and translation of viral mRNA and protein.10–12 To discriminate between different species of RNA in the host cell, N recognizes and binds to specific sequences and secondary structures of viral RNA.13,14 After an initial specific binding event, N switches to a nonspecific mode of binding and forms polymers along the entire length of the viral genome or antigenome. This encapsidation process protects the viral RNA and prevents the formation of double-stranded RNA during replication, which would activate the host antiviral response. Inhibition of RNA binding to the essential viral nucleocapsid protein represents an attractive antiviral therapeutic strategy because all of the functions performed by N during an infection involve RNA binding. Furthermore, significant progress has been made toward exploiting nucleocapsid protein as a drug target in HIV, respiratory syncytial virus, and influenza.15–17
To target RNA-binding activity of N, we developed a fluorescence polarization (FP)–based high-throughput drug-screening (HTS) assay to test chemical compounds for their ability to disrupt an N-RNA complex in vitro. From libraries of Food and Drug Administration (FDA)–approved drugs, druglike molecules, and natural product extracts, 26 424 compounds were screened, and we identified 79 compounds that are inhibitors of the N-RNA interaction. We then retested the 79 hit compounds to eliminate false-positives and used FP and filter binding assays to determine the IC50 of lead compounds.
Materials and Methods
Compound Libraries
The chemical libraries screened are a subset of either commercially available small-molecule or natural product extract libraries maintained at the NERCE National Screening Laboratory (NSRB), located in the ICCB Longwood screening facility (Harvard Medical School, Boston, MA). Compounds are stored desiccated at −20 °C in 384-well plates at comparable concentration of either 3.3 to 10 mM or 2 to 15 mg/mL in DMSO. Because the 23rd and 24th columns are empty for all compound plates we tested, these columns were used for screening controls.
Fluorescent RNA Aptamer to RVFV Nucleocapsid N Protein
The sequence of the fluorescent RNA aptamer used in the screening was obtained in our laboratory by in vitro selection. 18 Briefly, a pool of randomized RNA molecules was positively selected for efficient binding to RVFV N protein using a SELEX procedure. After 16 rounds of selection, sequencing of individual clones revealed several families of RNA aptamers. Representative clones of each family were then either terminally truncated or mutated by substitution of internal motifs. The best and smallest N aptamer resulting from these studies was the 15.12 TRNK COMP clone. 19 For that reason, this aptamer was chosen to be the one used during HTS. A 35-nucleotide-long 15.12 TRNK COMP RNA was chemically synthesized, 3′ end labeled with FAM, and HPLC purified (TriLink Biotechnologies, San Diego, CA). The fluorescent label was attached to the RNA using a six-carbon linker. The fluorescent RNA was stored at −80 °C at a concentration of 86 µM in water.
Overexpression and Purification of RVFV Nucleocapsid N Protein
The nucleocapsid N protein sequence used in this study is derived from the experimental live attenuated RVF virus vaccine strain (MP-12), 20 cloned into the N-terminal (His-Asn)6-tag pEcoli plasmid (Clontech, Mountain View, CA). The N protein expression plasmid was transformed into Escherichia coli strain BL21 (DE3) pLysS. Transformed cells were grown at 37 °C in LB media containing 100 µg/mL ampicillin and 50 µg/mL chloramphenicol until OD600 = 0.6 to 0.8. Protein expression was induced by addition of IPTG to a final concentration of 0.5 mM, and cultures were grown overnight at room temperature (24 °C). Cells were harvested by centrifugation and stored at −80 °C until processed. A total of 8 to 12 L of culture was processed weekly for 3 months. Because of the modest level of soluble protein expression, a total amount of purified N protein from 130 L of culture was required for the screening.
Cells were lysed by resuspension of thawed pellets in Solulyse (Genlantis, San Diego, CA) lysis buffer containing a cocktail of protease inhibitors (Thermo Fisher Scientific, Waltham, MA). Benzonase (EMD Chemicals, Rockland, MA) was added to the lysis buffer at a concentration of 12 U/mL to degrade nucleic acids. Insoluble cell debris was removed from the lysate by centrifugation at 10 000 rpm for 30 min at 4 °C. The (His-Asn)6-tagged N was batch purified from the cell lysate by using Co2+-charged Talon resin (Clontech). The resin was washed with 15 volumes of wash buffer (35 mM imidazole, 500 mM NaCl, 1 M urea, 50 mM Tris-HCl pH 8.0), and the protein was eluted with four volumes of elution buffer (300 mM imidazole, 500 mM NaCl, 50 mM Tris-HCl pH 8.0). The eluate was dialyzed overnight against the storage buffer (500 mM NaCl, 10% v/v glycerol, 50 mM Tris-HCl pH 8.0, two buffer changes) and concentrated using 10 K MWCO centrifugal filters (Amicon Millipore, Billerica, MA). After flash freezing with liquid nitrogen, the aliquots were stored at −80 °C. The purity of the protein was checked by sodium dodecyl sulfate polyacrylamide gel electrophoresis (90%; evaluated by Coomassie staining), and the protein concentration was determined by the absorbance at 280 nm using extinction coefficient obtained from the ExPASy Web site (33 920 M–1 cm–1).
HTS
The binding of the fluorescent RNA aptamer to the RVFV N protein was monitored by FP. The high-throughput assay tested the ability of compounds to prevent the binding of the RNA aptamer to N ( Fig. 1 ). Screening was performed in 384-well low-volume flat-bottom black microplates (Corning #3820, Corning, NY). A pilot screening (June 2011) was used to test and streamline the standard operating procedure. The frozen stocks of 10-fold binding buffer, N protein, and fluorescent RNA were sent to the screening facility ahead of time (NSRB/ICCB Longwood, Harvard Medical School, Boston, MA). The optimum N protein and RNA aptamer concentrations were previously determined to be 12 µM and 10 nM, respectively, because that resulted in a greater than 90% fractional saturation of the N-RNA complex. 19 The assay was further checked for HTS robustness during the pilot screening.
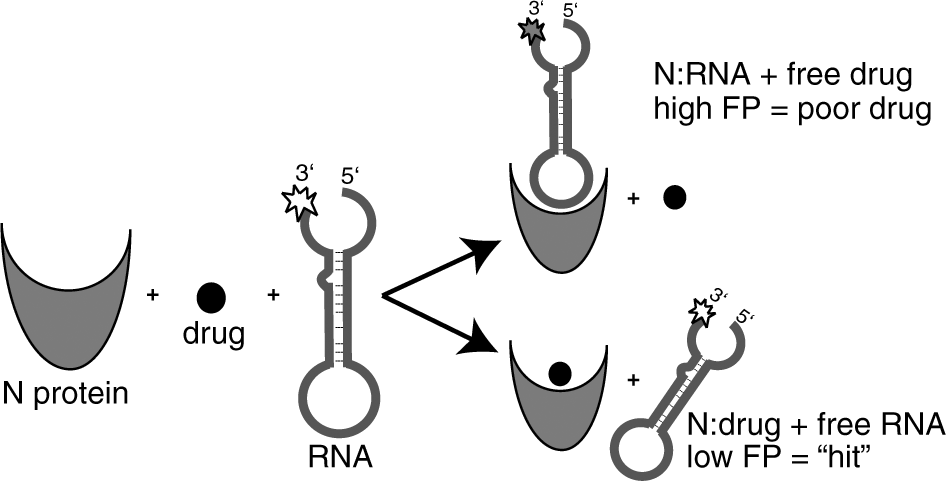
High-throughput screening methodology. Schematic diagram of the technique used to identify compounds that inhibit RNA binding to N protein in vitro. N was loaded into 384-well microplates; drug compound was added and then fluorescently labeled RNA. After a 30-min incubation, fluorescence polarization (FP) measurements were taken. A high FP signal indicates that the compound was unable to prevent the RNA from binding N protein and would not be considered a potential antiviral drug. A low FP signal is indicative of a compound that inhibits the N-RNA interaction. Experimental wells that exhibit a low FP signal are considered “hits,” and the compounds in those wells could be good drug candidates. Hits identified during the initial screen are subjected to further testing and verified in follow-up assays.
The main screening (August 2011) started by the thawing and pooling of all N protein aliquots. The concentration of the resulting stock was 130 µM (i.e., 11-fold concentrated) and was kept at 4 °C. Each morning, the amount necessary to screen the plates for the day was removed and diluted from 11- to 1.2-fold with binding buffer. The binding buffer (final concentration) is composed of 10 mM Hepes-NaOH pH 8, 150 mM NaCl, 20 mM KCl, and 5 mM MgCl2. The standard operating procedure consists of several sequential steps. First, 10 to 26 assay plates were consecutively loaded with 10 µL of N protein (1.2-fold in binding buffer) with a Matrix WellMate dispenser (Thermo Scientific) in all but the last (24th) column, which received 10 µL of binding buffer. Second, 100 nL of each compound from the compound plates was transferred into the corresponding wells of the 384-well assay plates with the Epson Compound Transfer Robot. Third, 2 µL of fluorescent RNA was added to all wells of the assay plates with a Multidrop Combi nL (Thermo Fisher Scientific). After a quick centrifugation, the plates were incubated in a closed drawer at room temperature (24 °C) for 30 min. Finally, the FP was measured with the EnVision plate reader (Perkin Elmer, Waltham, MA) and the FITC FP 480 (excitation) and 535 (emission) filters. Results were stored in Microsoft (Redmond, WA) Excel files.
Data Analysis and Hit Scoring
The results were transferred into a single Microsoft Excel 2011 file and analyzed using the FP, parallel, and perpendicular channels values. The FP is defined as 21

where FP is polarization and Is and Ip are parallel and perpendicular polarization emission light, respectively. Practically, the FP signal is calculated as follows:

where FP is polarization in milliP (mP) units and S and P are the values of the parallel and perpendicular channels, respectively. The G-factor used during our screening was preset to 0.63.
To evaluate the robustness of the assay, we quantified the Z′ parameter 22 for each plate using the FP values of columns 23 and 24. A Z′ value greater than 0.5 describes a suitable HTS assay. 22 The FP values of column 24 (RNA alone) are called positive controls because they give the same signal that one would expect with an ideal compound (i.e., inhibiting 100% of protein-RNA interactions). Accordingly, FP values in column 23 (N protein and RNA) represent negative controls.
Several parameters were first calculated: the sum of the fluorescence of the parallel and perpendicular channels, the average and standard deviation of positive and negative controls, the plate Z′, and the amplitude of FP signal for the plate (called amplitudeFP, i.e., average of negative controls minus average of positive controls). Experimental wells were excluded from scoring if the sum of the parallel and perpendicular channels was lower than 10 million or greater than 20 million fluorescence units. These data allowed us to eliminate compounds that interfere with the assay detection either through quenching or compound fluorescence. The next calculation expressed the percentile of FP for an experimental well (X) related to the plate FP amplitude, provided that the well was not excluded:

where FPX is the FP value for the well and the other parameters are described in previous paragraphs. The %FPX values were then filtered in if they were below a certain percentile or filtered out if they were above. Finally, the %FPX for duplicates was averaged, and the resulting hits were visually inspected.
Cherry-Picking and Final Compound Assessment
The protocol used during HTS was modified as follows. The final volume of the reaction in binding buffer 1x was increased from 12.1 to 24.6 µL, which includes 20 µL of N protein at a concentration of 14.8 µM, 4 µL of fluorescent aptamer RNA at 61.5 nM, and 0.6 µL of diluted compound in DMSO 50% v/v. The cherry-picked compounds (1.2 µL each in DMSO) were received in a 384-well plate format. A volume of 2.4 µL DMSO 25% v/v was added to each 1.2 µL of compound, so that 0.6 µL of diluted compound (in DMSO 50% v/v) could be pipetted per reaction. Except for DMSO, all other molecules, including N protein, fluorescent aptamer RNA, and compound, were tested at the same concentrations as the ones used during HTS. However, we checked that the slightly higher DMSO concentration used (1.2% vs. 0.8%) did not affect FP (data not shown). The compounds were tested in triplicate, and the results were analyzed as described above for the main HTS experiment.
FP Competition Assay
FP competition assays were performed in 30 µL volumes and 384-well microplate format. Samples were prepared by incubating varying concentrations of compound (8.9 nM–500 µM final) or natural product extract (2.37E–5-0.266 µg/µL final) for 20 min at room temperature (~24 °C) with 10 µM N in binding buffer (10 mM Hepes-NaOH pH 8, 150 mM NaCl, 20 mM KCl, and 5 mM MgCl2). Next, FAM-labeled aptamer RNA (10 nM final) was added and the reaction incubated for 1 h at room temperature. FP values were measured using a Biotek Synergy 2 plate reader. Excitation and emission wavelengths were 485 nm and 528 nm, respectively, and the G-factor was 0.87. Binding profiles were plotted, and IC50 values were calculated using GraphPad Prism software.
Filter Binding Competition Assay
Samples were prepared by incubating varying concentrations of compound (8.9 nM–500 µM final) or natural product extract (2.37E–5-0.266 µg/µL final) for 20 min at room temperature with 10 µM N in binding buffer (10 mM Hepes-NaOH pH 8, 150 mM NaCl, 20 mM KCl, and 5 mM MgCl2). Next, 1 µL of radiolabeled RNA (32P-UTP, 25 000 cpm/µL) was added to the reaction, and the final volume was 12 µL. After incubation at room temperature for 1 h, reactions were diluted to 100 µL with ice-cold binding buffer and filtered through presoaked nitrocellulose filters (Millipore HAWP). The filters were washed twice with 500 µL ice-cold binding buffer and dried, and the radioactivity retained on filters was measured by scintillation counting. Binding profiles were plotted, and IC50 values were calculated using GraphPad Prism software.
Results and Discussion
HTS Assay Validation
To identify compounds that could be used to develop prophylactic molecules against RVFV infection, we developed a screening assay to find inhibitors of the RVFV nucleocapsid (N) protein RNA-binding activity. Because viral RNA molecules are too large to chemically synthesize and fluorescently label, we used an in vitro selection technique to isolate a small RNA aptamer that bound to N protein with high affinity. Competitive binding experiments using an RNA molecule that mimics the panhandle structure formed by the S segment of RVFV genomic RNA showed that the aptamer RNA binds to the same region on N as the viral panhandle.
19
We used FP to measure binding between N and a fluorescent RNA aptamer. Compounds that inhibit the protein-RNA binding decrease the FP value because the anisotropy of the free fluorescent RNA is less than that of the N-RNA complex. For instance, an ideal compound inhibiting 100% would have the same FP value as the positive control (RNA alone). During the HTS screen, the average value for the positive controls was 158.3 ± 8.3 mP, and the negative control average was 282.7 ± 10.8 mP, resulting in an amplitude of 124.4 mP (
We validated our binding assay for HTS by testing in a low-volume 384-well plate format and calculating the HTS-related Z′ score. 22 Initial experiments conducted in our own and Dr. Brian Geiss’ laboratory (Colorado State University, Fort Collins, CO) showed that Z′ values at or above 0.5 could be obtained (data not shown). When the experiments were done in a complete HTS environment (NSRB/ICCB Longwood, Harvard Medical School, Boston, MA), the value of the pilot Z′ plate was 0.51, whereas the plates’ Z′ of the main screen ranged from 0.437 to 0.801. The overall Z′ average of 0.73 ± 0.052 and the 95% confidence interval for the mean of 0.73 ± 0.01 underscored the validity of the assay for HTS.
Compound Screening Results
The main screen was conducted over two days with 4708 and 21 076 compounds tested during the first and second day, respectively. The first three series of experiments were done in duplicate. The stable and reproducible nature of the controls, as evidenced by individual plate Z′ values, the reasonable number of positive hits, and the rare occurrence of positive-negative pairs among duplicates (99.4% of duplicate values were 15% or less apart) as well as the limited amount of N available to work with prompted us to screen the last 52 compound plates only once in the initial screen. Compounds showing activity in this broad initial screen would be verified in follow-up assays.
Hit analysis was done for all compound well values using Microsoft Excel (see the Materials and Methods section), and the results are reported in Figure 2 and Table 1 . We chose a cutoff of no less than 42% inhibition (an FP amplitude decrease of more than 58%), which led to a total of 79 hits (hit rate at 0.3%, 79/26 424). The average inhibition for the hits was 52.5 ± 13%, with a 48% median. Five of the 79 hits (6%) may be either false-positive or -negative: one of the two duplicate values would not have registered the compound as a hit on its own. Fifty-four of the hits belong to natural products extracts libraries ( Table 1 ).
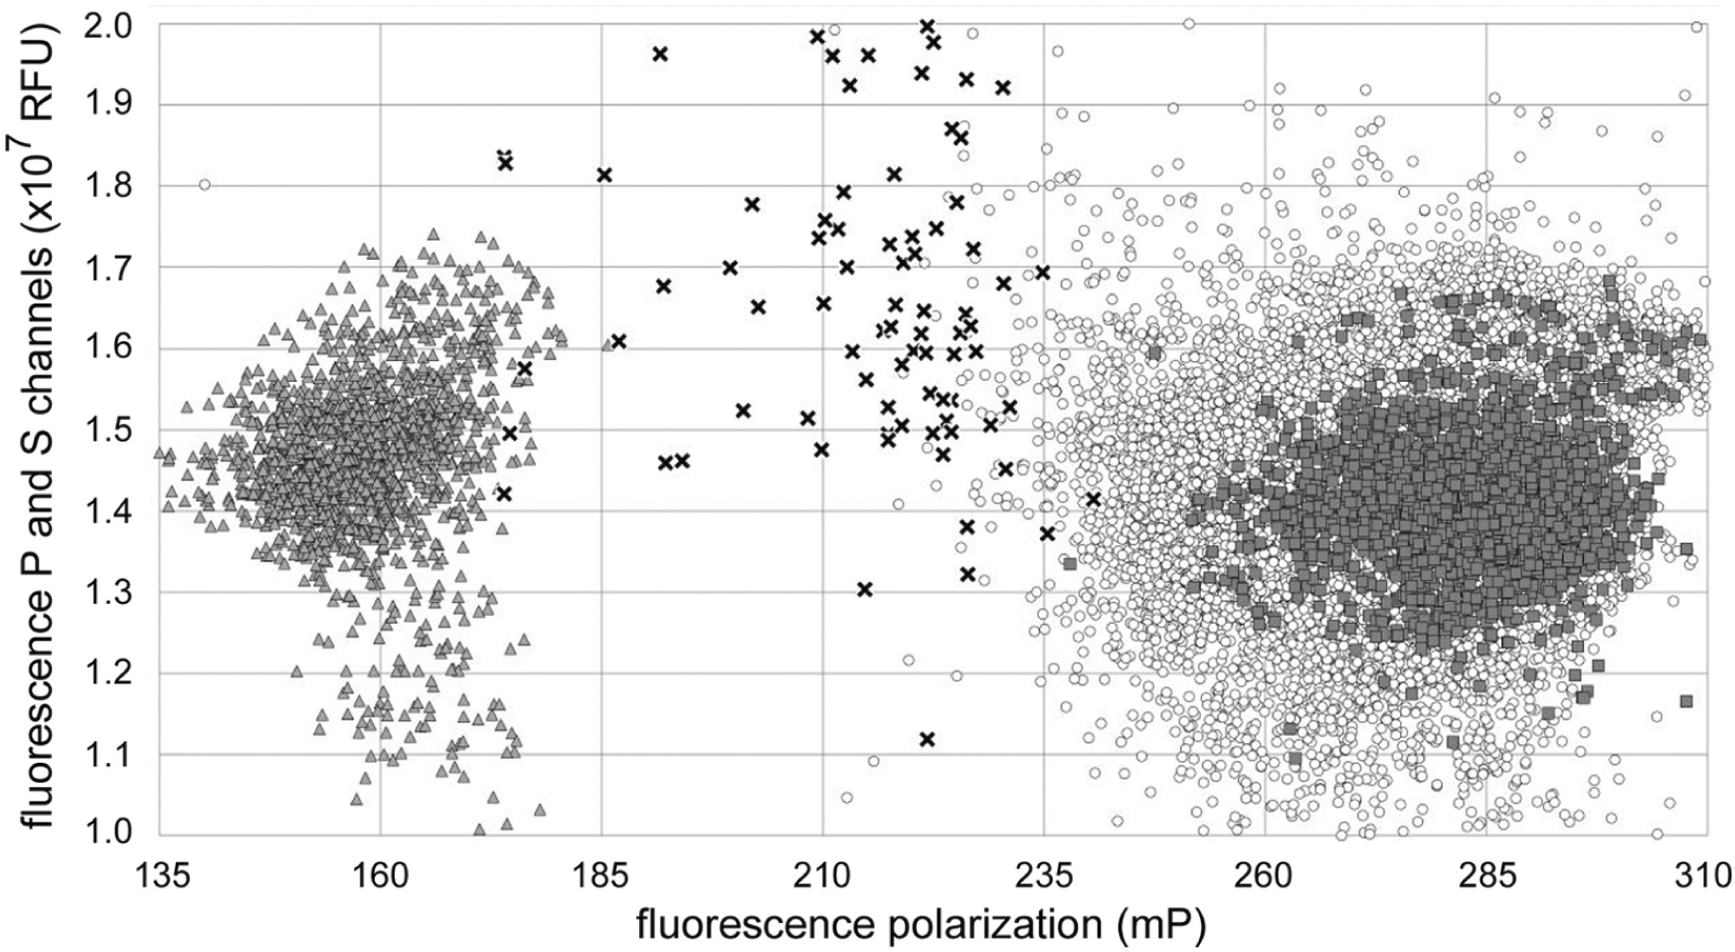
Scatter plot of high-throughput screening results. The x-axis represents the fluorescence polarization in mP units for each well. The y-axis represents the sum of the parallel and perpendicular fluorescence channels in relative fluorescence units. The limits of the y-axis correspond to the values used to filter in experimental values during hit analysis (between 1 and 2 × 10⁷ RFU). Positive (RNA alone) and negative (RNA and protein, no compound or extract) controls are indicated by dark triangles and dark squares, respectively. The values for the 79 hits and 26 345 nonhit compound wells are indicated by black crosses and open circles, respectively.
Summary of Statistical Data from the High-Throughput Screen
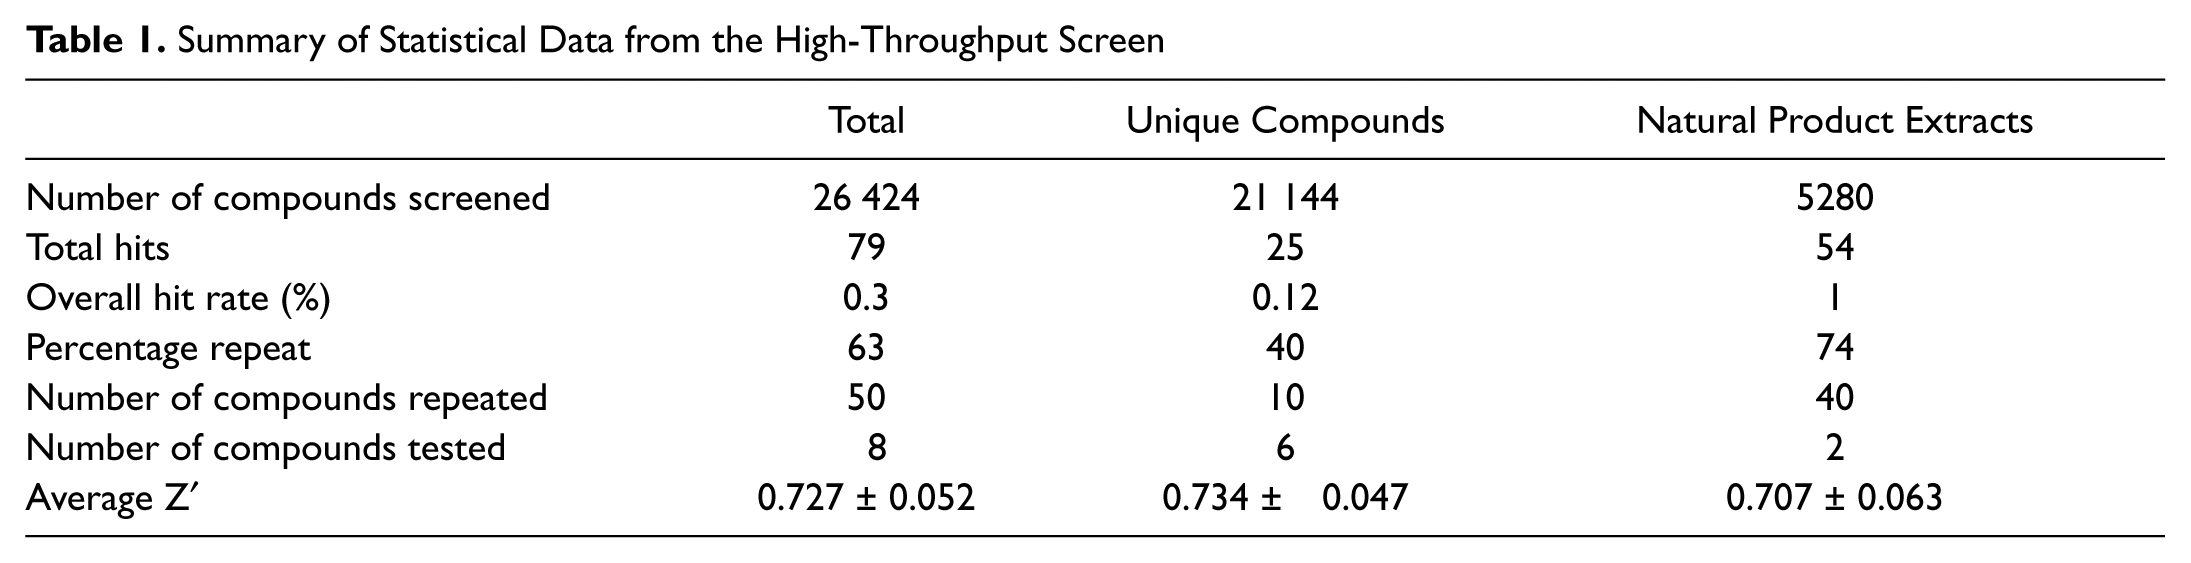
To validate the hits, we tested the 79 compounds and extracts in 384-well plates in our laboratory. We doubled the reaction volume and threefold diluted the stock of compounds we received, so a small volume of compound could be pipetted effectively. We checked that the small increase of DMSO in the final reaction had no effect on the binding yield (data not shown). The total confirmation rate was 63%: 40% for unique compounds and 74% for natural products extracts ( Table 1 ).
Structural analysis of the 79 hit compounds revealed that 4 were from Life Chemicals’ F1860 series of aryl-benzofuran compounds. Two other molecules, Life Chemicals F0862-0529 and Chembridge 5406174, contained a quinone with an attached derivatized benzene ring ( Table 2 ). We have yet to pursue medicinal chemistry of these compounds to determine critical features of the inhibitory mechanism.
Lead Compounds and Natural Product Extracts
Competitive binding assays were conducted using fluorescence polarization, with the exception of quinacrine, which was done using a filter binding assay technique previously described by Ellenbecker et al. 19 ND, not determined.
Topotecan caused protein precipitation; none of the other compounds caused obvious precipitation.
Dose-Response Studies
Cherry-picked compounds that were confirmed as giving a positive result in our laboratory were purchased, and the IC50 values for five commercially available compounds were determined using FP. Competitive filter binding assays were also conducted to ensure that the results obtained using FP were accurate ( Fig. 3 ). Chemical structures, results from the HTS, and results from the dose-response assays for five unique compounds are summarized in Table 2 . Nearly all of the compounds tested had an IC50 value in the low micromolar range (5–17.2 µM). Suramin, the best inhibitor of N binding RNA in the HTS assay, is an FDA-approved drug that has been used to treat trypanosomiasis. Suramin also exhibits antiretroviral activity in vivo by inhibiting reverse-transcriptase enzymes and has been shown to have an affinity for purinergic binding sites.18,23,24 These data suggest that in our system, suramin prevents formation of the N-RNA complex by interacting with the RNA binding cleft of N. Suramin is amenable to medicinal chemistry, as evidenced by the several derivatives that have been described.
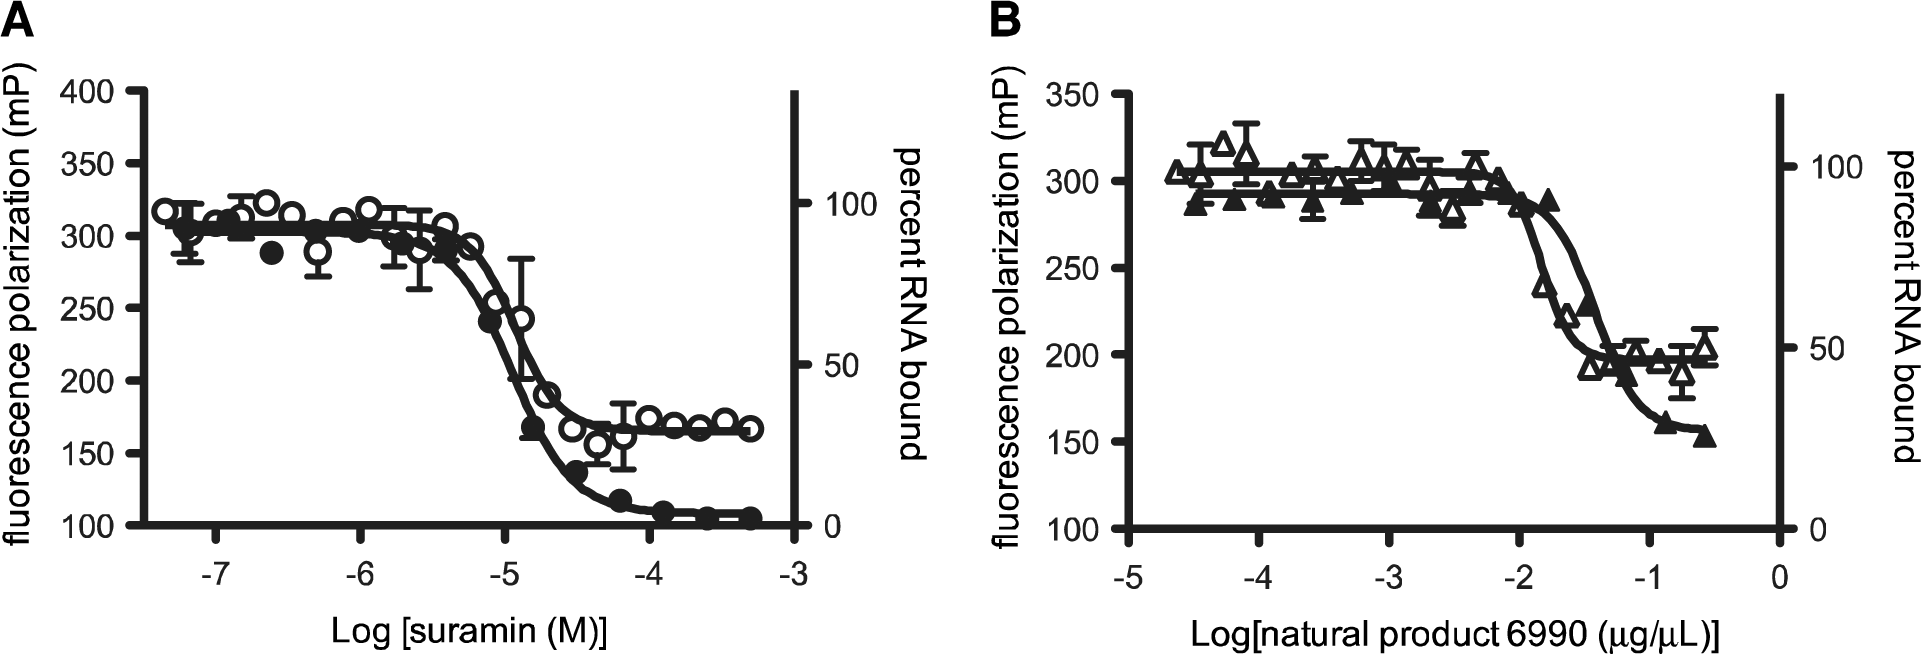
Dose-response curves of suramin and natural product extract 6990. Nitrocellulose filter binding assays (closed symbols) and fluorescence polarization (FP; open symbols) were used to measure the ability of either suramin (A; circles) or natural product extract 6990 (B; triangles) to inhibit binding of aptamer RNA to N. The competition assays involved incubating a fixed concentration of N with varying concentrations of compound and either fluorescent or radiolabeled RNA. For the filter binding assay, the amount of radiolabeled (32P-UTP) aptamer RNA retained on filters was measured by liquid scintillation counting, and the percentage RNA bound is plotted versus compound or natural product extract concentration. The FP experiments used fluorescently labeled aptamer RNA, and the FP signal (mP) is plotted versus compound or natural product extract concentration. The IC50 value calculated for suramin using a filter binding assay (A; closed circles) was 11.3 µM and using FP (A; open circles) was 16.3 µµM. The IC50 value calculated for natural product extract 6990 using a filter binding assay (B; closed triangles) was 0.038 ng/µL and using FP (B; open triangles) was 0.015 ng/µL. Similar experiments were conducted to calculate IC50 values for the other unique compounds and natural product extract ( Table 2 ). The results are the average of at least two independent experiments.
The IC50 value of quinacrine dihydrochloride was higher (162 µM) than the other compounds tested. Because quinacrine is known to intercalate into double-stranded DNA and structured RNA molecules, it is likely that this compound is targeting RNA itself, rather than the interaction with N protein directly.25–27 We hypothesize that quinacrine binds to the aptamer RNA, altering its structure and thus decreasing its affinity for N. Studies conducted in picornaviruses showed that quinacrine inhibited translation of viral proteins by binding to internal ribosome entry sites in the 5′ untranslated region of viral mRNA. 28
Two natural product extracts selected for further testing based on their performance in the HTS and follow-up assays were provided by Jon Clardy (Harvard Medical School). The IC50 values of extracts 6990 and 7051 were 0.015 ng/µL and 0.030 ng/µL, respectively. It is difficult to directly compare the commercially available compounds to the natural product extracts because we do not know the size or number of compounds present in an extract. As a loose approximation for discussion purposes, if we assume that the extracts contained ~20 compounds averaging ~300 Da, then the IC50 for the active component(s) would be in the low micromolar range (2–5 µM) and would be performing as well or even better than the unique compounds ( Table 2 ). We are currently seeking to identify and characterize the active component(s) in the natural product extracts that show good activity in the molecular target assay.
In conclusion, we describe a high-throughput molecular target assay that was used to identify FDA-approved drugs, unique compounds, and natural product extracts that have the ability to disrupt the RVFV N-RNA complex in vitro. Because N is indispensible for bunyavirus replication, we anticipate that a subset of the lead compounds or derivatives designed using medicinal chemistry will be efficacious in cell culture. 29 Specifically, we intend to test the ability of unique compounds and natural product extracts to inhibit translation of viral protein during the early stages of infection using an RVF reporter virus containing the gene for Renilla luciferase. The ability of the compounds to inhibit viral replication over the course of several days will be determined using plaque assays to quantitate production of viable virus. These secondary assays will allow us identify the compounds that have the potential to become antiviral drugs and provide us with promising candidates for future in vivo studies. The work presented here represents a promising start toward identifying new inhibitors of RVFV infection.
Footnotes
Acknowledgements
We gratefully acknowledge Richard Elliott, Olve Peersen, and Su Chiang for helpful discussions; Brian Geiss, Doug Flood, Brian Gowen, and Tao Ren for training and fruitful discussions; and Jon Clardy for providing the natural product extracts.
Declaration of Conflicting Interests
The authors declared no potential conflicts of interest with respect to the research, authorship, and/or publication of this article.
Funding
The authors disclosed receipt of the following financial support for the research, authorship, and/or publication of this article: This work was funded by the NIH/RMRCE grant AI065357 (subaward G-7826 to J.S.L.), the Center for Biomolecular Structure and Dynamics CoBRE (grant P20GM103546) Pilot Project award, and the University Grants Program at the University of Montana.