
Abstract
Methylation of DNA at the 5-position of cytosine (Cyt) is a well-studied epigenetic pathway implicated in gene silencing and embryogenesis. Recently, in addition to 5-methylcytosine (5mC), substantial amounts of 5-hydroxymethylcytosine (5hmC) have been detected in certain mammalian tissues. Here, we developed and validated a hydrophilic interaction liquid chromatography–tandem mass spectrometry (HILIC-MS/MS) method for the simultaneous determination of Cyt, 5mC, and 5hmC levels in biological samples. DNA was extracted with phenol-chloroform, hydrolyzed using 88% formic acid at 140 °C, separated using a bridged ethylene hybrid HILIC column, and analyzed by tandem MS. The linearity was established over the concentration range of 1 to 500 ng/mL for Cyt, 0.2 to 100 ng/mL for 5mC, and 0.1 to 50 ng/mL for 5hmC, and the correlation coefficients were all >0.99. Limits of detection were 1 pg/mL for Cyt, 45 pg/mL for 5mC, and 57 pg/mL for 5hmC, and the limit of quantification values for Cyt, 5mC, and 5hmC were 2 pg/mL, 90 pg/mL, and 100 pg/mL, respectively. The relative standard deviation (RSD) of the intraday precision ranged from 1.87% to 4.84% and the interday precision from 2.69% to 4.98%. The recovery of the method varied from 88.25% to 104.39%. The method was then applied to the analysis of DNA from biological samples, establishing its potential for helping researchers understand the roles of modified nucleobases in DNA.
Introduction
In mammals, DNA methylation is a well-known enzymatic modification at the 5-position of cytosine (Cyt) present predominantly within the CpG dinucleotide sequence and plays a crucial role in the genomic imprinting, inactivation of the X chromosome, embryogenesis, and carcinogenesis.1–4 Recently, in addition to DNA methylation, there has been renewed interest in another type of DNA modification, 5-hydroxymethylcytosine (5hmC). 5hmC is formed from 5-methylcytosine (5mC) by the Ten-Eleven Translocation 1 gene (Tet1); sequence homology proteins Tet2 and 3 are also expected to catalyze this same reaction.5–7 Substantial amounts of 5hmC were present in murine Purkinje cells, granule neurons, and embryonic stem cells6,8,9 but not detected in cancerous cell lines. 8 The function of 5hmC in these tissues is unclear. Valinluck et al. 10 reported that 5hmC at CpG sites was found to inhibit the binding of methyl-CpG binding protein 2 (MeCP2), which is a transcriptional repressor, suggesting a potential role of 5hmC in epigenetic regulation. In another study, bacterial DNA methyltransferases promoted the removal of formaldehyde from 5hmC in vitro to yield unmodified Cyt, 11 causing speculation that 5hmC is an intermediate in DNA demethylation.
Many commonly used assays distinguish 5mC from normal Cyt, such as combined bisulfite restriction analysis (COBRA), 12 methylated DNA immunoprecipitation (MeDIP), 13 and methylated-CpG island recovery assay (MIRA), 14 but none of these methods can distinguish between 5mC and 5hmC. 15 Several methods have been used to quantify global 5hmC content in mammalian genomics, including thin-layer chromatography, single-molecule real-time sequencing, and glucosyltransferase labeling.6,16,17 However, all of these methods have disadvantages: The thin-layer chromatography method has reduced accuracy, single-molecule real-time sequencing is not well suited for quantitative studies, and the glucosyltransferase labeling method cannot overcome the inconsistencies in the activity and stability of enzymes that can lead to incomplete reaction. Compared with the above methods, liquid chromatography–tandem mass spectrometry (LC-MS/MS) is considered the best and most widely accepted method for quantification.18–20 These techniques rely on the release of nucleosides by enzyme treatment. However, a complete enzymatic reaction cannot be readily ensured, and thus the accuracy might be affected. To avoid the use of enzyme, a method was developed for analyzing nucleobases hydrolyzed from DNA by formic acid and analyzed using gas chromatography–mass spectrometry (GC-MS), 21 but the method requires conversion of the DNA nucleobases to volatile derivatives for the separation, increasing the complexity of the sample pretreatment.
Here, we demonstrate a new approach for the simultaneous determination of global DNA methylation and hydroxymethylation levels in which the DNA sample was hydrolyzed by formic acid and analyzed by hydrophilic interaction liquid chromatography–tandem mass spectrometry (HILIC-MS/MS). The use of HILIC enables separation of nucleobases and allows adequate retention of polar analytes. 22 Also, the high organic mobile phase concentration gives HILIC a number of advantages such as the enhancement of overall sensitivity by increasing desolvation and reducing surface tension when mass spectrometric methods are used as detection devices. 23 Compared with the existing technology (LC-MS or GC-MS), this method circumvents the derivatization of nucleobases and incompletion of enzymatic hydrolysis, and it increases accuracy and precision due to the use of an isotope internal standard.
Materials and Methods
Chemicals and Reagents
Methanol, acetonitrile (high-performance liquid chromatography [HPLC] grade), and formic acid were purchased from Merck (Darmstadt, Germany). Cyt, 5mC, uracil (Ura), thymine (Thy), and ammonium formate (HPLC grade, purity >99%) were purchased from Sigma (St. Louis, MO). 5hmC was purchased from J&K Scientific, Ltd (Beijing, China). The internal standard was cytosine-2, 4-13C15N2 (Cyt13C15N2; Toronto Research Chemicals, Toronto, Ontario, Canada). All other reagents were of analytical grade. Purified water was obtained in the laboratory using a Milli-Q water system (Millipore, Bedford, MA).
Stock and Working Standard Solutions
Stock solutions (40 µg/mL) of each individual standard were prepared by accurately weighing the appropriate weight and dissolving it in methanol. For assessing the linearity of the method, the stock standard solutions were further diluted in acetonitrile-water (90:10, v/v) to prepare a series of mixed working standard solutions of the analytes that contained Cyt at a range of concentrations (1, 5, 10, 25, 50, 100, 250, 500 ng/mL), 5mC at a range of concentrations (0.2, 1, 2, 5, 10, 20, 50, 100 ng/mL), and 5hmC at a range of concentrations (0.1, 0.5, 1, 2.5, 5, 10, 25, 50 ng/mL), respectively. The range of the calibration curves was based on the published concentrations in clinical samples. 24 Cyt13C15N2 as an internal standard was dissolved in acetonitrile-water (90:10, v/v) to a final concentration of 20 ng/mL. Calibration curves were constructed using ratios of the observed analyte peak area to internal standard versus molar concentration of analyte. Quantitative analysis was performed using Agilent MassHunter Quantitative Analysis software (Agilent Technologies, Santa Clara, CA).
The stock standard solutions were stored in amber bottles at −20 °C. The working standard solutions were freshly prepared every week, stored in amber bottles, and frozen.
Biological Samples and DNA Extraction
All tissue samples were prepared from 4-week-old Sprague-Dawley (SD) rats. The samples were stored at −70 °C until analysis. DNA from samples was isolated by digestion with proteinase K at 45 °C for 24 h, followed by extraction with phenol-chloroform, and precipitation by the addition of 1/10 volume of sodium acetate (pH 5.4; 3 M) and 2.5-fold volume of absolute ethanol. Extracted DNA samples were dried under nitrogen and reconstituted with 0.5 mL of water. DNA purity was confirmed by comparing the ratio of UV measurements at 260 and 280 nm with the ratio of pure DNA standards, which should be between 1.7 and 1.9. The concentration of isolated DNA was determined by measuring UV absorbance at 260 nm.
Sample Preparation
A suitable volume of DNA solution (containing 1.0 µg DNA) and 20 µL internal standard solution in a 2-mL clear glass vial were dried under nitrogen. The residue was mixed with 0.2 mL of 88% formic acid and then hydrolyzed at 140 °C for 90 min as described previously. 21 The sample was cooled at room temperature and evaporated under nitrogen. The residue was dissolved in 0.2 mL acetonitrile-water (90:10, v/v) and centrifuged at 15 000 g for 5 min, and the supernatant was extracted for analysis by HILIC-MS/MS.
Hydrophilic Interaction Liquid Chromatography–Tandem Mass Spectrometry
The LC system consisted of an Agilent 1200 series binary pump, an autosampler, and a thermostatted column compartment (Agilent Technologies). Separation of the four target compounds was achieved with a bridged ethylene hybrid (BEH) HILIC (100 × 2.1 mm id, 1.7 µm) column (Waters Chromatography Ireland Ltd., Dublin, Ireland) equipped with an inline filter and a mobile phase composed of (A) ammonium formate 2.5 mM in Milli-Q water and (B) acetonitrile. The following gradient was used: 0–1.5 min, 95% B; 1.5–3.7 min, 95% B–50% B; 3.7–8.6 min, 50% B; 8.6–8.7 min, 50% B–95% B; and 8.7–14 min, 95% B for column equilibration. The flow rate was 0.3 mL/min, and DNA hydrolysis samples (10 µL typically containing 50 ng digested DNA) were injected onto a HILIC column.
The MS system consisted of an Agilent 6430B triple quadrupole mass spectrometer (Agilent Technologies) equipped with an electrospray ionization (ESI) source operating in positive mode using nitrogen as the nebulizer gas. The parameters of ESI-MS were as follows: nebulizer gas pressure, 35 psi; curtain gas flow, 10 L/min; capillary voltage, 4000 V; and turboprobe temperature, 350 °C. Quantification and qualitation were accomplished in multiple-reaction monitoring (MRM) mode, and the MS was operated at unit mass resolution for both precursor and product ions. MS parameters such as fragmentor voltage, collision energy, and ionization mode were optimized for each compound separately by injecting standard solutions without HILIC column.
Determination of Precision, Accuracy, Recovery, and Sensitivity of Liquid Chromatography–Tandem Mass Spectrometry
Precision and accuracy were determined by intraday and interday assays, and results were expressed as relative standard deviations (RSD). Three concentration levels (points 3, 5, and 7 of each calibration curve) were prepared by spiking a fixed amount of the internal standard solution with different working standard solutions. A minimum of five replicate determinations per concentration level were acquired in one validation day, and this was repeated on 3 days.
For the recovery experiment, known amounts of Cyt, 5mC, and 5hmC at three concentration levels (corresponding with the concentration level of points 3, 5, and 7 of each calibration curve, n = 3) were dried under a gentle stream of nitrogen. A 0.2-mL volume of 88% formic acid was added to the residue and the sample was hydrolyzed for 90 min at 140 °C. After redissolution by acetonitrile-water (90:10, v/v), HILIC-MS/MS was carried out in triplicate for each sample.
The limit of detection (LOD) was defined as the lower concentration with a signal-to-noise ratio for all ions of at least 3, and the limit of quantification (LOQ) was determined by decreasing concentrations of standard solutions until a response equivalent to 10 times the background noise was observed. The LOD and LOQ were calculated by dilute standards assay.
Percent of Methylation and Hydroxymethylation Calculations
The percent of methylation and hydroxymethylation was calculated using the following equations:
Q5mC, Q5hmC, and QCyt are the molar quantity of 5mC, 5hmC, and Cyt, respectively.
Results and Discussion
Mass Spectrometric Characterization of Cytosine, 5-Methylcytosine, and 5-Hydroxymethylcytosine
Optimization of the ion source and MS parameters for data acquisition were done by direct infusion of a 1-µg/mL solution of the analytes into the mass spectrometer at a flow rate of 0.3 mL/min, with the ESI source operating in both positive and negative modes. For evaluating the performance of the signal in each ionization mode, full-scan mass spectra were recorded, and the results indicated higher responses in the positive mode than in the negative mode for analytes. Consequently, ESI in the positive mode was selected for subsequent experiments. The most abundant ions of each compound were selected by continuous infusion in product ion scan mode to quantitation.
Figure 1 a reports a full-scan mass spectrum of Cyt. As shown in this figure panel, the most intense ion at m/z 112.1 corresponded to the protonated molecular ion [M + H]+. The collision-assisted dissociation (CAD) spectrum of the [M + H]+ of Cyt is presented in Figure 1b . From this figure panel, it is noted that the product ions m/z 95.0 and 69.1 were generated from the precursor ion m/z 112.1. This indicates that the most abundant product ion at m/z 95.0 was a good candidate to monitor the quantitative transition of m/z 112.1/95.0 during the CAD reaction. Moreover, the multiple second transitions of m/z 112.1/69.1 can be used as a confirmatory ion.
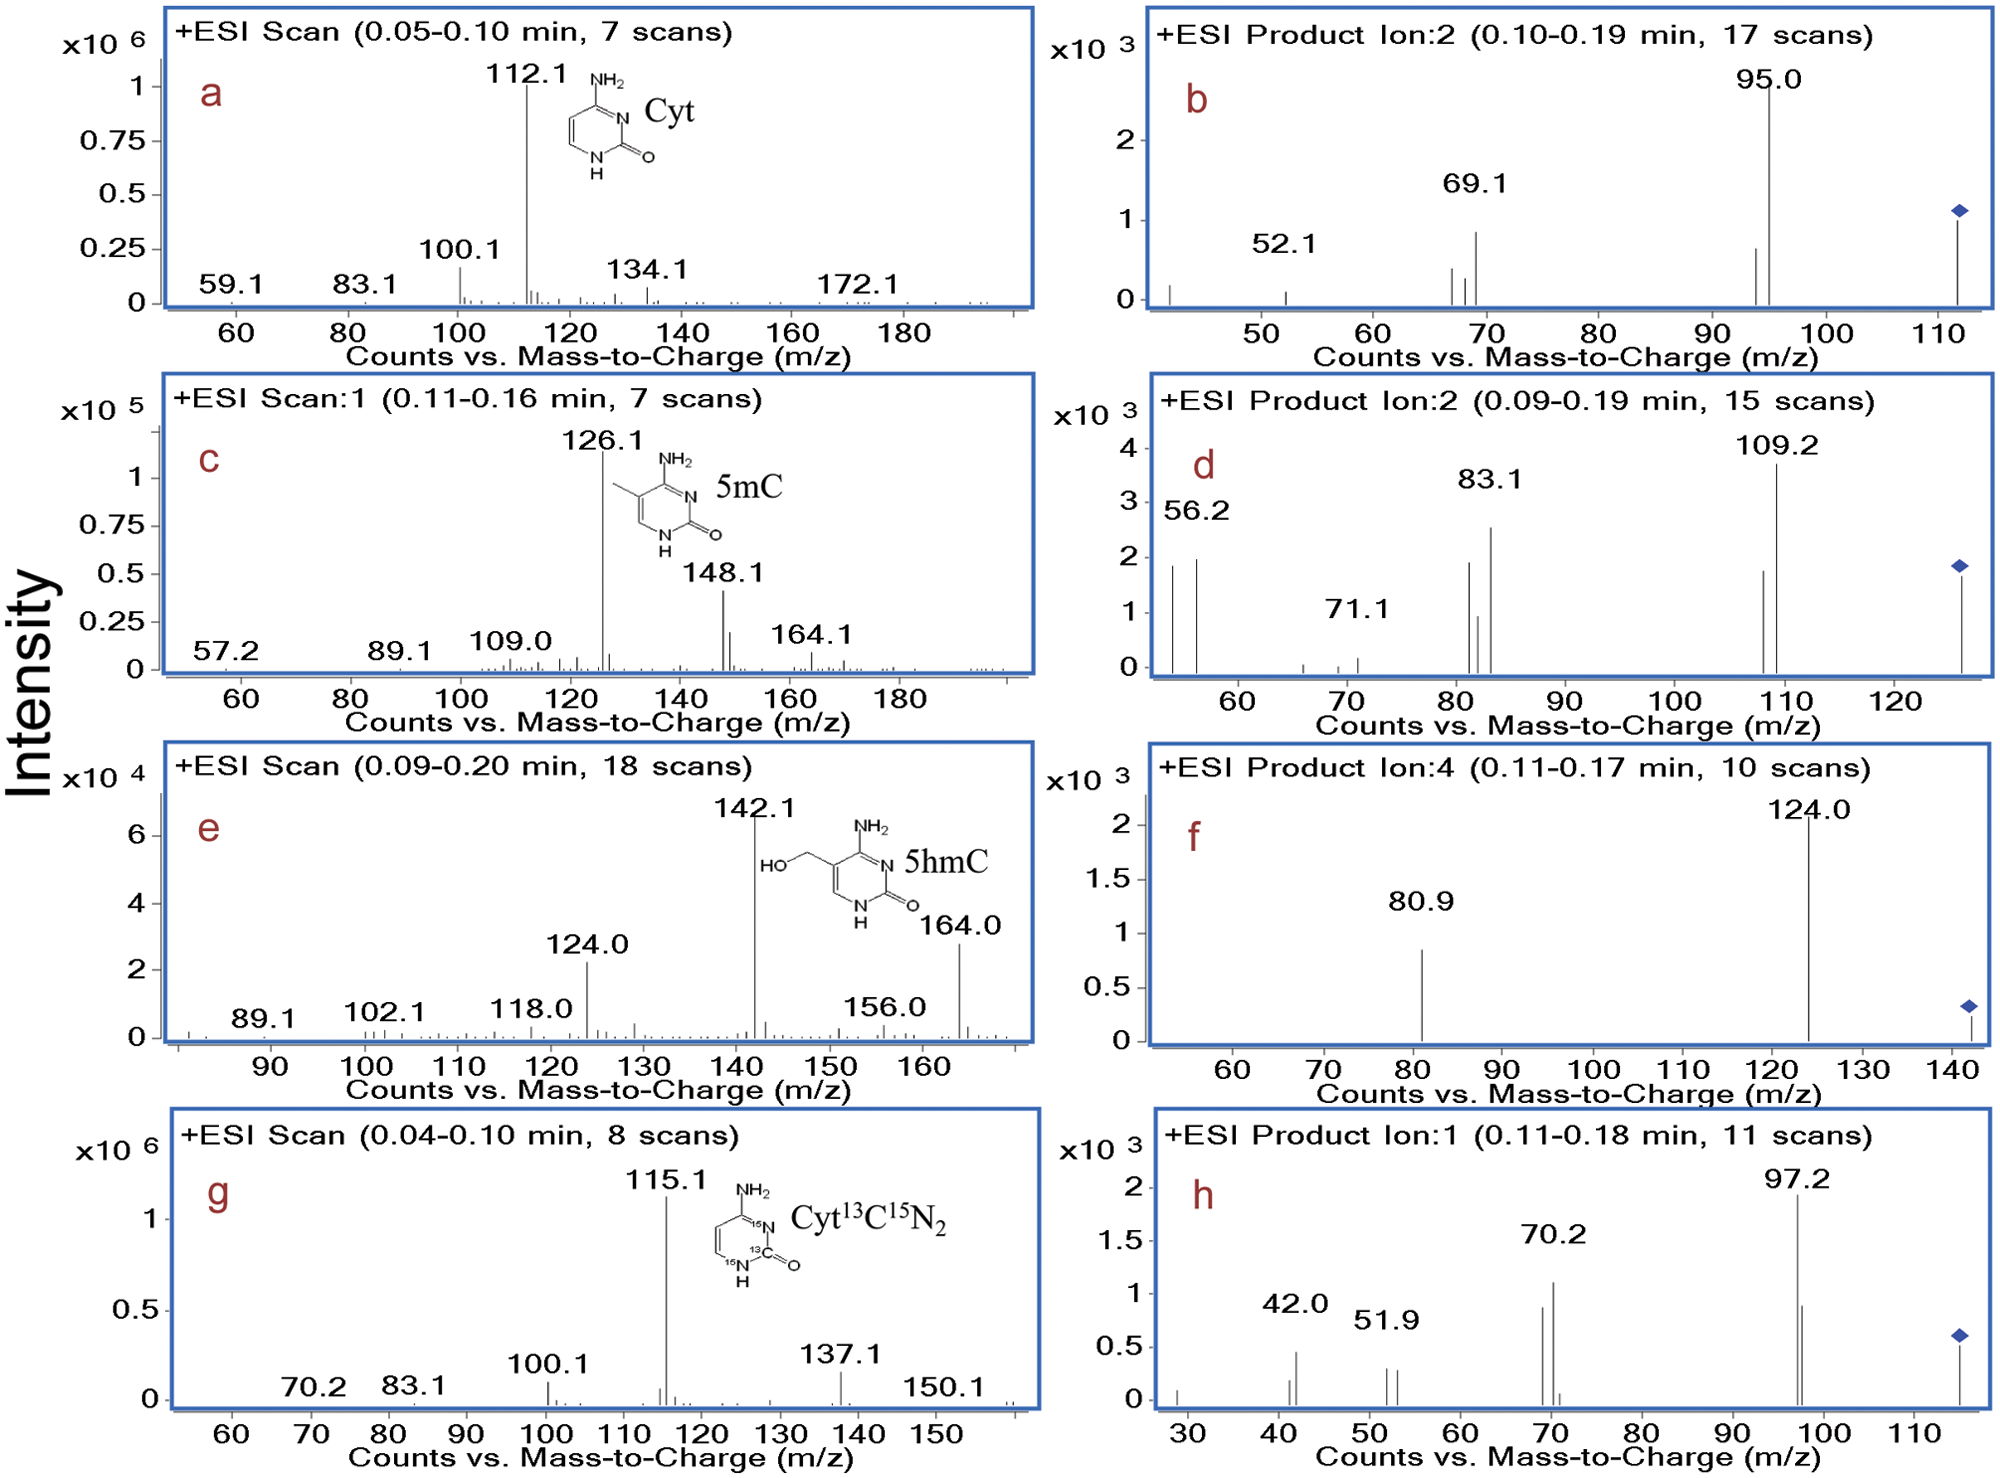
Full-scan and product ion scan of Cyt (
Similarly, as shown in Figure 1c , e , g , the protonated molecular ions [M + H]+ of 5mC, 5hmC, and Cyt13C15N2 were m/z 126.1, m/z 142.1, and m/z 115.1, respectively. Quantification was accomplished in MRM mode by monitoring a transition pair of m/z 126.1/109.1 for 5mC, m/z 142.1/124.0 for 5hmC, and m/z 115.1/97.1 for Cyt13C15N2. As can be seen in Figure 1d , f , h , qualitative mass chromatograms were acquired in MRM mode by monitoring three transition pairs of m/z 126.1/83.1, 142.1/80.9, and 115.1/70.2 for 5mC, 5hmC, and Cyt13C15N2, respectively.
As shown in Figure 1 , the intensities of the fragments were all in the 10e3 range, whereas the precursors varied from 10e4 to 10e6. This finding can be explained as follows: (1) In the full scan, the lower intensities of 5mC and 5hmC might be due to a high signal of a sodium adduct, and (2) a great amount of m/z 124.0 was shown in the full scan of 5hmC, so the intensity of m/z 124.0 would be much higher in the product ion scan, which might explain why the intensity of 5hmC at 10e4 in the full scan can generate fragments in the 10e3 range.
Liquid Chromatographic Characterization of Cytosine, 5-Methylcytosine, and 5-Hydroxymethylcytosine
We set up the HILIC-MS/MS based on the method previously developed in our laboratory for the determination of Cyt and 5mC. 24 The concentration of ammonium formate in the aqueous content of the mobile phase varied from 2.5 to 15 mM, whereas the water content of the mobile phase was kept constant at the value of 5%. Figure 2 exhibits the effect of the concentration of ammonium formate on the peak area of the analytes. As shown in the figure, a decrease in peak area is observed upon increasing the concentration of the ammonium formate, an effect that is probably due to ion suppression. Moreover, the peak shape of the selected analytes was significantly improved by adding ammonium formate to the mobile phase (data not shown). For this reason, an ammonium formate concentration of 2.5 mM in Milli-Q water was chosen as optimal for performing the HILIC-MS/MS analysis.
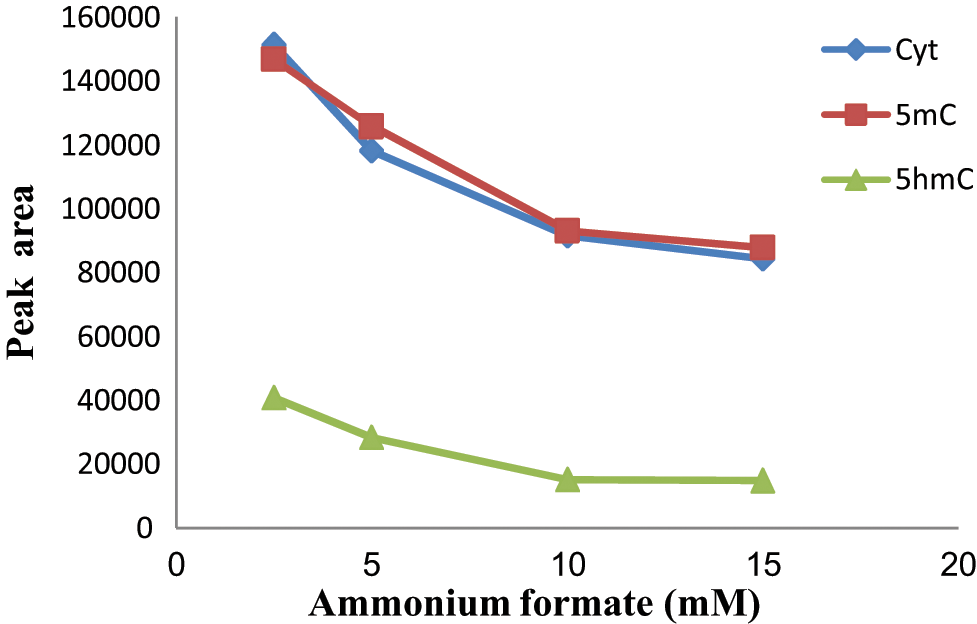
The effect of ammonium formate concentration on the peak area of the analytes Cyt, 5mC, and 5hmC. An eluent consisting of acetonitrile and water was adjusted to form the different ammonium formate concentrations. Cyt, cytosine; 5mC, 5-methylcytosine; 5hmC, 5-hydroxymethylcytosine.
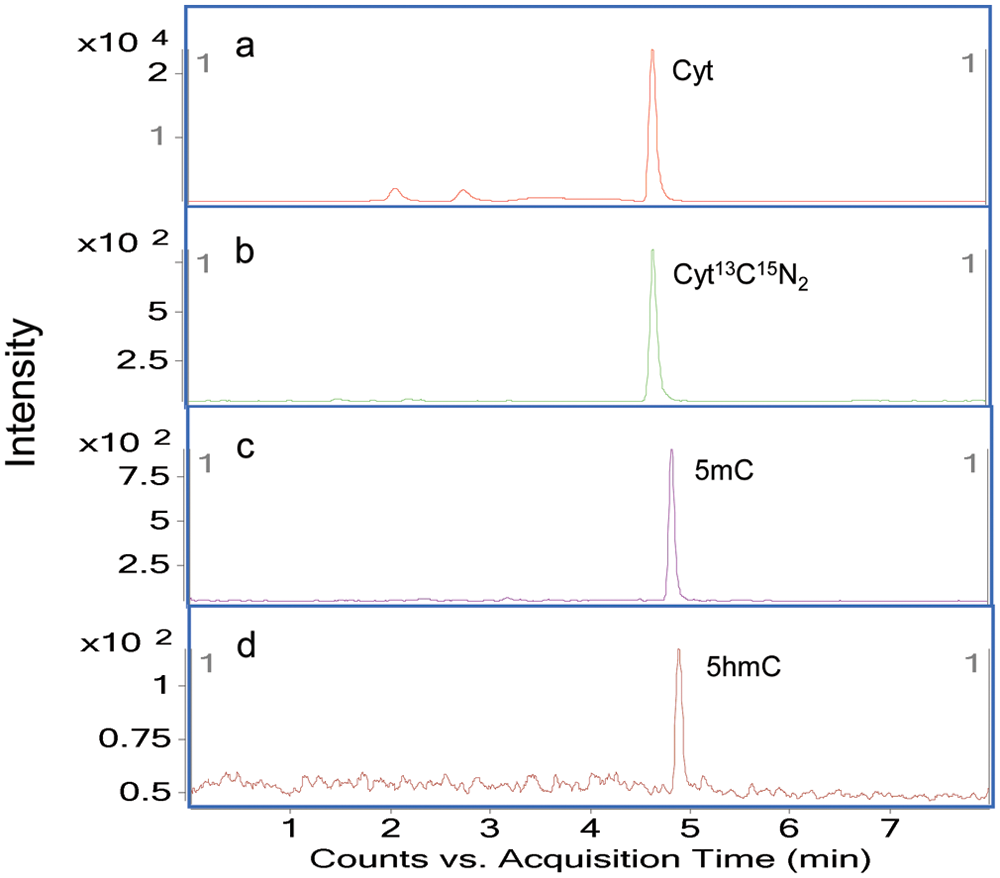
To optimize the gradient, acetonitrile and 2.5 mM ammonium formate as a modifier were used to separate Cyt, 5mC, and 5hmC. Through the use of HILIC with sub-micron particle size packing, all compounds were eluted within 5 min. As shown in Figure 3 , the exact retention times of Cyt, Cyt13C15N2, 5mC, and 5hmC were 4.58, 4.58, 4.77, and 4.88 min, respectively. These close retention times of the analytes were not a problem because of the use of specific MRM transitions for each compound. The advantages of using a gradient in this method are as follows: (1) The analytes possessed a narrow peak, reproducible retention times, and enough sensitivity; (2) contaminants on the column after injection can be removed effectively by an additional washing step of the gradient elution; and (3) all nucleobases were eluted within 5 min. On the basis of these chromatographic results, 2.5 mM ammonium formate and acetonitrile by gradient elution at 0.3 mL/min was chosen as the mobile phase.
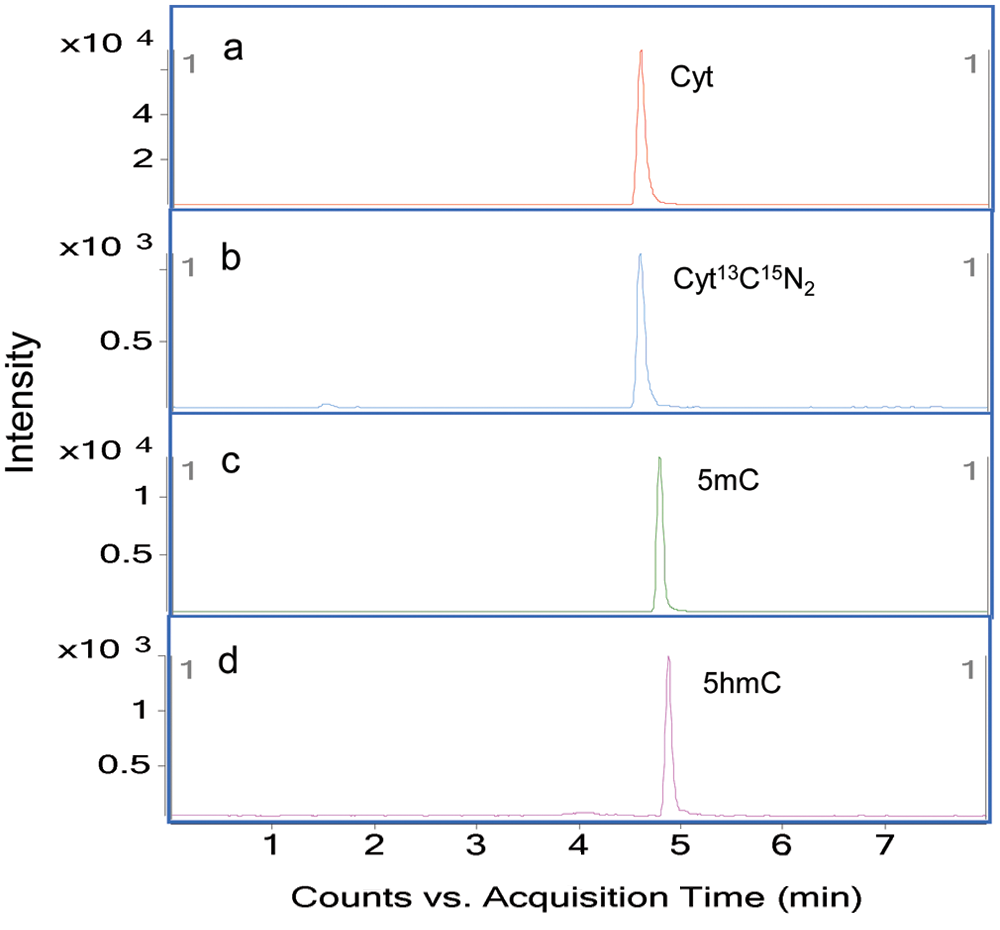
Chromatograms of the quantifier transition of Cyt (
Calibration Curve
Calibration was performed with the final optimized elution and MS parameters, and the assay was found to have good linearity in the tested range for all analytes. The coefficient of determination was typically higher than 0.99. The experimental results for the calibration curve are shown in Table 1 . Good performance was found for Cyt, 5mC, and 5hmC due to the use of an internal standard. Calibration curves were used for quantitation purposes.
Calibration Range, Correlation Coefficient R2, and Regression Equations of Cyt, 5mC, and 5hmC
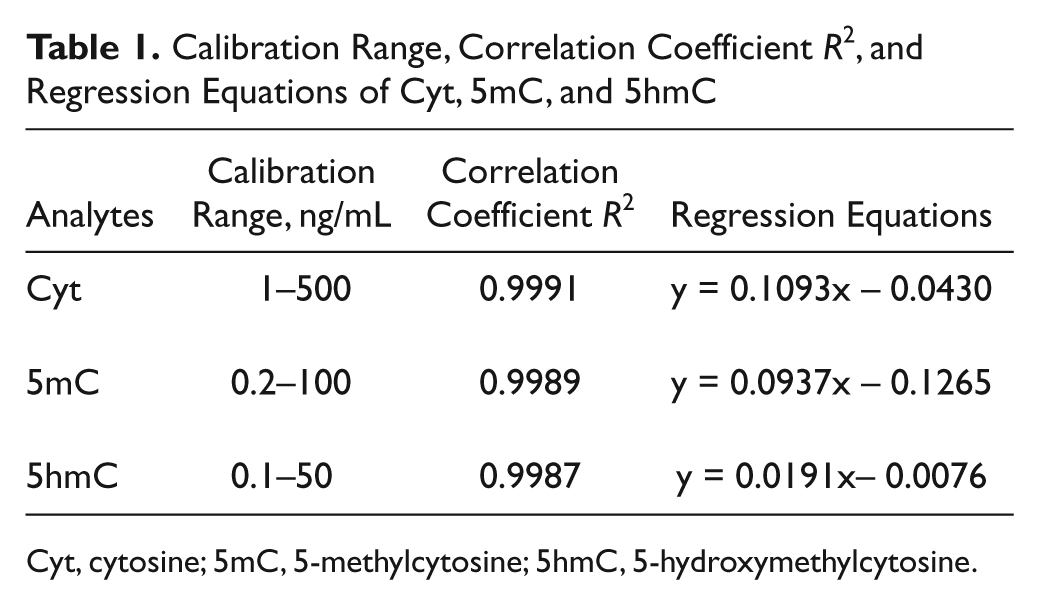
Cyt, cytosine; 5mC, 5-methylcytosine; 5hmC, 5-hydroxymethylcytosine.
Precision, Accuracy, Recovery, and Sensitivity
The RSD of the intraday precision ranged from 1.87% to 4.84% and the interday precision from 2.69% to 4.98%. Accuracy was in the range of 88.25% to 104.39%.
The recoveries of the known spiked amounts of the Cyt ranged from 91.20% to 104.14%, whereas the recoveries ranged from 92.41% to 104.39% for 5mC and from 88.25% to 98.94% for 5hmC.
This method was applied to determine nucleobases in biological samples reaching LOD 1 pg/mL for Cyt, 45 pg/mL for 5mC, and 57 pg/mL for 5hmC, and the LOQ values for Cyt, 5mC, and 5hmC were 2 pg/mL, 90 pg/mL, and 100 pg/mL, respectively. This LOD can be equated to approximately 50 ng of digested genomic DNA to measure 5hmC at the 0.1% level. The sensitivity obtained should enable the use of this method in applications in which DNA samples are limited, as is often the case for clinical samples or for cells collected by laser capture microdissection.
Application to Real Samples
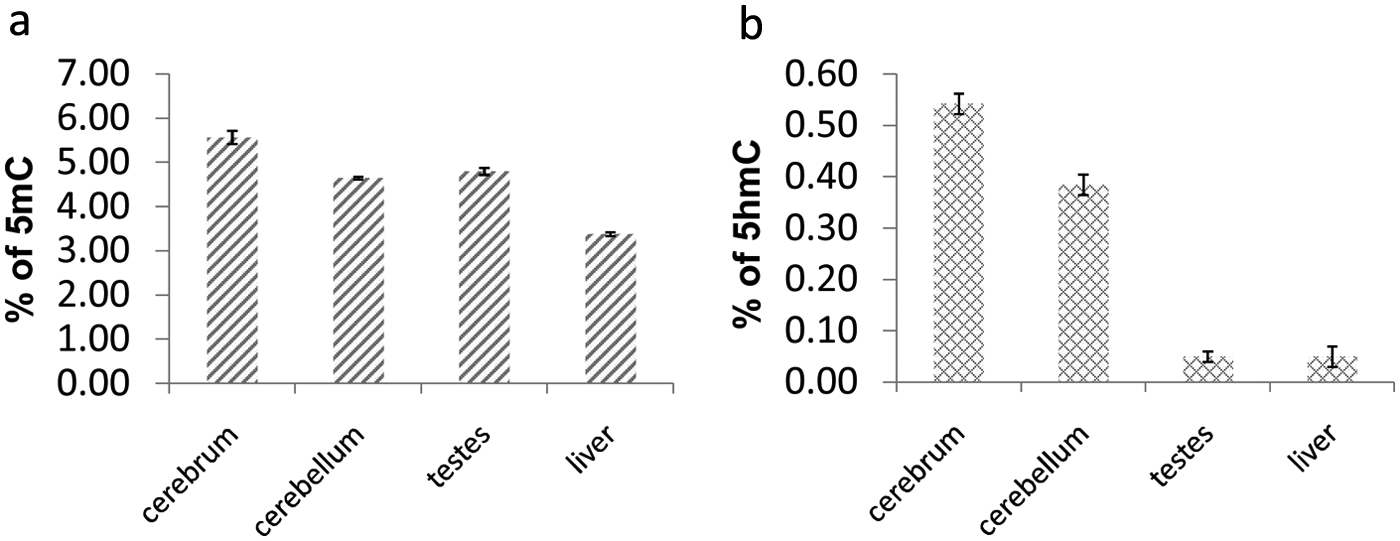
The elimination of RNA from samples is important, so in our method, we measured the Ura in the sample to estimate the RNA residue in the sample. Figure 4 shows the MRM chromatogram of 1 pg Ura standard and a real sample. As can be seen in Figure 4 , Ura was removed from the sample completely, confirming that there is no more than a trace amount of RNA residue in our samples. We also investigated the potential interference of Thy (m/z 126.9) to the signal of 5mC (m/z 126.1). As shown in Figure 5A , B , the elution time of Thy is different from that of 5mC, showing that Thy would not confound the signal of 5mC. To demonstrate the applicability of the method, 12 samples including cerebrum, cerebellum, testis, and liver from SD rats were analyzed according to the above described and validated method. Figure 6 shows the MRM chromatograms of a cerebrum sample as an example. Characteristic results from the analysis of all the tissue samples are shown in Figure 7 . The degree of DNA hydroxymethylation in cerebrum or cerebellum tissue was 0.54% ± 0.01% or 0.38% ± 0.01%, respectively, consistent with other authors’ reported data. 8 5hmC is a constituent of nuclear DNA that is highly abundant in brain regions, suggesting that it plays an important role in the epigenetic control of neuronal function.
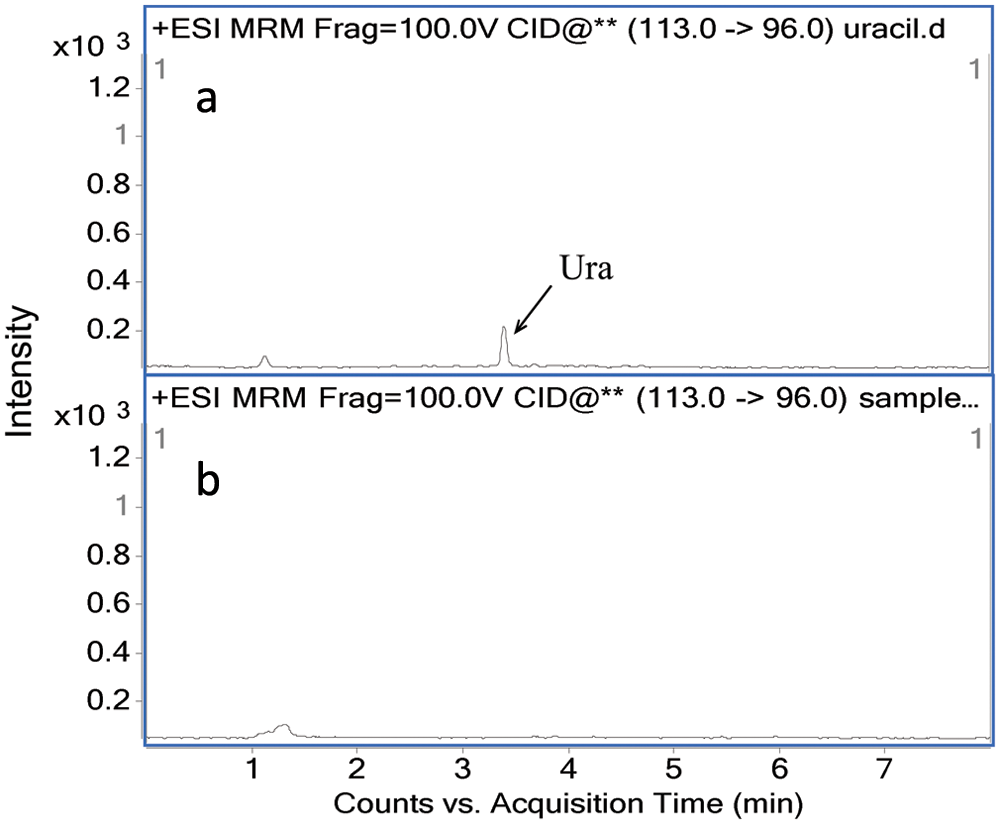
Multiple-reaction monitoring (MRM) chromatogram of 1 pg uracil (Ura) standard (
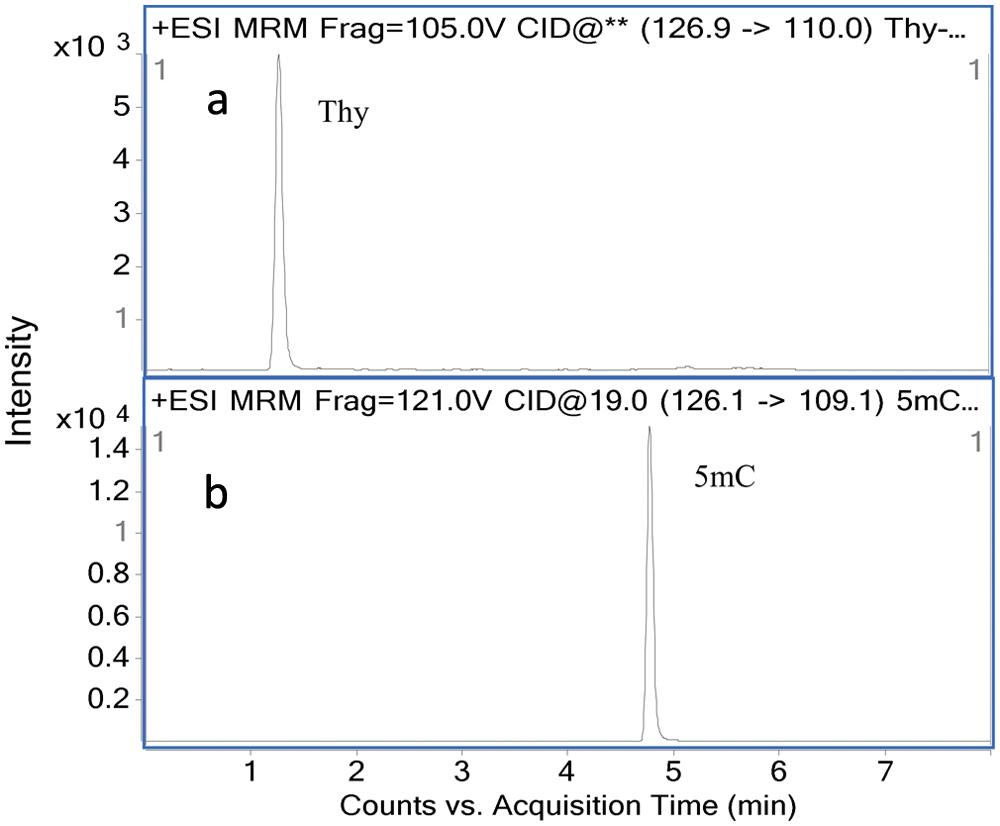
Multiple-reaction monitoring (MRM) chromatograms of Thy (
Chromatograms of quantifier multiple-reaction monitoring (MRM) transitions of Cyt (
Percentages of 5mC (
In summary, an HILIC-MS/MS method for the simultaneous determination of 5hmC and 5mC levels in biological samples has been developed and fully validated. The total assay time, including hydrolysis and LC-MS/MS analysis, is relatively short, requiring less than 2 h, and the method was easily incorporated into the routine of our laboratory. The applicability of the method has been demonstrated by analyzing several tissue samples from SD rats. HILIC was proven to be a suitable option for the determination of Cyt, 5mC, and 5hmC, and the results suggest that the method is a viable detection technique for the measurement of nucleobases at a low concentration (picograms per microgram) of DNA in cerebrum, cerebellum, testis, and liver. Considering the sensitivity, accuracy, and rapidity of our HILIC-MS/MS assay, this assay has widespread applicability and is suitable for expansion to other rare nucleobases.
Footnotes
Acknowledgements
The authors thank Jason Kang and Sarah Brigandi for their assistance with editing the manuscript.
Declaration of Conflicting Interests
The authors declared no potential conflicts of interest with respect to the research, authorship, and/or publication of this article.
Funding
The authors disclosed receipt of the following financial support for the research, authorship, and/or publication of this article: This work was supported by grants from Guangdong Medical College; and the National Natural Science Foundation of China (30672741).
References
Supplementary Material
Please find the following supplemental material available below.
For Open Access articles published under a Creative Commons License, all supplemental material carries the same license as the article it is associated with.
For non-Open Access articles published, all supplemental material carries a non-exclusive license, and permission requests for re-use of supplemental material or any part of supplemental material shall be sent directly to the copyright owner as specified in the copyright notice associated with the article.