
Abstract
The zebrafish model has been increasingly explored as an alternative model for toxicity screening of pharmaceutical drugs. However, little is understood about the bioactivation of drug to reactive metabolite and phase I and II metabolism of chemical in zebrafish as compared with human. The primary aim of our study was to establish the bioactivation potential of zebrafish using acetaminophen as a probe substrate. Our secondary aim was to perform metabolite profiling experiments on testosterone, a CYP3A probe substrate, in zebrafish and compare the metabolite profiles with that of human. The glutathione trapping assay of N-acetyl-p-benzoquinone imine demonstrated that zebrafish generates the same reactive metabolite as humans from the bioactivation of acetaminophen. Zebrafish possesses functional CYP3A4/5-like and UDP-glucuronosyltransferase metabolic activities on testosterone. Differential testosterone metabolism was observed among the two species. In silico docking studies suggested that the zebrafish CYP3A65 was responsible for the bioactivation of acetaminophen and phase I hydroxylation of testosterone. Our findings reinforce the need to further characterize the drug metabolism phenotype of zebrafish before the model can fully achieve its potential as an alternative toxicity screening model in drug research.
Keywords
Introduction
The utility of animal models for toxicity screening of candidate compounds is based on the assumption that the toxicological outcomes are predictive of human toxicities. However, the accuracy of this broad assumption depends on the nature and mechanism of toxicity, disposition (distribution, metabolism, and excretion) profile of each compound within the biological system, and experimental design such as dose and duration of dosing. Nonconcordance with any of these assumptions may lead to poor prediction of human toxicities. Taking drug-induced liver injury as an example, reactive metabolites derived from the metabolism of drugs have been implicated as the hepatotoxicant. 1 An example of a hepatotoxicity-associated reactive metabolite is N-acetyl-p-benzoquinone imine (NAPQI), derived from phase I metabolism of acetaminophen (APAP). 2 Failure of an animal model to generate reactive metabolites has far-reaching repercussions in terms of the poor prediction of human toxicities.
Zebrafish (Danio rerio) larva has been explored in recent years as an alternative in vivo toxicity screening model for cardiotoxicity, neurotoxicity, teratogenesis, genotoxicity, and gut and ocular toxicity in the early drug discovery process.3,4 The popularity of zebrafish larva stems from it being a small vertebrate that is amenable to high-throughput screening (HTS), its transparency enabling visual inspection of organ-specific toxicological effects, and ease of maintenance and handling as compared with mammalian animals. As only small amounts of compounds are required for testing, the constraint of candidate compound in early drug discovery is further relieved. The use of zebrafish is also in line with the 3R (reduce, refine, and replace) approach of animal use for scientific purposes.
Although zebrafish has been experimented as a toxicology model, there is no information regarding the generation of reactive metabolites by zebrafish. In addition, the function of CYP enzymes in the metabolism of pharmaceuticals by zebrafish has not been explored until recently. 5 Phase II enzymes, such as uridine glucuronosyltransferases (UGTs), have been characterized at the gene expression level 6 and functional enzyme activity demonstrated with a few substrates for sulfotransferases (SULT) activity. 7 In these studies, no comparison was drawn between the metabolism of drug compounds in zebrafish versus human.
Two research questions arose based on the current literature review. First, does zebrafish generate reactive metabolites in a similar fashion to human? Two, what is the degree of concordance in terms of xenobiotic metabolism between zebrafish and human? As APAP undergoes bioactivation in human and generates its toxic reactive metabolite, NAPQI, our primary aim was to establish the bioactivation potential of zebrafish using APAP as a probe substrate. As CYP3A enzymes are responsible for the metabolism of marketed drugs, our secondary aim was to perform metabolite profiling experiments on testosterone in zebrafish and compare its metabolite profiles in human. Testosterone was selected as a probe substrate of CYP3A enzymes. To address these questions, we adopted zebrafish liver microsomes (ZLM) as the primary testing system to ascertain the specific role of metabolism and eliminate confounding pharmacokinetic factors related to an in vivo model. Nonetheless, metabolism of testosterone was also investigated using zebrafish larvae as it is the model adopted for high-throughput toxicity screening of candidate compounds. In this study, wild-type zebrafish was adopted to represent a heterogeneous and robust population of the model as it is commonly used for toxicological studies. 8 In silico substrate-CYP docking was further performed to complement the findings gleaned from the functional enzymatic assays. The findings of our study would help gain a clearer understanding of the concordance of zebrafish to human drug metabolism.
Materials and Methods
Chemicals and Reagents
Testosterone and formic acid were purchased from Merck (Darmstadt, Germany). 6β-hydroxytestosterone was purchased from Cerilliant Corporation (Round Rock, TX). 2α-, 7α-, 15β-, 16α-, and 16β-hydroxytestosterone were purchased from Steraloids, Inc. (Newport, RI). Potassium phosphate monobasic (ACS grade) was purchased from Mallinckrodt Baker (Phillipsburg, NJ). APAP, procainamide, potassium phosphate dibasic (ACS grade), and reduced glutathione (GSH) were purchased from Sigma-Aldrich (St. Louis, MO). The nicotinamide adenine dinucleotide phosphate (NADPH) regenerating system was purchased from BD Gentest (Woburn, MA). Pooled human liver microsomes (HLM) from 20 donors, with a protein concentration of 20 mg/mL and total CYP of 300 pmol/mg, was obtained commercially from BD Biosciences (San Jose, CA). High-performance liquid chromatography (HPLC)–grade acetonitrile (ACN) and HPLC-grade methanol were purchased from Fisher Scientific (Leicestershire, UK) and Tedia Company, Inc. (Fairfield, OH), respectively. Water was purified using a Milli-Q water purification system (Millipore, Bedford, MA).
Animal Husbandry
Adult wild-type zebrafishes were purchased from Mainland Fish Farm, Singapore, and acclimatized for a period of 2 to 5 days at the central aquarium in the Department of Biological Sciences, National University of Singapore (NUS), prior to liver dissection. Wild-type zebrafish larvae were collected from natural spawning at the same aquarium and reared in embryo media (E3M media) (5 mM NaCl, 0.17 mM KCl, 0.33 mM CaCl2.2H2O, 0.33 mM MgSO4.7H2O, 0.001 g/L methylene blue with pH adjusted to 7.2) in an incubator at 28.5 ± 0.5 °C. Dead larvae were removed and E3M media changed daily until experimentation. All experiments were conducted in compliance with the guidelines of the Institutional Animal Care and Use Committee of NUS.
Preparation of Zebrafish Liver Microsomes
All procedures were conducted on ice using ice-cold buffers. Three buffers—namely, the homogenizing buffer (0.1 M Tris-Cl [pH 7.4], 10 mM ethylenediaminetetra-acetic acid [EDTA], 150 mM potassium chloride), pyrophosphate buffer (0.1 M sodium pyrophosphate [pH 7.4], 10 mM EDTA), and microsomal buffer (0.05 M Tris-Cl [pH 7.5], 10 mM EDTA, 20% glycerol)—were prepared. Standardized female ZLM were pooled from 24 female zebrafish where each female zebrafish liver was carefully isolated on ice without bile contamination, rinsed with 60 µL homogenizing buffer, and dabbed dry with lint-free Kimwipes (Kimberly-Clark Professional, Canada). Careful isolation and rinsing of bile-free livers were included based on our initial investigation and findings on the effect of bile and hemoglobin contamination on the quality of ZLM. ZLM isolation was then performed as described by Hill. 9 For the isolation of ZLM, 1.5 mL pyrophosphate buffer and 0.4 mL microsomal buffer were used to resuspend the pellet in the intermediate and final ultracentrifugation steps, respectively.
Protein and CYP Quantification
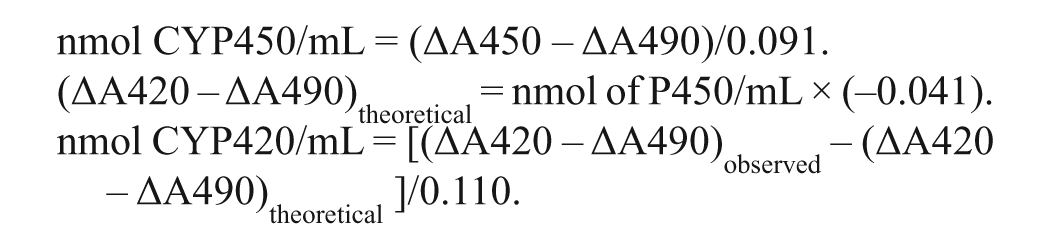
Protein concentration of the ZLM was determined by the Bradford assay method using the Bio-Rad protein assay kit (Bio-Rad Laboratories, Hercules, CA) with bovine serum albumin as standard. The ZLM were then subjected to CYP concentration determination at a standardized protein concentration of 0.194 mg/mL using the carbon monoxide (CO) differential scanning method. The following equations as described by Guengerich et al. 10 were used to determine the CYP450 and CYP420 concentrations.
Investigation of APAP Bioactivation by Zebrafish Using Liver Microsomes
GSH adduct trapping assays of NAPQI were performed individually with ZLM and HLM. Each reaction mixture, with a final volume of 250 µL, consisted of 100 mM potassium phosphate buffer (pH 7.4), NADPH regenerating system (consisting of 1.3 mM NADP+, 3.3 mM glucose-6-phosphate, 3.3 mM magnesium chloride, and 0.4 U/mL glucose-6-phosphate dehydrogenase), 5 mM GSH, and liver microsomes with a CYP concentration of 15 pmol/mL. The ZLM reaction mixture was preincubated for 6 to 8 min at an optimal 28.5 °C, whereas HLM reaction mixtures were preincubated at 37 °C. The reaction was initiated by adding 25 µL of 10 mM APAP dissolved in water to give a final APAP concentration of 1 mM. The reaction mixtures were incubated at 28.5 °C for ZLM and 37 °C for HLM. At 2 h, 250 µL ice-cold 0.5 µM procainamide (internal standard [IS]) in ACN was added to the reaction mixture to quench the reaction. The mixtures were then centrifuged at 15 000 g for 15 min at 4 °C. Aliquots of supernatants were evaporated to dryness at 37 °C for 2 h under a gentle flow of nitrogen gas using the Turbovap LV (Caliper Life Science, Hopkinton, MA). Each sample was reconstituted with 20 µL 0.1% formic acid in water and 2 µL and 3 µL injected for ultra-HPLC/tandem mass spectrometry (UHPLC/MS/MS) and ultra-performance liquid chromatography, quadrupole, orthogonal acceleration time-of-flight tandem mass spectrometry (UPLC/QTOF/MS/MS) analyses, respectively. Three control incubations were performed without GSH, NADPH, or APAP for each test group. All experiments were performed in replicates.
Investigation of Metabolism of Testosterone by Zebrafish Using Liver Microsomes
Testosterone metabolism assays were performed separately using ZLM and HLM. The reaction conditions were similar to the GSH adduct trapping assay except that CYP concentration was 20 pmol/mL and no GSH was added. After preincubation, the reaction was initiated by adding 1 µL of 25 mM testosterone dissolved in 100% methanol to give a final testosterone concentration of 100 µM and final organic concentration of 0.4%. At time points 0, 1, and 2 h, 70 µL of the incubation mixture was transferred to 70 µL ice-cold 0.5 µM prednisolone (internal standard [IS]) in ACN. Upon centrifugation and drying, each sample was reconstituted with 20% ACN in water and vortex mixed, and 2 µL of the supernatant was injected for UHPLC/MS/MS and UPLC/QTOF/MS/MS analyses. Control incubations were performed without liver microsomes for all experiments. All experiments were performed in replicates.
Investigation of Metabolism of Testosterone by Zebrafish Larvae
In addition to ZLM, zebrafish larvae at 5 days postfertilization (dpf) were exposed to testosterone for 3 h at 28.5 °C. Stock testosterone was dissolved in methanol and diluted in E3M media to give a final working solution of 10 µM testosterone and final organic concentration of 0.1%. Experiments were carried out in triplicate in a 12-well plate where each well (experimental replicate) contained 20 zebrafish larvae immersed in 1 mL E3M media (control) or 10 µM testosterone in E3M media. At 3 h, 750 µL media was withdrawn for subsequent analysis while zebrafish larvae were anaesthetized with ice-cold media. The larvae were then rinsed twice with ice-cold phosphate-buffered saline (PBS), suspended in 1 mL PBS, and transferred to a microfuge tube and centrifuged at 1000 g for 1 min. The supernatant was removed and larvae macerated with a handheld pellet pestle motor to form a homogenate. The media and larvae homogenate samples were stored at −20 °C until further sample preparation for analysis.
On the day of analysis, 400 µL ice-cold water was added to the thawed larvae homogenate and further homogenized with two pulses of 25 Hz × 10 s with a mixer mill bead homogenizer, MM400 (Retsch, Haan, Germany). Then, 100 µL of 0.5 µM prednisolone in ACN (IS) was added to 100 µL each of the media and diluted larvae homogenate and centrifuged at 18 000 g for 10 min. Next, 180 µL of the supernatant was evaporated to dryness at 37 °C for 1 h under a gentle flow of nitrogen gas and reconstituted with 180 µL of 5% methanol in water. The reconstituted samples were subjected to solid-phase extraction (SPE) using Strata-X C18 polymeric reverse-phase sorbent (Phenomenex, Torrance, CA). SPE conditions were as follows: conditioning with 0.3 mL methanol, equilibration with 0.3 mL water, loading of 150 µL of the sample, washing with 0.3 mL 15% methanol, and elution with 0.3 mL ACN. Then, 280 µL of the eluate was dried under a gentle flow of nitrogen gas for 1 h. Each sample was reconstituted with 20% ACN in water and vortex mixed, and 2 µL of the supernatant was injected for UHPLC/MS/MS and UPLC/QTOF/MS/MS analyses. A stability test of testosterone in E3M incubated at 28.5 °C for 3 h was also carried out.
Instrumentation
UHPLC/MS/MS analyses of NAPQI-GSH adduct and hydroxytestosterone
The experiments were performed using an Agilent 1290 Infinity UHPLC interfaced with an Agilent 6430 QQQ MS (Agilent Technologies, Santa Clara, CA) and controlled by the Agilent MassHunter Workstation Software–LC/MS Data Acquisition for 6400 Series (Agilent Technologies). Chromatographic separations were performed on an ACQUITY UPLC BEH C18 1.7-µm, 50 × 2.1-mm i.d. column (Waters, Milford, MA) for the APAP samples, whereas testosterone samples were separated using an ACQUITY UPLC BEH C18 1.7-µm, 100 × 2.1-mm i.d. column (Waters). The column heater and autosampler were kept at 45 °C and 6 °C, respectively. The mobile phase consisted of solvent A (0.1% formic acid in water) and solvent B (0.1% formic acid in ACN). The flow rates were 0.6 and 0.45 mL/min for APAP and testosterone experiments, respectively.
The optimized elution conditions were as follows: (a) APAP experiments: gradient of 0.1%−60.0% solvent B (0−1.40 min), gradient of 60.0%−95.0% solvent B (1.40−1.41 min), isocratic at 95% solvent B (1.41−1.90 min), gradient of 95.0%−0.1% solvent B (1.90−1.95 min), and isocratic at 0.1% solvent B (1.95−2.50 min) and (b) testosterone experiments: gradient of 30.0%−90.0% solvent B (0−6.25 min), gradient of 90.0%−95.0% solvent B (6.25−6.30 min), isocratic at 95.0% solvent B (6.30−7.05 min), gradient of 95.0%−30.0% solvent B (7.05−7.10 min), and isocratic at 30.0% solvent B (7.10−8.00 min).
Multiple-reaction monitoring (MRM) experiments and electrospray positive ionization mode (ESI +ve) were used for all analyses. The MS conditions for all the experiments are summarized in Table 1 .
Optimized Mass Spectrometry Conditions for the Analyses of Acetaminophen and Testosterone Samples
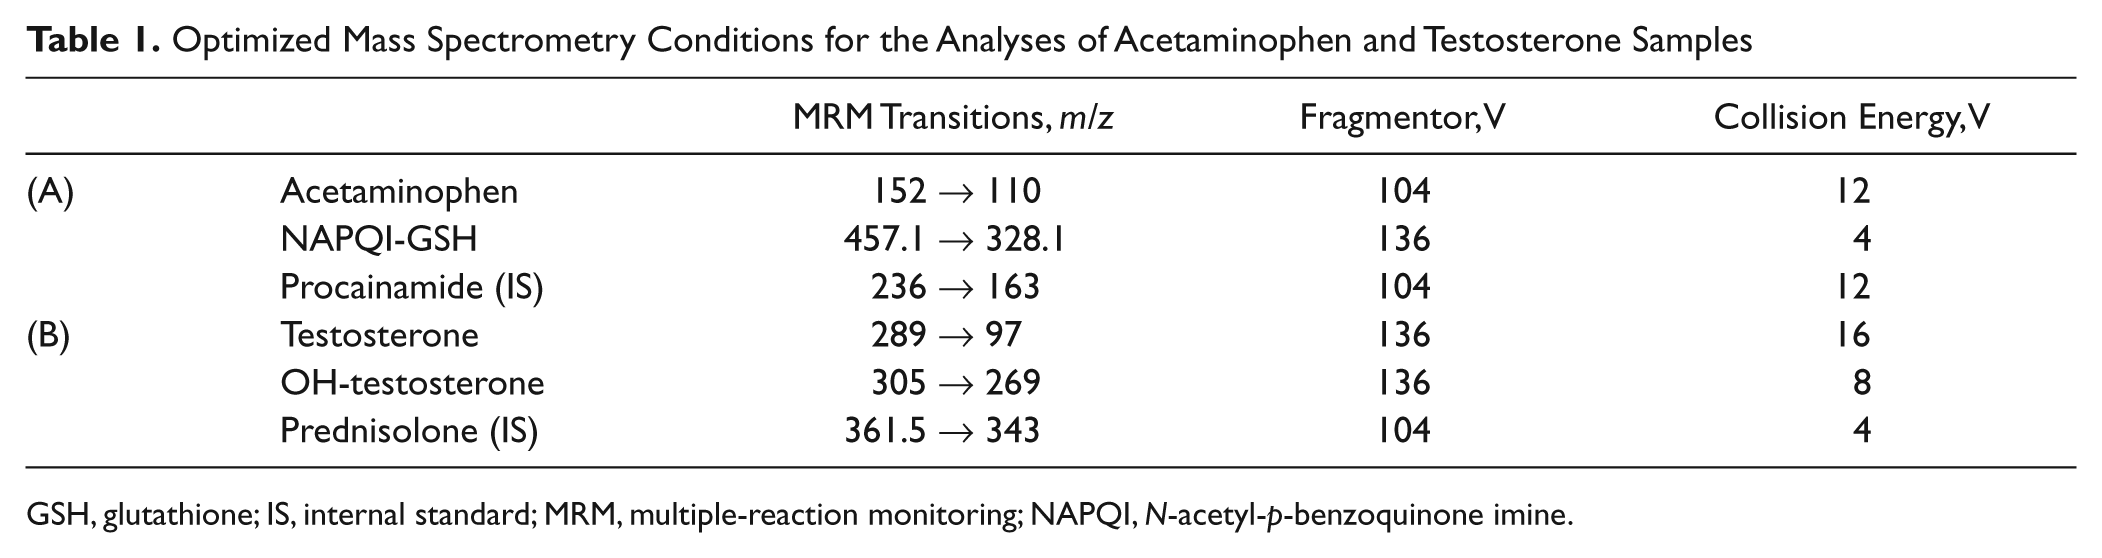
GSH, glutathione; IS, internal standard; MRM, multiple-reaction monitoring; NAPQI, N-acetyl-p-benzoquinone imine.
UPLC/QTOF/MS/MS analyses of NAPQI-GSH adduct, hydroxytestosterone, and testosterone glucuronide
Accurate mass measurements of metabolites were performed using an ACQUITY UPLC system interfaced with a QTOF/MS equipped with an ESI source (Waters). The UPLC/QTOF/MS system was controlled by MassLynx 4.1 software (Waters). Chromatographic separations were performed using the same column and elution conditions described above. The QTOF/MS system was tuned for optimum sensitivity and resolution in ESI +ve mode using leucine enkephalin (200 pg/µL infused at 10 µL/min). Prior to analysis, the system was calibrated in ESI +ve mode using 0.5 M sodium formate solution infused at a flow rate of 5 µL/min. All analyses were acquired using an independent reference spray via the LockSpray interface to ensure high mass accuracy and reproducibility. The [M+H]+ ion of leucine enkephalin (1 ng/µL infused at 15 µL/min) was used as the reference lock mass (m/z 556.2771) for the analyses of testosterone glucuronide and NAPQI-GSH, whereas the [M+H]+ ion of APAP (50 µM infused at 7 µL/min) was used as the reference lock mass (m/z 152.0771) for the analysis of hydroxytestosterone. The LockSpray was operated at a reference scan frequency and collision energy of 10 s and 5 V, respectively. The reference cone voltage was set at 25 and 40 V for APAP and leucine enkephalin, respectively. The QTOF/MS/MS analyses were operated in “V” mode, and the optimized MS conditions for the analyses of NAPQI-GSH adduct, hydroxytestosterone, and testosterone glucuronide are summarized in Table 2 . Centroid data were acquired for all samples.
Optimized Mass Spectrometry Conditions for the Accurate Mass Measurement of Hydroxytestosterone, Testosterone Glucuronide, and NAPQI-GSH Using the QTOF/MS
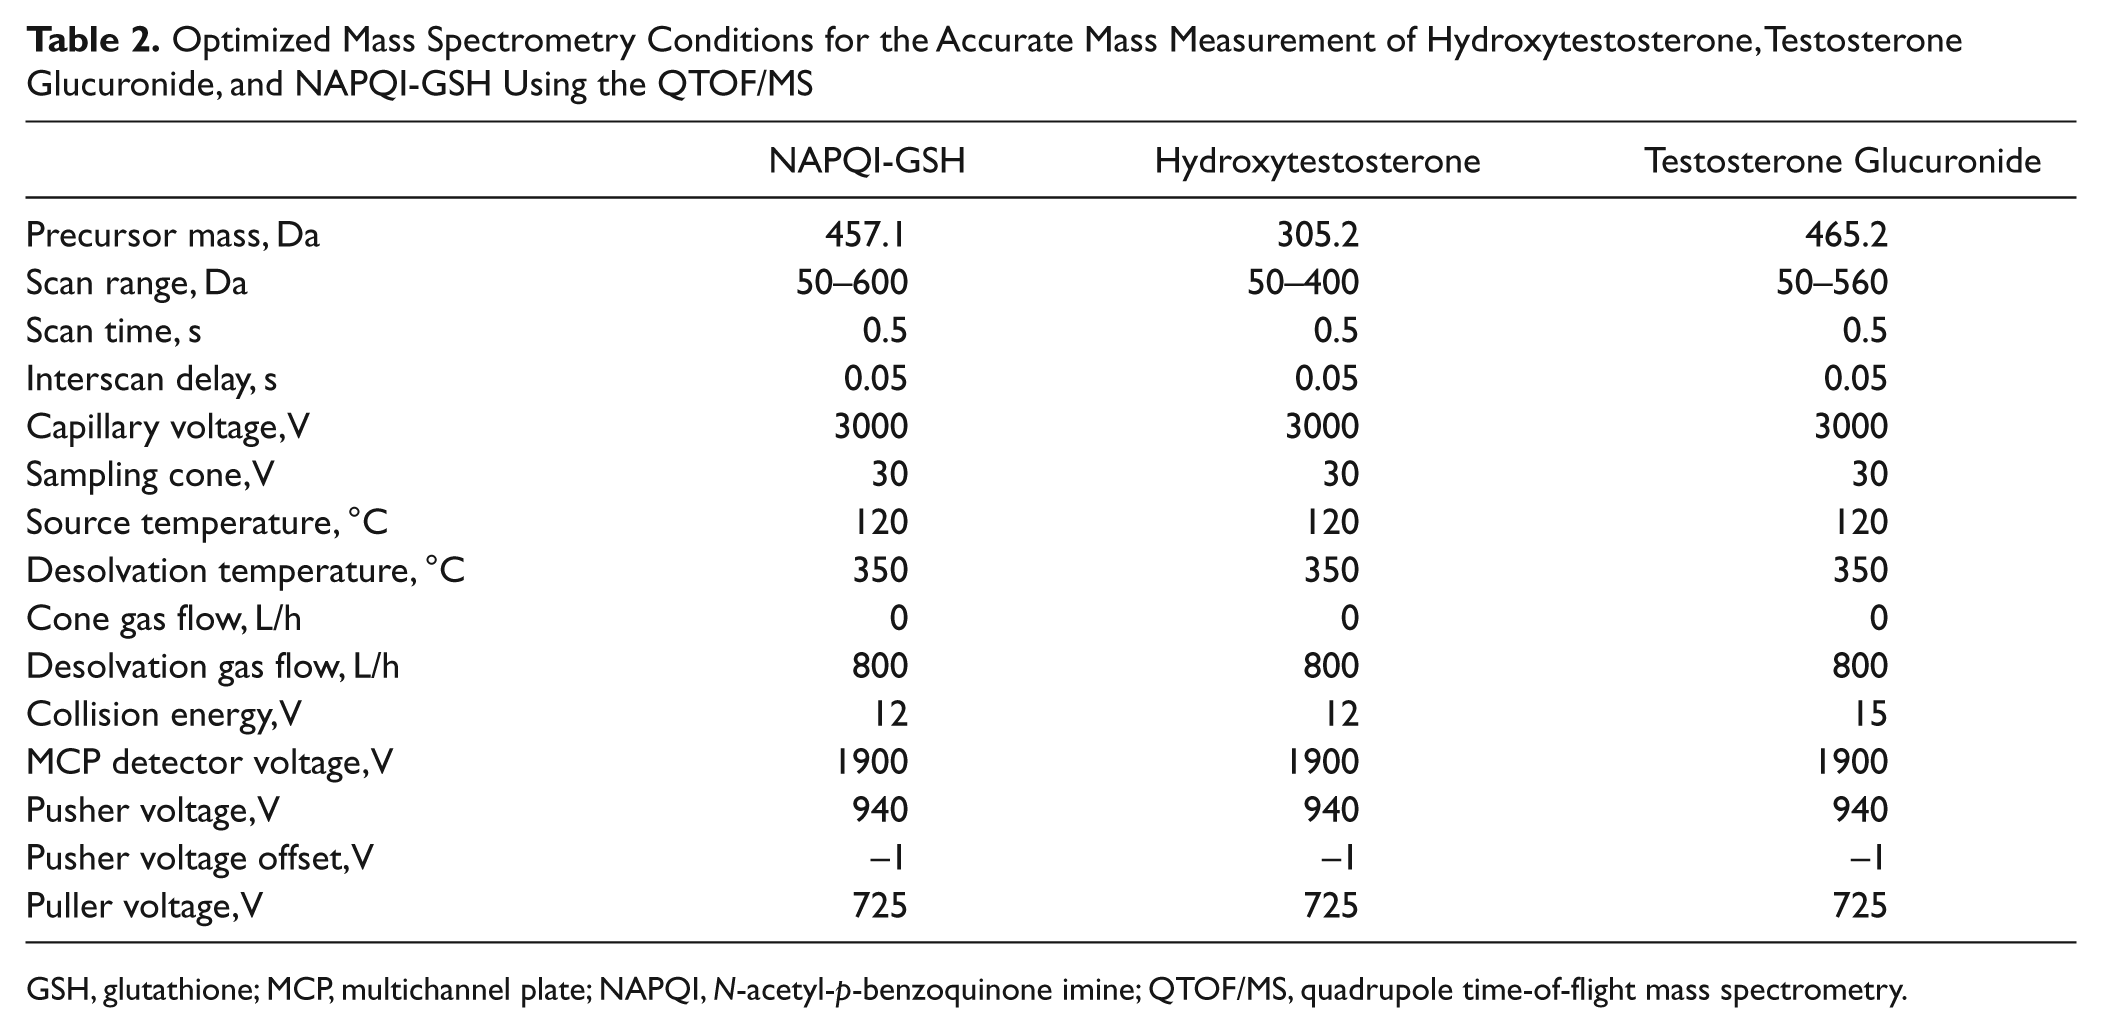
GSH, glutathione; MCP, multichannel plate; NAPQI, N-acetyl-p-benzoquinone imine; QTOF/MS, quadrupole time-of-flight mass spectrometry.
Docking Studies
Docking studies were used to determine the zebrafish cytochrome P450 isozymes that could be responsible for the formation of NAPQI from APAP and metabolism of testosterone. A study on the metabolism of APAP by human cytochrome P450 isozymes had shown that the formation of NAPQI is highest with CYP3A4, with CYP2E1 having intermediate bioactivation capacity and CYP2C9 having the lowest capacity. 11 APAP was docked into the binding site of human CYP3A4 (PDB ID: 3NXU), CYP2E1 (PDB ID: 3E6I), and CYP2C9 (PDB ID: 1R9O), using the Molecular Operating Environment (MOE) software. The expected pose of APAP in the binding site should have the amide group directed toward the heme group in CYP isozymes, where NAPQI is formed via N-hydroxylation. In addition, the expected pose is likely to have hydrogen bonding interactions involving the phenol group and van der Waals interactions involving the aromatic ring. We hypothesize that differences in the expected pose of APAP in each isozyme may help explain the difference in bioactivation capacities. Since CYP3A4 has the highest bioactivation capacity, the expected pose of APAP in the binding site of CYP3A4 was taken as the reference pose. Docking APAP to various zebrafish CYP isozymes and comparing the expected poses with the reference pose will help elucidate the isozymes that are responsible for the formation of NAPQI in zebrafish.
Studies have shown that human CYP3A4 and CYP2B6 mediate the 6β-hydroxylation and 16β-hydroxylation of testosterone, respectively.12,13 Testosterone was docked into the binding site of human CYP3A4 (PDB ID: 3NXU), CYP2B6 (PDB ID: 3IBD), and CYP1A2 (PDB ID: 2HI4) using the MOE 2010.10 software. The poses of testosterone in the binding sites of CYP3A4 and CYP2B6 are likely to have the ketone and hydroxyl groups directed toward the heme group for 6β- and 16β-hydroxylation, respectively. Hence, we hypothesize that it is possible to compare the pose of testosterone in the binding sites of zebrafish isozymes with the pose of testosterone in human CYP3A4 and CYP2B6 to determine the isozymes that may be responsible for the metabolism of testosterone in zebrafish. CYP1A2 is not involved in the metabolism of testosterone and was used as the negative control.
Four zebrafish isozymes—CYP3A65, CYP3C1, CYP1A, and CYP2Y3, which have a syntenic relationship to human CYP3A4, CYP1A2, and CYP2B6
14
—were selected for the docking studies. The reasons for the selection of these isozymes for comparison are summarized in
Homology Modeling of Zebrafish CYPs
There are currently no 3D structures of zebrafish CYP3A65, CYP3C1, CYP1A, and CYP2Y3 available in the RCSB Protein Data Bank (PDB). Hence, homology modeling was carried out to create 3D structures for the four zebrafish isozymes. The FASTA sequences of the four isozymes were obtained from UniProtKB (http://www.uniprot.org). Human CYP3A4 (PDB ID: 3NXU) was used as the template structure for zebrafish CYP3A65 and CYP3C1. Human CYP1A2 (PDB ID: 2HI4) and CYP2B6 (PDB ID: 3IBD) were used as the template structure for zebrafish CYP1A and CYP2Y3, respectively. The software MOE was then used to perform the homology modeling. The Protein Align module in MOE was used to align the zebrafish isozyme sequences with their respective template sequences. The BLOSUM62 matrix with a gap-opening penalty of 7 and gap extension penalty of 1 was used, using the alignment process. The Homology Model module was then used to create the homology models. AMBER99 forcefield with calculation of implicit solvation energy using the Generalized Born model was used for the modeling process. The resultant models were then energy minimized using the LigX module and evaluated using the Ramachandran plot.
Results
Investigation of APAP Bioactivation by Zebrafish Using Liver Microsomes
The NAPQI-GSH adduct was detected in both microsomal samples. The response ratio was calculated as the area ratio of NAPQI-GSH to procainamide (IS) and compared between HLM and ZLM. Our results showed that HLM formed a higher amount of NAPQI-GSH compared with ZLM (eightfold higher). Adducts formed in the controls without NADPH, GSH, and APAP were negligible, confirming that NAPQI was generated from APAP in a metabolically competent system.
In addition, accurate mass measurement of the NAPQI-GSH adduct was performed using UPLC/QTOF/MS/MS to confirm its identity. The fragmentation patterns of NAPQI-GSH observed in HLM and ZLM were similar and typical of the collision-induced dissociation (CID) fragmentation of GSH observed in other studies ( Fig. 1A – C ). The observed mass peaks corresponded to the loss of glycine (m/z 75) and pyroglutamic acid (m/z 129) from the GSH adduct. 11
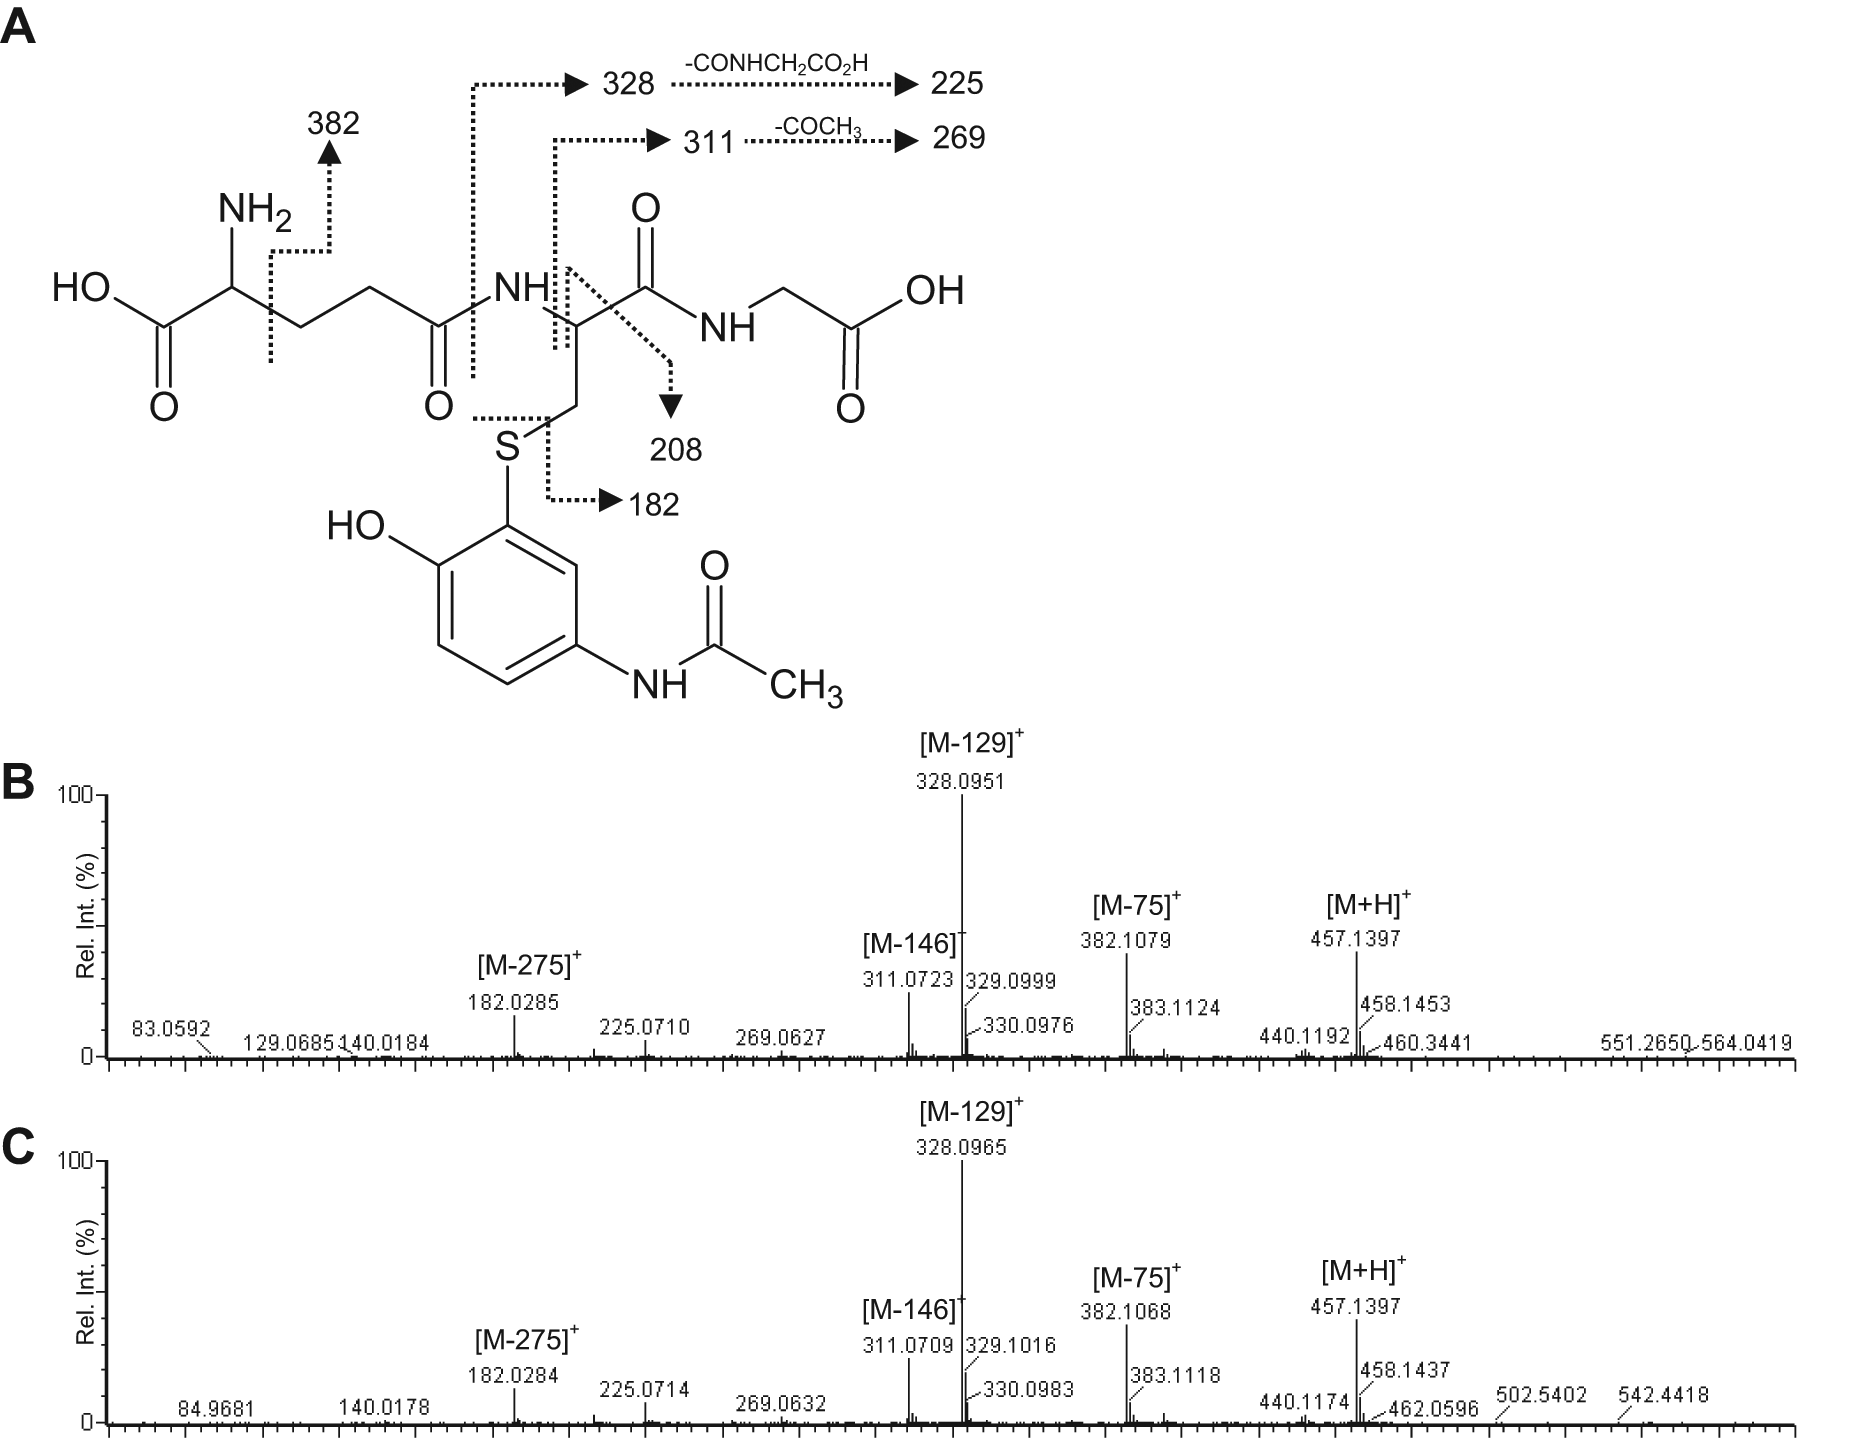
(
Investigation of Metabolism of Testosterone Using Liver Microsomes
Multiple hydroxytestosterone metabolites were detected at different levels in the microsomal incubation mixtures. After eliminating false-positive peaks by comparing the chromatogram of testosterone samples with the controls without liver microsomes, a total of seven putative hydroxylated metabolites of testosterone, M1 to M7, were identified. The identity of three of the metabolites—M1, M5, and M6—were confirmed as 6β-, 16β- and 2α-hydroxytestosterone, respectively, using reference standards.
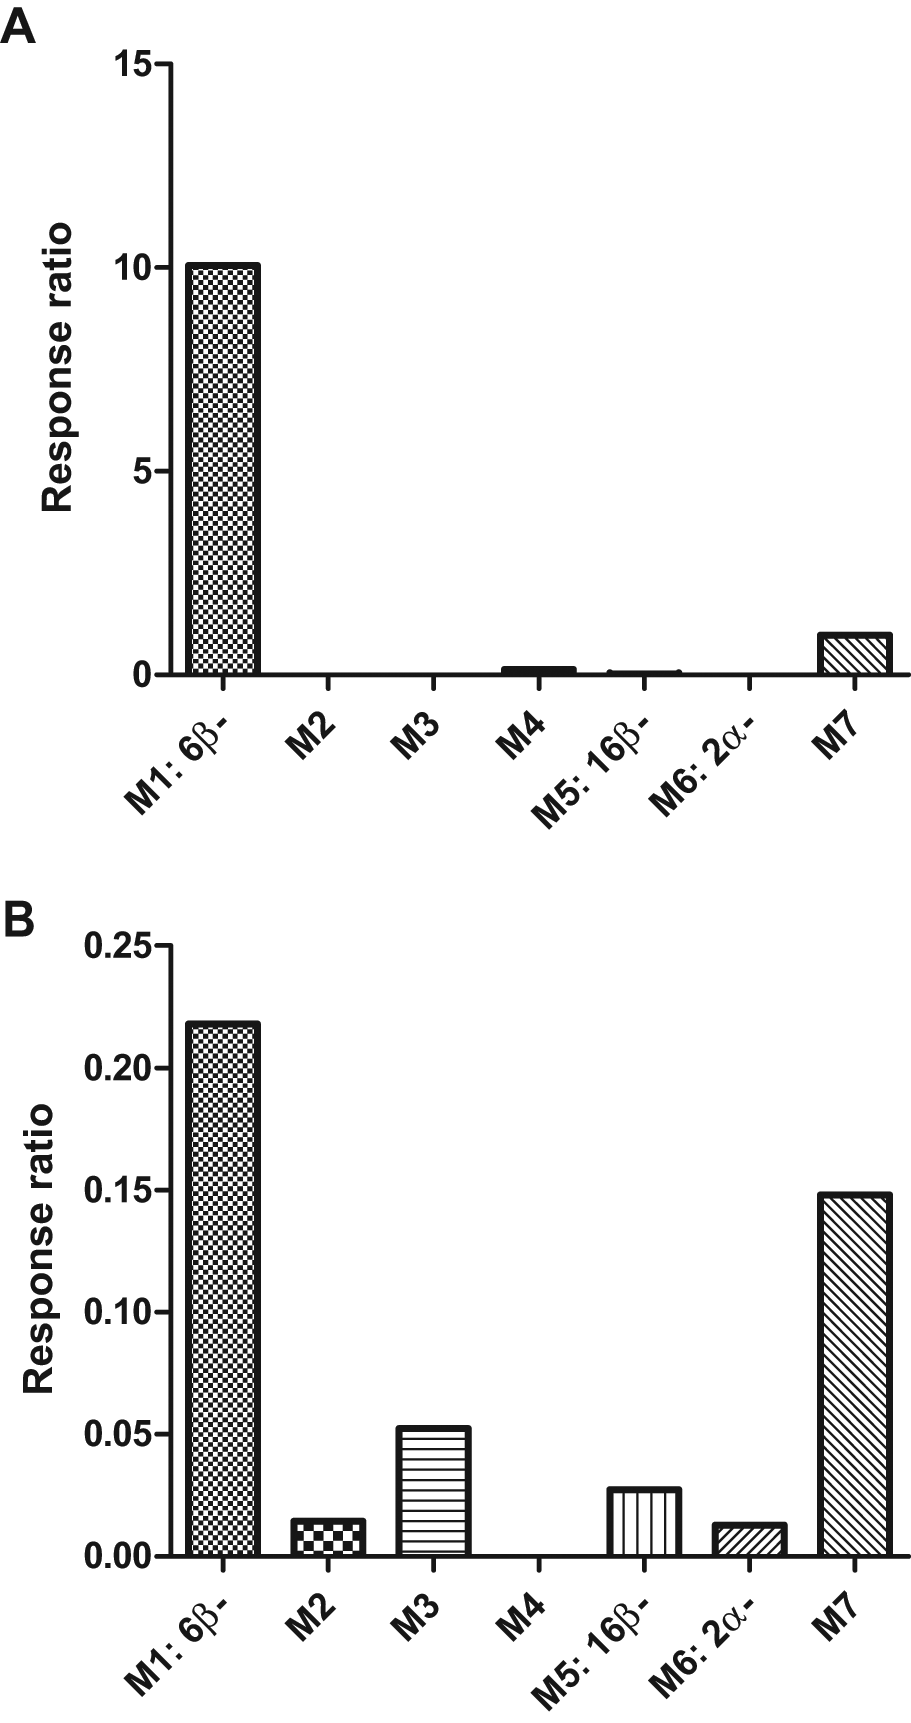
The overlay extracted ion chromatograms of 2α-, 6β-, 7α-, 15β-, 16α-, and 16β-hydroxytestosterone reference standards, and the extracted ion chromatograms of the putative hydroxylated metabolites of testosterone, M1 to M7, in HLM and ZLM are shown in Figure 2 . The response ratio of each metabolite was calculated by taking the area ratio of hydroxytestosterone to prednisolone (IS). The profile of the metabolites formed at 2 h for each liver microsome fraction is shown in Figure 3A , B , respectively. The major metabolite formed by HLM and ZLM was 6β-hydroxytestosterone (M1), observed at a retention time (Rt) of 1.332 min. The second most abundant metabolite formed by both HLM and ZLM was M7 (Rt = 2.004 min). The third most abundant metabolite formed by ZLM was M3 (Rt = 1.667 min), which was unique to zebrafish as this metabolite was not observed in HLM. In addition, M2 (Rt = 1.445 min) was formed only by ZLM, whereas M4 was formed only by HLM. Even though the CYP concentration was standardized at 20 pmol/mL, the levels of 6β-hydroxytestosterone (M1) formed at 2 h were clearly higher in HLM as compared with ZLM (10-fold higher).
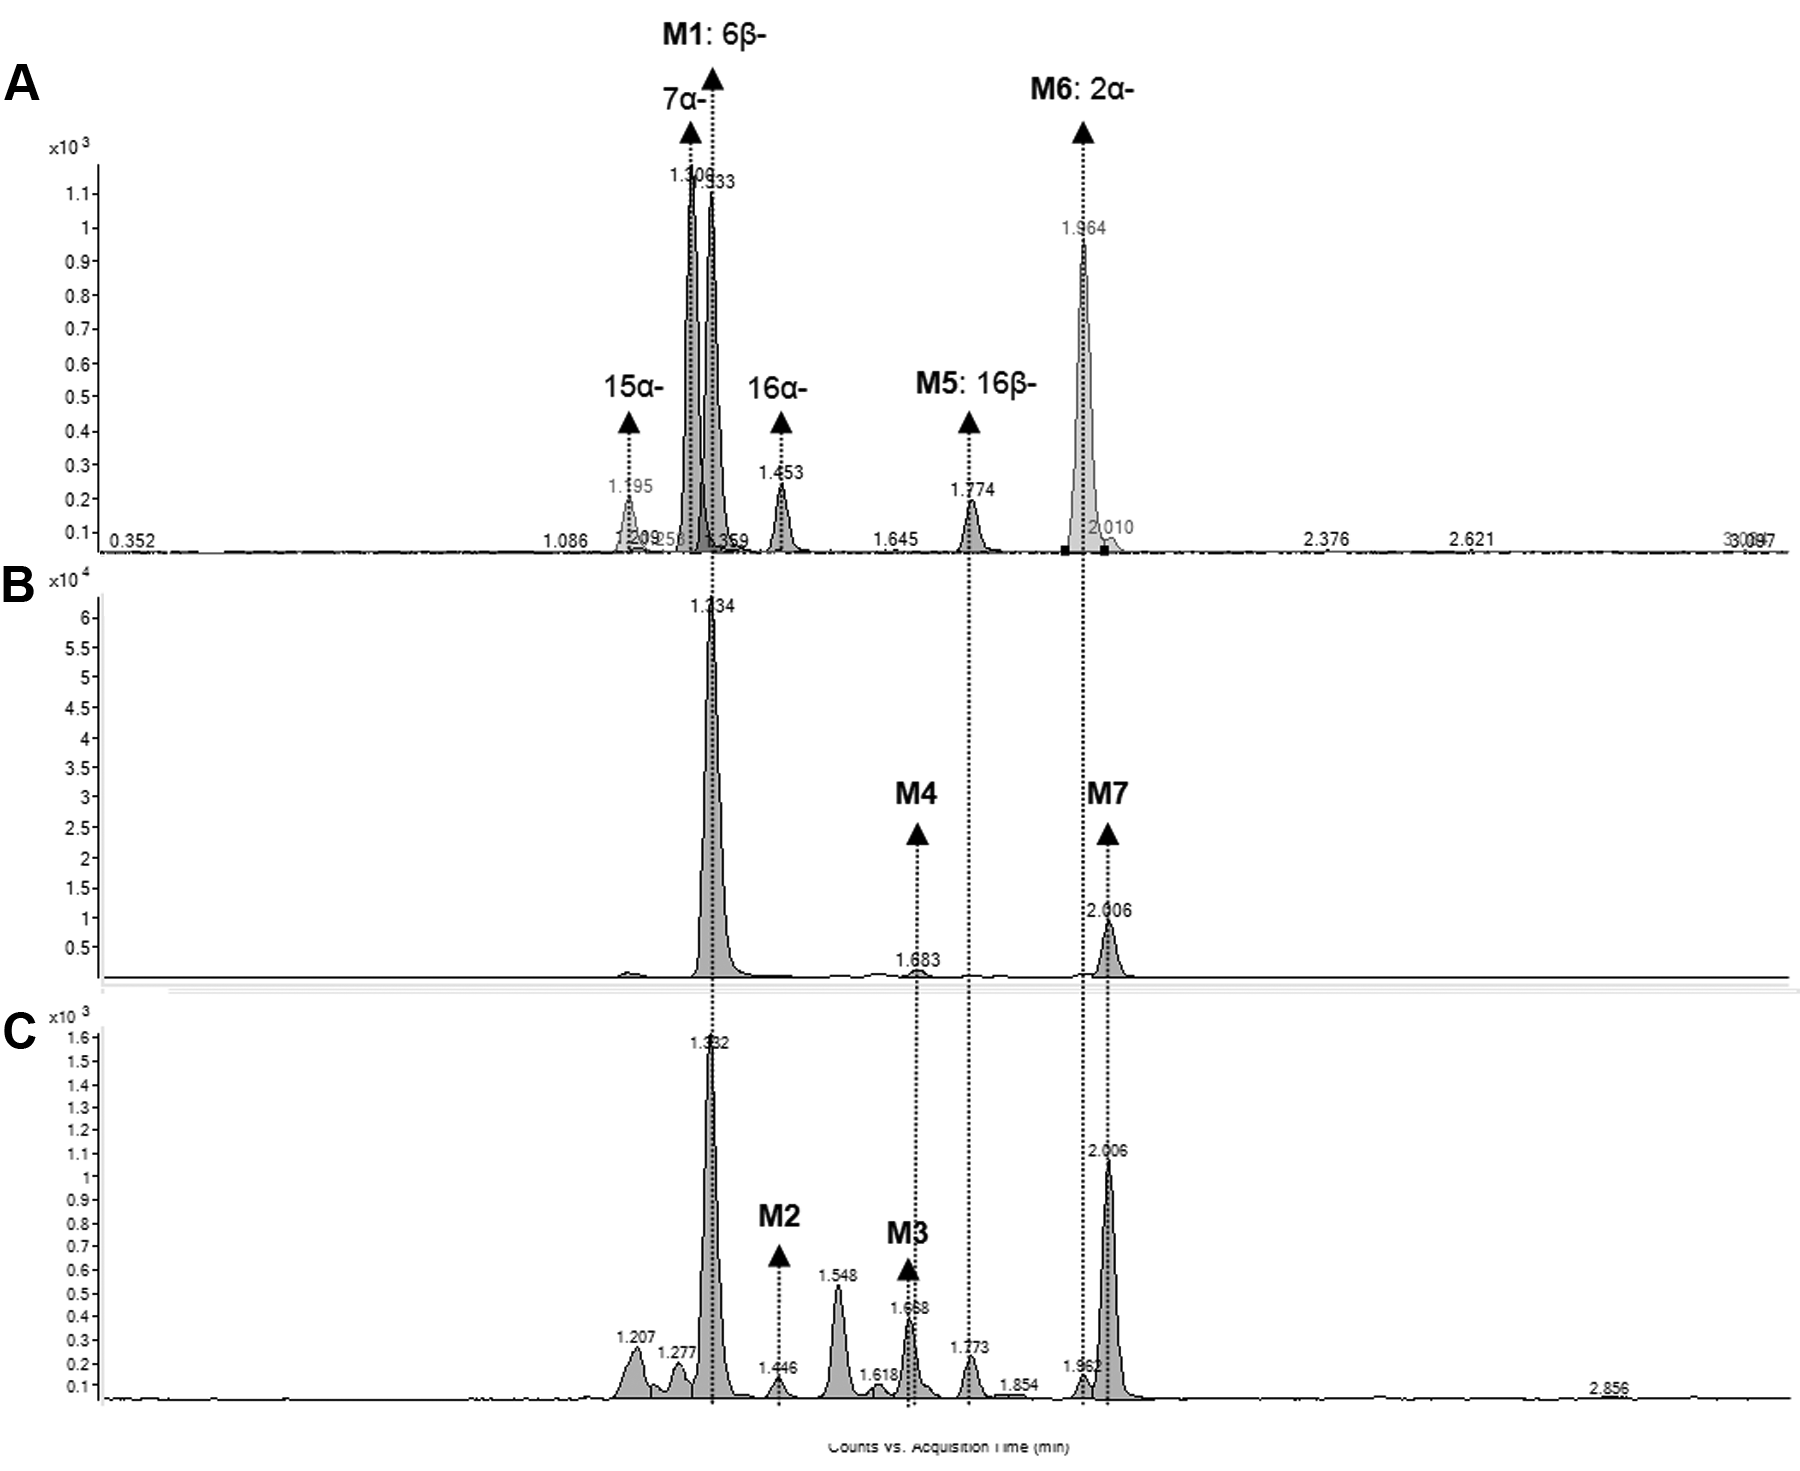
Extracted ion chromatograms of hydroxytestosterone (m/z 305.2) in the (
Profiles of hydroxytestosterone metabolites formed at 2 h by (
Using a mass tolerance of 10 ppm, the measured mass, mass accuracy, and i-Fit (norm) values (the likelihood that the isotopic pattern of the elemental composition matches a cluster of peaks in the spectrum) associated with the calculated exact mass of M1 to M7 ([M+H]+ 305.2117 Da and elemental composition of C19H29O3) for the three microsomal fractions were generated and tabulated (
Investigation of Metabolism of Testosterone by Zebrafish Larvae
Two putative hydroxytestosterone metabolites were identified in zebrafish larvae homogenate and E3M media samples after eliminating the false-positive compounds (Rt = 1.210 and 1.550 min) observed in control samples. The major metabolite, M8 (Rt = 1.817 min), was unique and not found in the ZLM samples. The second metabolite was confirmed to be 6β-hydroxytestosterone (M1), using reference standards. The extracted ion chromatograms of the putative hydroxylated metabolites of testosterone in zebrafish larvae homogenate and E3M media are shown in Figure 4 . Accurate mass measurement was performed using the UPLC/QTOF/MS/MS, and the measured mass (ppm, i-FIT [norm]) associated with the calculated exact mass of hydroxytestosterone ([M+H]+: 305.2117 Da and elemental composition of C19H29O3) of M8 in zebrafish larvae homogenate and E3M media samples was 305.2099 (–5.9, 2.0) and 305.2137 (6.6, 1.1), respectively. M1 was not detected on the QTOF due to low sensitivity.
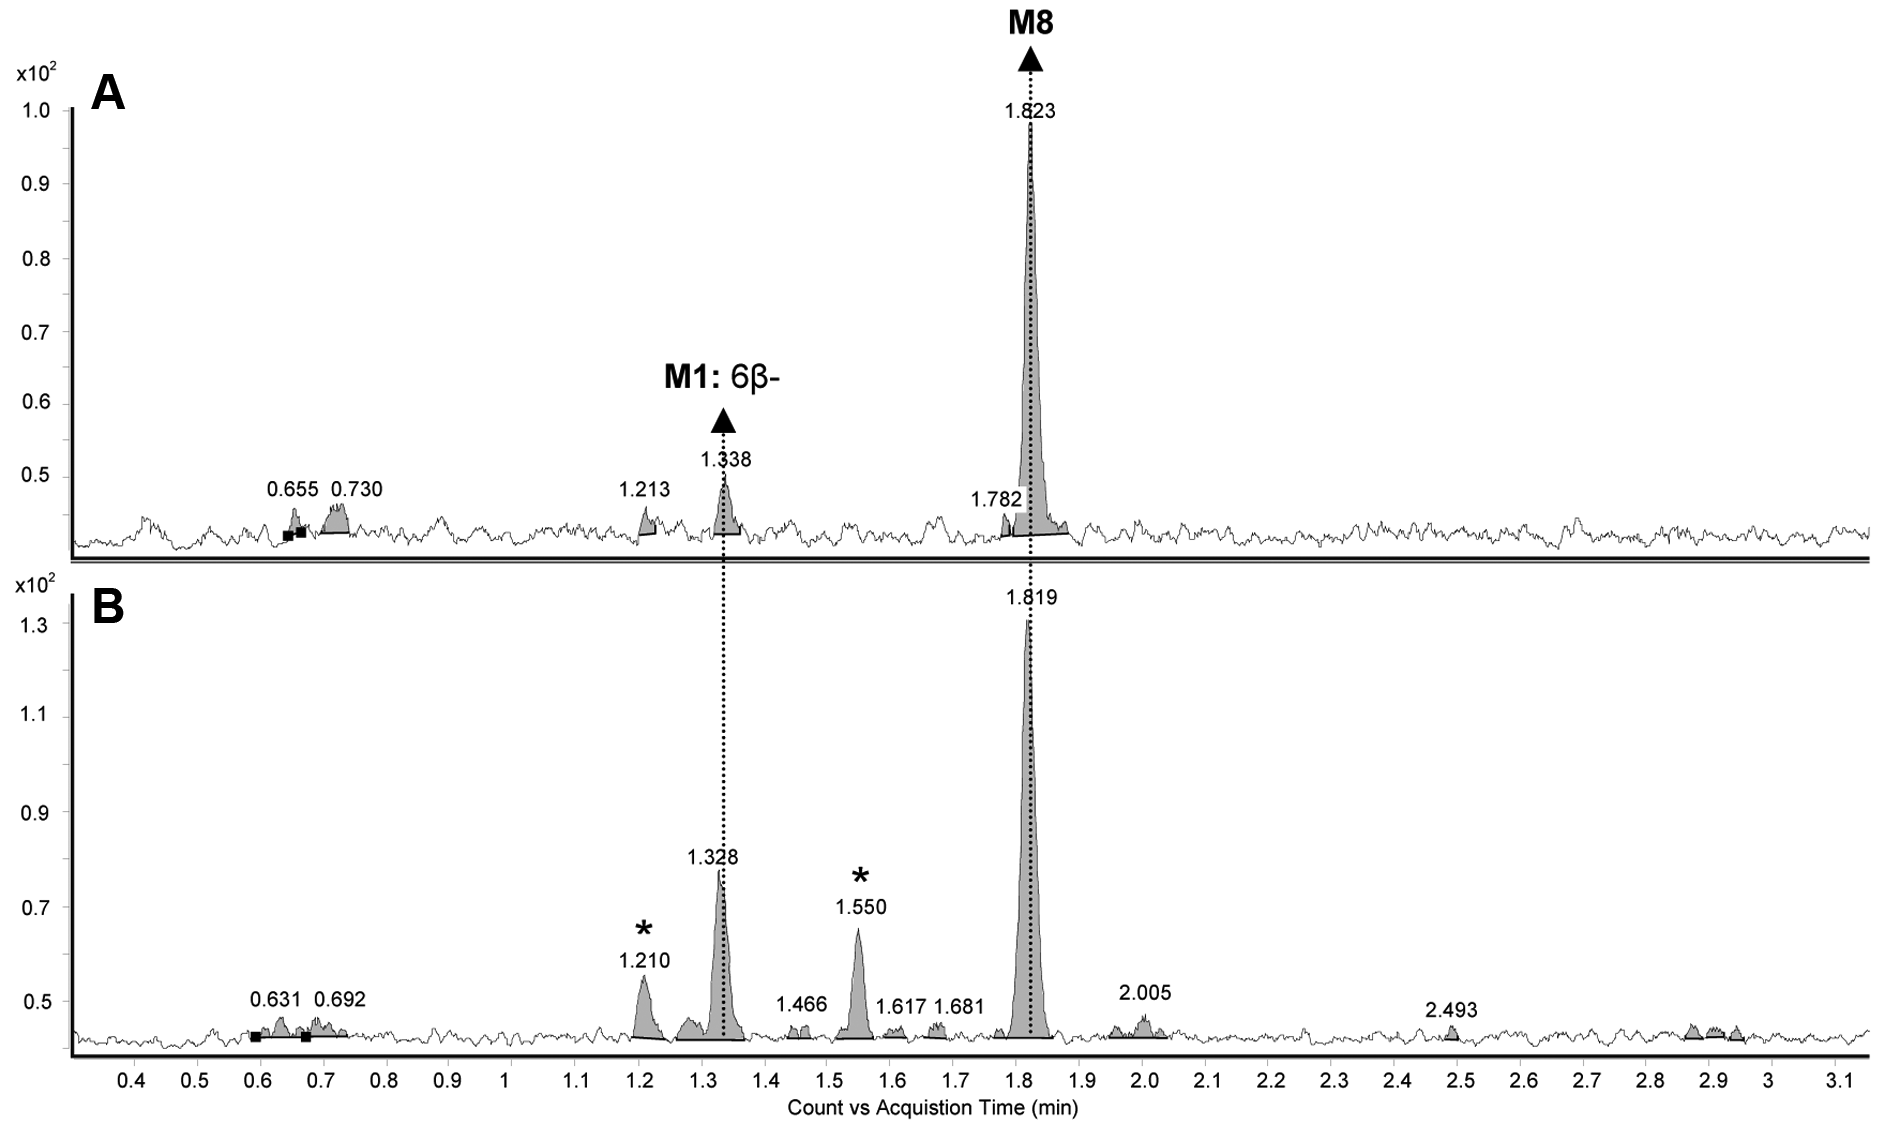
Extracted ion chromatograms of hydroxytestosterone (m/z 305.2) in the (
In addition, M9 was also detected in both the zebrafish larvae homogenate and E3M media samples. M9 was confirmed to be testosterone glucuronide based on the superior mass accuracy and i-FIT values. The measured mass (ppm, i-FIT [norm]) associated with the calculated exact mass of testosterone glucuronide ([M+H]+: 465.2488 Da and elemental composition of C25H37O8) of M9 in zebrafish larvae homogenate and E3M media samples was 465.2489 (0.2, 0.8) and 465.2481 (–1.5, 1.8), respectively. The mass spectra of M9 in zebrafish larvae homogenate and E3M media are shown in Figure 5 . The difference of 176 Da between m/z 465.2 and 289.2 corresponded to the loss of a glucuronide molecule (C6H8O6). The fragmentation pattern of M9 also corroborated with those reported for testosterone glucuronide in the literature. 15
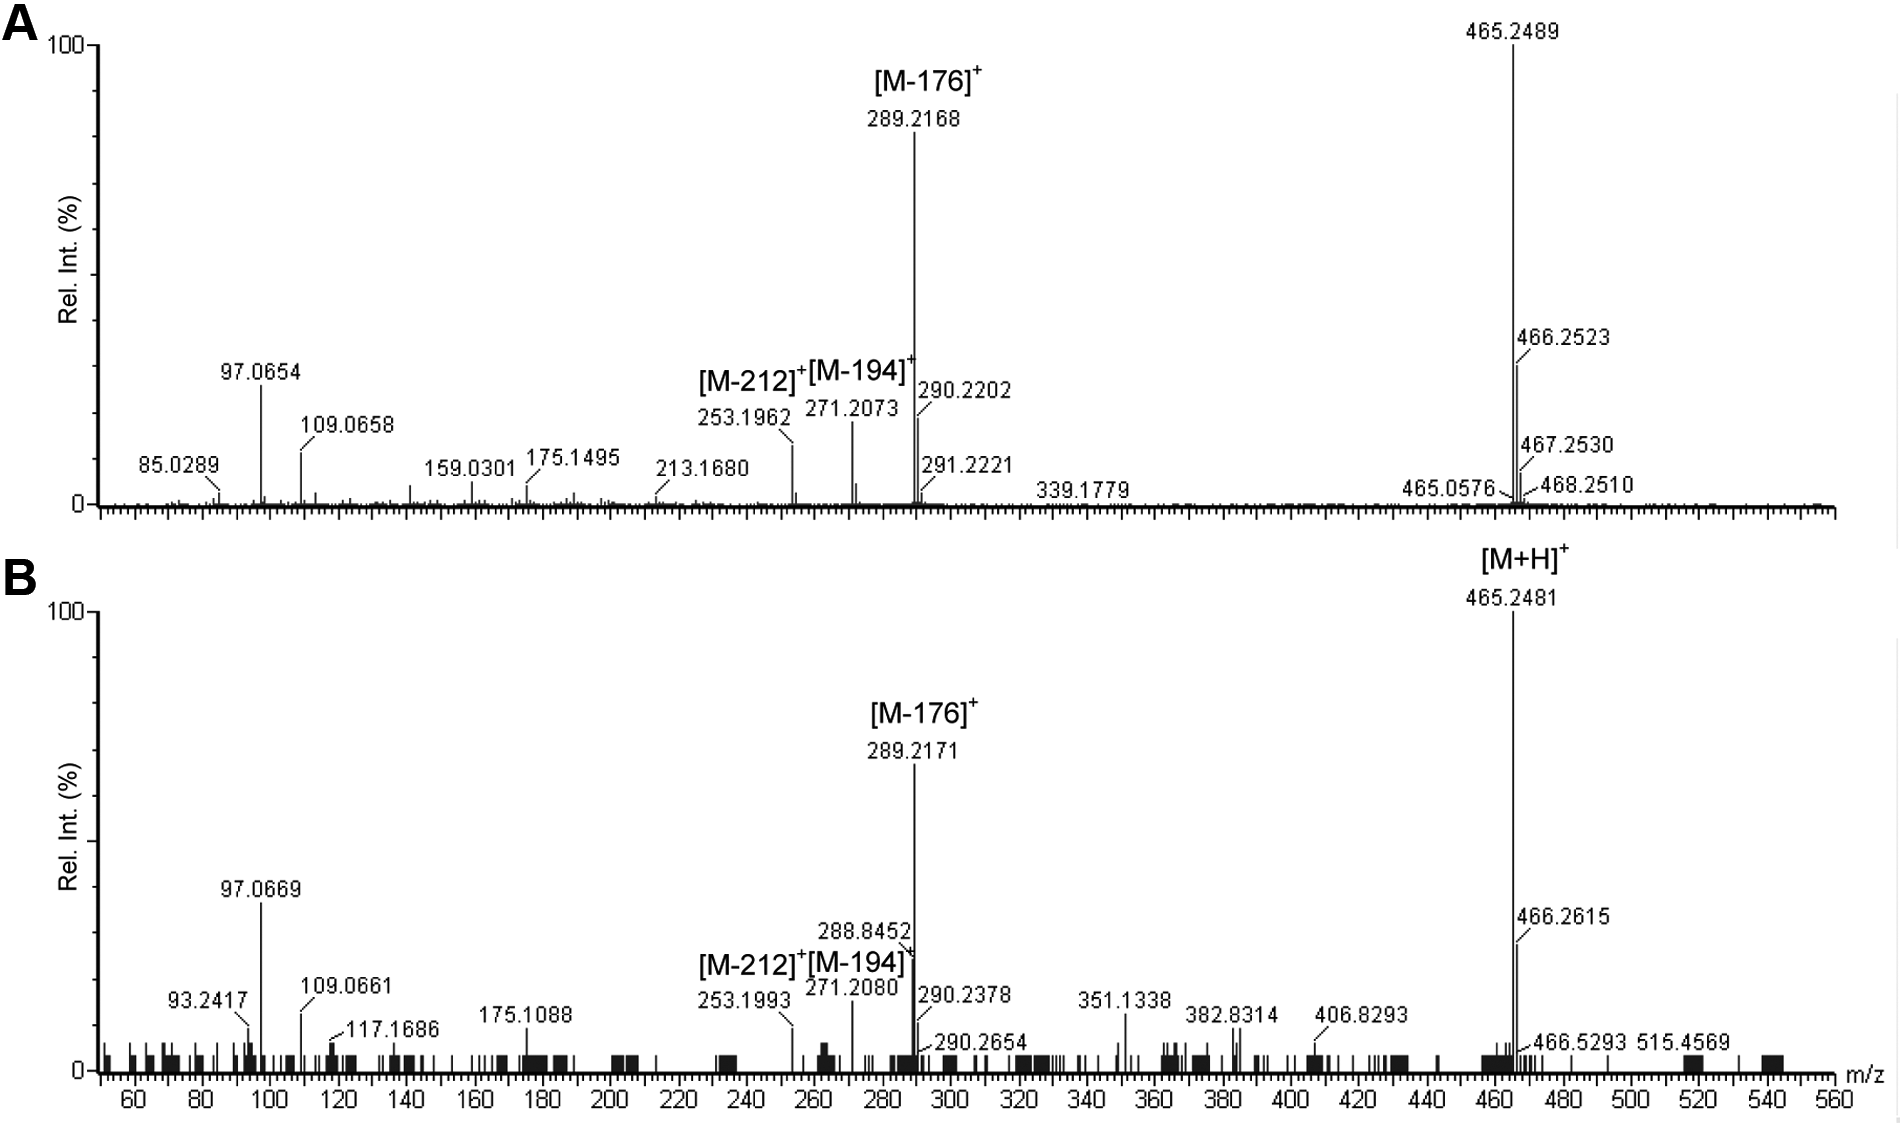
Quadrupole time-of-flight/tandem mass spectrometry (QTOF/MS/MS) spectra of M9 (testosterone glucuronide, calculated accurate mass of [M+H]+: 465.2488 Da and elemental composition of C25H37O8) in the (
Homology Modeling of Zebrafish CYPs
The Ramachandran plots for zebrafish CYP3A65, CYP3C1, CYP1A, and CYP2Y3 are shown in
Docking Studies
Two different poses of APAP fit the profile of the expected pose for human CYP3A4 and are shown in Figure 6A . The first pose (h3A4APAP1) interacted with six residues (Phe304, Ala305, Thr309, Ile369, Leu482, Leu483) with APAP. The second pose (h3A4APAP2) interacted with five residues (Arg105, Ser119, Ala370, Arg372, Leu373) with APAP. These two poses were used as reference poses for APAP. Comparison of the poses of APAP in human CYP2E1 and CYP2C9 and the reference poses in human CYP3A4 showed that for CYP2E1, APAP was able to adopt a similar pose to h3A4APAP1. However, it interacted with only four of the six residues. For CYP2C9, APAP did not have any similar pose to both the reference poses.
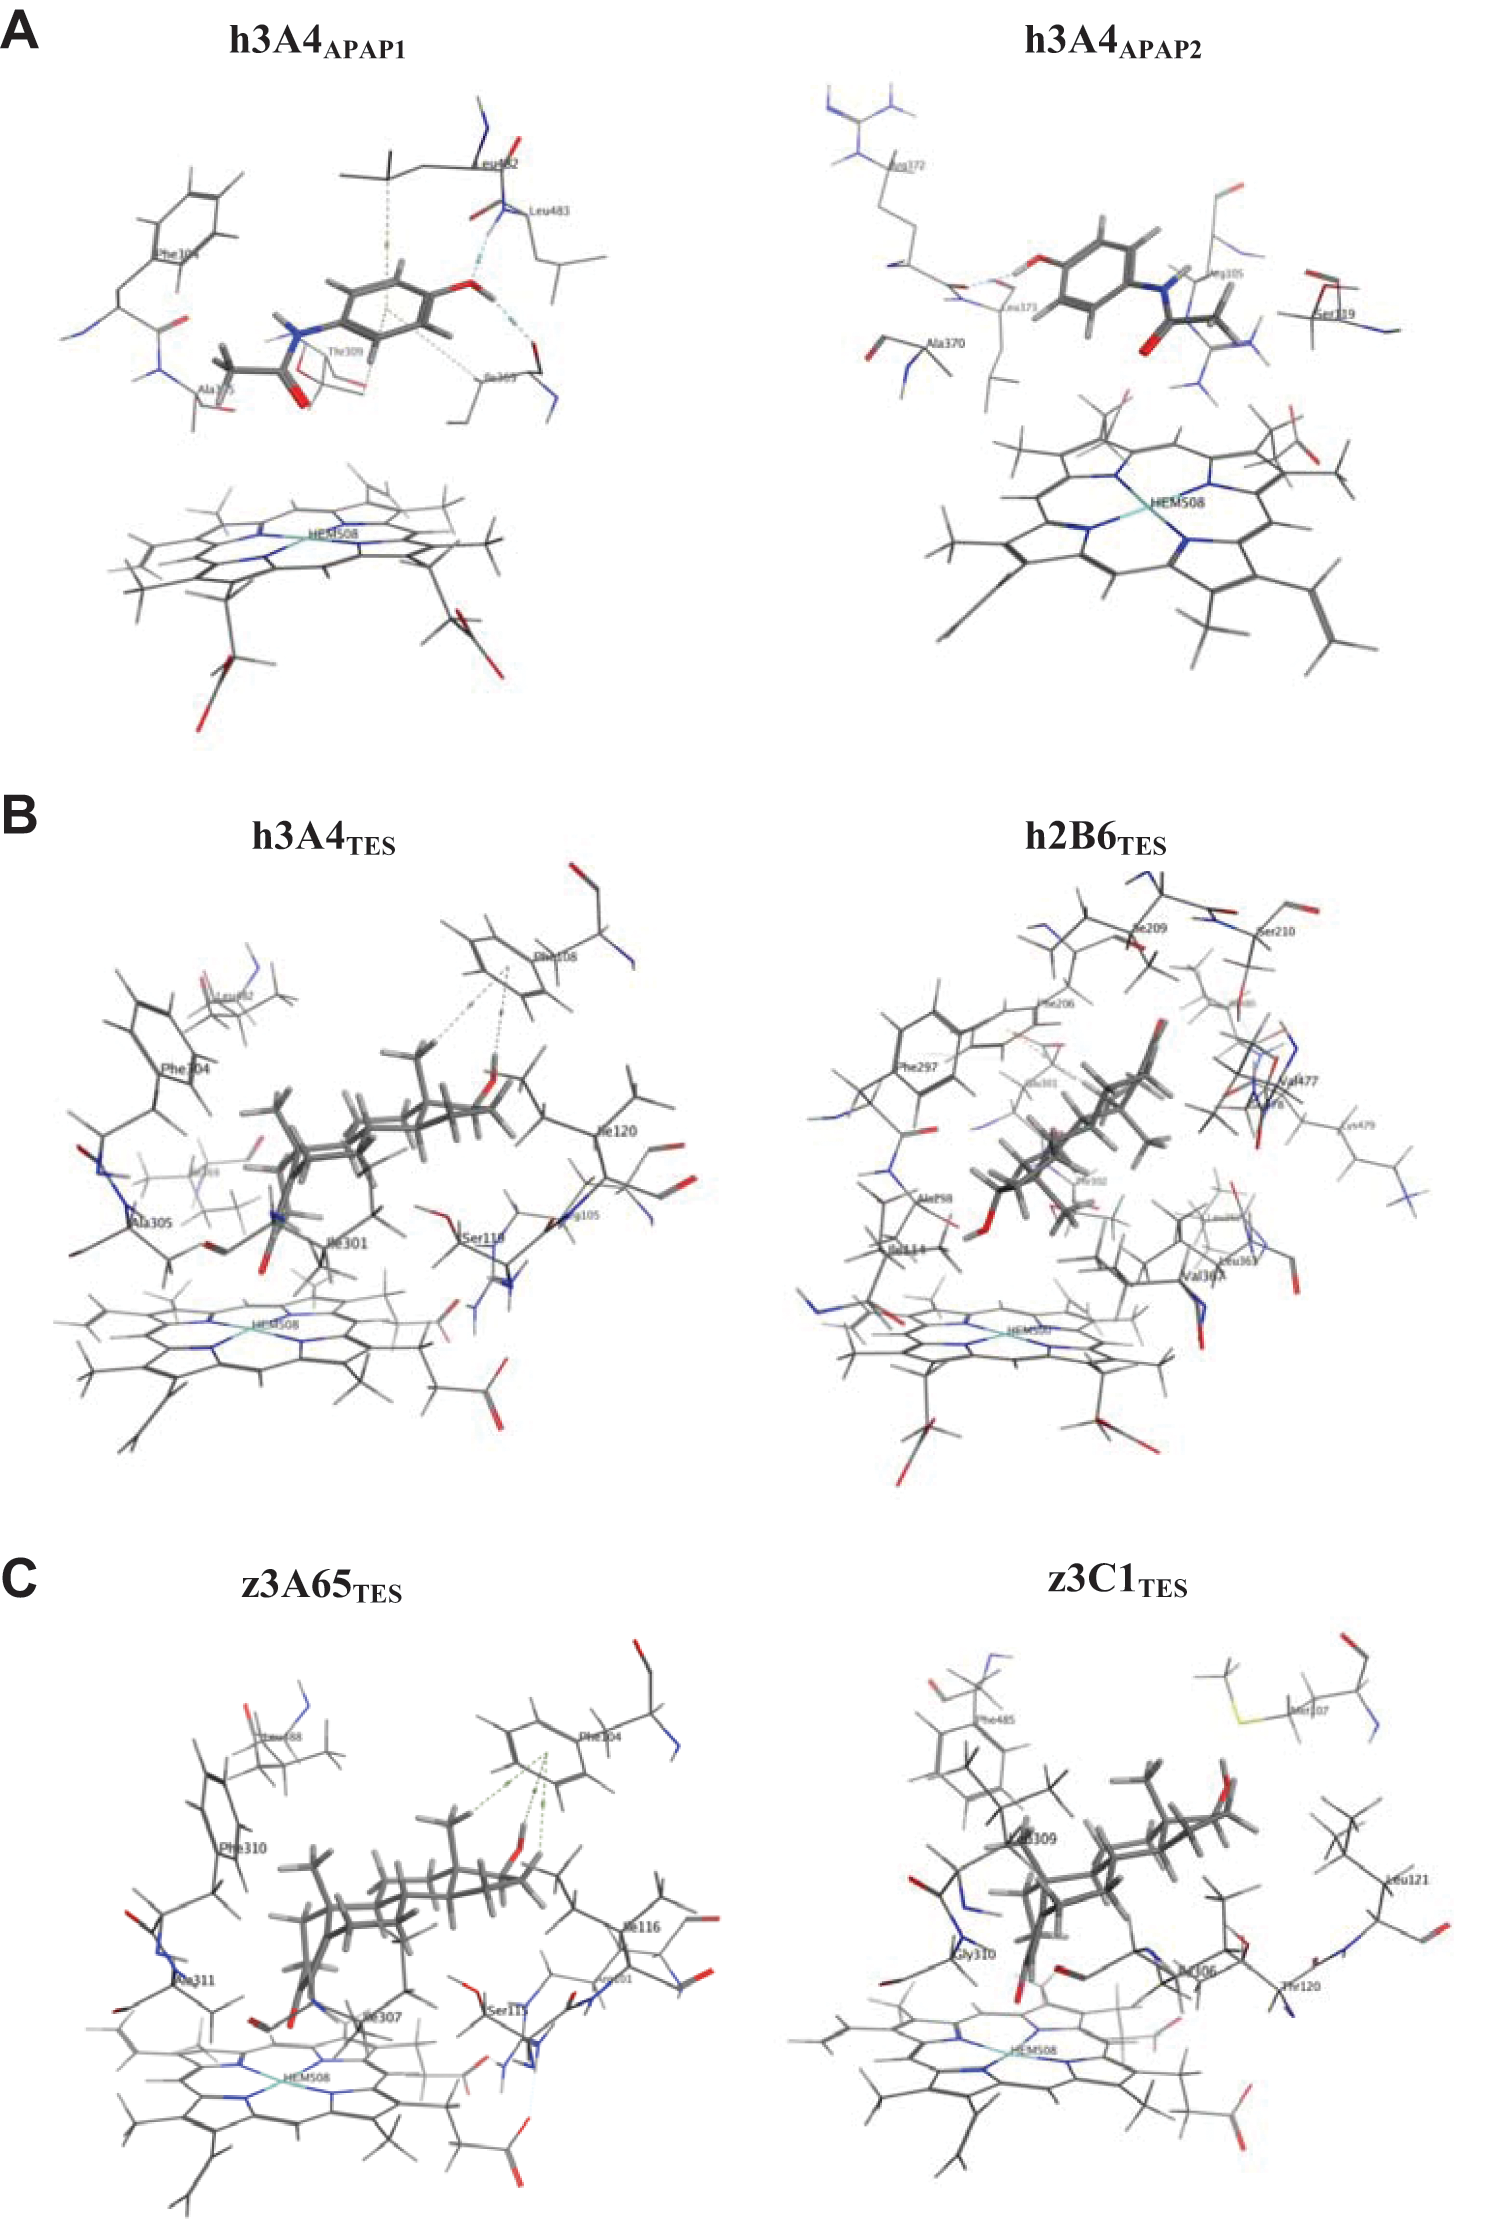
(
APAP docking results for zebrafish CYP3A65, CYP3C1, CYP1A, and CYP2Y3 showed that for both CYP3A65 and CYP3C1, APAP was able to adopt expected poses similar to both h3A4APAP1 and h3A4APAP2. For CYP3A65, the binding interactions involved all the respective residues, whereas for CYP3C1, the pose similar to h3A4APAP1 interacted with four of the six residues, whereas the pose similar to h3A4APAP2 interacted with all five residues. APAP did not have any similar pose to both the reference poses for zebrafish CYP1A and CYP2Y3.
The poses of testosterone in human CYP3A4 (h3A4TES) and CYP2B6 (h2B6TES) are given in Figure 6B . h3A4TES interacted with nine residues (Arg105, Phe108, Ser119, Ile120, Ile301, Phe304, Ala305, Ile369, Leu482) and had the ketone group directed toward the heme group. h2B6TES interacted with 15 residues (Ile114, Phe206, Ile209, Ser210, Phe297, Ala298, Glu301, Thr302, Leu362, Leu363, Val367, Val477, Gly478, Lys479, Ile480) and had the hydroxyl group directed toward the heme group. Testosterone did not have any poses that were similar to either h3A4TES or h2B6TES in human CYP1A2, which was consistent with the observation that human CYP1A2 has not been reported to be involved in the metabolism of testosterone.
Testosterone docking results for zebrafish CYP3A65, CYP3C1, CYP1A, and CYP2Y3 showed that for CYP3A65 and CYP3C1, testosterone was able to adopt poses that were similar to h3A4TES ( Fig. 6C ). Testosterone interacted with eight and seven of nine residues in zebrafish CYP3A65 and CYP3C1, respectively. For CYP1A, testosterone did not have any pose that was similar to either h3A4TES or h2B6TES. For CYP2Y3, testosterone was able to adopt a pose similar to h2B6TES, but it interacted with only 7 out of 15 residues.
Discussion
In a recent report, the full repertoire of 94 CYP genes in zebrafish was characterized. 14 A number of zebrafish CYP isoforms such as CYP3A65, 16 CYP3C1, 17 and CYP2J1 18 have been studied but were primarily performed at the mRNA expression level. To understand the suitability of zebrafish as a toxicity screening model, the current study evaluated APAP bioactivation and metabolism of testosterone in zebrafish as compared with human. As this study focused on metabolite profiling and did not attempt to assess enzyme kinetics, each substrate (1 mM APAP and 100 µM testosterone) was dosed above the Km of various enzymes to elucidate the differential metabolism pathways among the two species. The aim of the study was also not to develop ZLM as a screening model for drug metabolism studies as HLM is already a well-established model in pharmaceutical research.
APAP Bioactivation
Hepatotoxicity of APAP is attributed to its reactive metabolite, NAPQI, formed from CYP-mediated metabolism of APAP. CYP3A4 is the major CYP isozyme responsible for this bioactivation.2,11 Recently, hepatotoxicity was observed in adult zebrafish exposed to APAP. 19 Although the formation of NAPQI has been demonstrated using human and animal liver microsomes, the ability of zebrafish to generate the same reactive metabolite has not been evaluated. Our data demonstrated for the first time that NAPQI was generated by ZLM, albeit at lower levels than HLM. As differential APAP metabolism and APAP-induced cytotoxicity had been observed among species previously, 20 our findings reinforced the importance of selecting the relevant toxicological model to obtain reliable cross-species correlation, especially when the toxicity is metabolism based. Based on our results, it could be postulated that the APAP-induced hepatotoxicity observed in adult zebrafish by North et al. 19 might be associated with the formation of NAPQI.
In the expression of the full complement of CYP genes in zebrafish, no syntenic form of human CYP2E1 was reported. 14 Although Genecards reported 2 orthologs of CYP2E1 in zebrafish—namely, CU928854.1 and cyp2y3—the association of cyp2y3 to human CYP2E1 was not identified. 14 Hence, our in silico docking studies were performed with a focus on CYP3A65 and 3C1 and not 2E1. On the basis of the degree of similarity between expected and reference poses, we postulated that the formation of NAPQI in zebrafish is possibly associated with CYP3A65, with contributions from CYP3C1. Although further experiments using recombinant CYP3A65 and 3C1 have to be performed to confirm our postulation, our in vitro findings established evidently the bioactivation potential of zebrafish with regard to APAP.
Testosterone Metabolism in Liver Microsomes
6β-Hydroxylation of testosterone is an indication of CYP3A4/5 activity. 12 Recently, CYP3A4/5-like activity in zebrafish was demonstrated where testosterone was found to be hydroxylated by zebrafish hepatocytes 21 and zebrafish larvae. 5 Alderton et al. 5 detected one hydroxylated metabolite in the zebrafish larvae, whereas Reschly et al. 21 detected four hydroxylated metabolites—namely, 6β-, 15α-, 16α-, and 16β-hydroxytestosterone in zebrafish hepatocytes. In the present study, we identified more metabolites—namely, 2α-, 6β-, and 16β-hydroxytestosterone—and three putative metabolites (M2, M3, and M7) in the ZLM and 6β-hydroxytestosterone, testosterone glucuronide, and M8 in zebrafish larvae homogenate and media. The formation of 6β-hydroxytestosterone in both ZLM and larvae established CYP3A4/5-like activity in zebrafish. The zebrafish genome has five CYP3 genes, but only CYP3A65 and 3C1 have been cloned and shown to be heterogeneously expressed thus far.16,17 On the basis of the optimal in silico docking data, we postulated the contributions of CYP3A65 and 3C1 to the metabolism of testosterone in zebrafish.
Previous literature demonstrated differential species metabolism of testosterone using rat, human, and porcine hepatocytes. Although the main metabolite formed by zebrafish remained as 6β-hydroxytestosterone (M1), the overall metabolite profile was distributed across more hydroxylated metabolites compared with HLM ( Fig. 3A , B ). Second, a number of unique hydroxytestosterone metabolites were observed only in zebrafish. Third, the extent of metabolite formation, taking 6β-hydroxytestosterone formed at 2 h for comparison, was clearly lower in ZLM compared with HLM, considering that CYP concentration was standardized across all microsomal fractions. Collectively, our data confirmed that the phase I hydroxylation pathway of testosterone in zebrafish is distinct as compared with human.
Testosterone Metabolism in Zebrafish Larvae
Adult zebrafish have been shown to express Ugt genes, which code for the family of enzymes responsible for the glucuronidation of xenobiotics in mammalian models. 6 More recently, functional conjugative metabolism (either glucuronidation or sulfation) by 4 dpf zebrafish was reported using alkoxyresorufin substrates, 22 and testosterone glucuronide was detected in 7 dpf larvae. 5 Testosterone glucuronide detected in our study confirmed functional phase II metabolic activity by UGT in zebrafish larvae as young as 5 dpf.
Differences in biotransformation of testosterone between zebrafish larvae and ZLM isolated from adult zebrafish were observed in our study. Although the ZLM formed multiple hydroxytestosterone metabolites, the zebrafish larvae produced only two hydroxytestosterone metabolites. Formation of such few metabolites by the larvae corroborates with the observation by Alderton et al. 5 in which only one hydroxytestosterone metabolite was detected apart from a glucuronidated testosterone in 7 dpf zebrafish larvae. A recent study characterizing the developmental expression of CYP genes in zebrafish larvae revealed that 66 of the 88 CYP genes examined demonstrated differential expression during development between 3 h postfertilization (hpf) through 48 hpf. 14 A bimodal expression pattern was observed with CYP3A65, the CYP likely to be responsible for the metabolism of testosterone based on our docking studies. Even though the liver of the zebrafish larvae is fully developed by 5 dpf, the differences observed in our study suggest a difference either in the function or expression of the drug-metabolizing enzymes between zebrafish larvae and adult zebrafish. In these final experiments, we established phase II glucuronidation of testosterone in zebrafish and highlighted the changes in testosterone metabolism phenotypes as the zebrafish develops from the larva to adult stage. Therefore, developmental staging needs to be carefully considered when drawing conclusions from drug metabolism studies.
Recent developments in molecular toxicology have provided new technologies to facilitate our understanding of the role of drug metabolism in adverse drug reactions. However, much remains to be done to screen and validate animal models for the prediction of drug safety. The use of zebrafish for HTS of candidate compounds in drug research is likely to be performed using small larvae instead of ZLM. The finding of NAPQI represents the opportunity of using zebrafish for the profiling of pharmaceutical reactive metabolites and covalent adduction of tissue proteins in toxicity screening. Since the larvae are transparent, they offer toxicology scientists an alternative to study in vivo covalent adduction of tissue and organs using labeled probe chemicals and imaging techniques. Further screens using drug compounds known to generate toxic reactive metabolites in human need to be tested in zebrafish larvae to validate and establish the role of the model in reactive metabolite profiling. Examples of such drugs are diclofenac or tienilic acid, which are known to generate toxic reactive metabolites via phase I and/or phase II metabolic pathways.
Our findings highlighted both concordance and variation in phase I and II metabolism of testosterone between zebrafish and human. As species difference may lead to differences in pharmacological and toxicological outcomes, the underlying knowledge gap in drug metabolism needs to be addressed with regard to each candidate compound before the zebrafish model can be used for toxicity screening. In addition, the age of the zebrafish larvae needs to be investigated and standardized to ensure that the metabolism phenotype is sufficiently stable for toxicity testing. In conclusion, there is a caveat emptor that places an onus on the pharmaceutical scientist to make sure the zebrafish model is suitable for the toxicity screening of candidate compounds. This is because once the experiment is performed, the model itself does not guarantee the concordance between zebrafish and human toxicities, and there is a risk of wrong prediction of drug safety.
Footnotes
Acknowledgements
This article is dedicated to the late Professor Sidney Nelson. As the National University of Singapore Distinguished Professor from 2009–2011, Professor Nelson visited our department and provided scientific advice on this project.
Declaration of Conflicting Interests
The authors declared no potential conflicts of interest with respect to the research, authorship, and/or publication of this article.
Funding
The authors disclosed receipt of the following financial support for the research, authorship, and/or publication of this article: This work was supported by the National University of Singapore (NUS) Life Science Institute Toxicology Program grant R-711-000-014-101 provided to E. C. Y. Chan. H. T. Chng is supported by the NUS President Graduate Fellowship.
References
Supplementary Material
Please find the following supplemental material available below.
For Open Access articles published under a Creative Commons License, all supplemental material carries the same license as the article it is associated with.
For non-Open Access articles published, all supplemental material carries a non-exclusive license, and permission requests for re-use of supplemental material or any part of supplemental material shall be sent directly to the copyright owner as specified in the copyright notice associated with the article.