
Abstract
Implementing functional cell-based screens in early antibody discovery has become increasingly important to select antibodies with the desired profile. However, this is limited by assay tolerance to crude antibody preparations and assay sensitivity. The current study aims to address this challenge and identify routes forward. Two common types of high-throughput screening (HTS) antibody sample, derived from either phage display or hybridoma techniques, have been screened across a wide range of CellSensor beta-lactamase reporter assays in a variety of cell backgrounds to more extensively characterize assay tolerance. Pathway-, sample-, and cell background–specific effects were observed. Reporter assays for agonism were less affected by crude antibody preparations, with 8 of 21 sample tolerant, and the potential to implement an additional 8 assays by choosing the best-tolerated sample type. Antagonist mode assays exhibited more complexity, with potentiating as well as inhibitory effects. However, 5 of 24 antagonist assays were fully tolerant, with the potential to implement an additional 11 assays. Different subsets of assays were affected in agonist versus antagonist mode, and hybridoma sample sets were better tolerated overall. The study clearly demonstrates the potential to use cell-based reporter assays in biologics HTS, particularly if the method of antibody production is considered in the context of the required assay mode (agonist/antagonist).
Keywords
Introduction
Therapeutic antibody drug discovery relies on the ability to identify leads from diverse repertoires of candidates, commonly contained in antibody fragment combinatorial libraries or derived using traditional hybridoma technology. 1 In contrast to small-molecule discovery, protein libraries are often initially screened from extracts or supernatants containing protein of variable and undetermined concentration, rather than using purified proteins. The starting point for antibody lead isolation thus frequently involves evaluating hybridoma supernatants 2 following immunization in wild-type or transgenic mice3–5 or using large, diverse libraries of human antibodies in phage display format.6–8 Here, the single-chain Fv (scFv) repertoire has been cloned into phagemid vector pCantab6, where an amber codon allows switching between phage-displayed scFv (rescued using helper phage) and soluble scFv expression (induced with isopropyl-β-D-thio-galactoside [IPTG] via the lac promoter). 9 Following phage display selection from antibody libraries to enrich for target-specific clones, 7 soluble scFv expression can be induced in Escherichia coli for further screening,10,11 resulting in highly focused, relatively low-throughput screening campaigns, typically around 10 to 20 000 scFv antibodies during lead isolation.
Common mechanisms of action for many therapeutic antibodies to date1,12 center on cell killing (engaging effector function, directly triggering apoptosis, or delivering toxic payloads) or having an antagonistic or a neutralizing function.4,6,13 For blocking antibodies, successful screening campaigns have often been conducted using binding assays, such as biochemical receptor-ligand competition, to identify inhibitory antibodies with high target specificity. Binding assays have also been used extensively in small-molecule screening, but widespread implementation of functional cell-based HTS (e.g., Kunapuli et al. 14 ) has provided opportunities to identify leads with more diverse sites or mechanisms of action. Target inhibition may not always be the desired mechanism, however, and there may be a rationale for developing antibodies with defined efficacy profiles such as agonists (e.g., Dobson et al. 15 ), inverse agonists, and allosteric modulators. 16 Another challenge is an increasing need to target complex multimembrane spanning receptors, which exist in dynamic conformational states and are challenging to screen in a nonmembrane context. Early implementation of functional cellular screens has thus become a more pressing need, with greater scope to identify functionally relevant epitopes 17 and potentially reduce attrition.
Although later-stage titration and pharmacological characterization are likely to be done using purified proteins, primary HTS in hybridoma campaigns is initially conducted on crude antibody supernatants to prioritize which IgGs to take forward. In phage display campaigns, crude scFv extracts are again often the first-line screen, with subsequent purification or IgG conversion potentially rate limiting. Use of crude preparations has historically limited cell assay implementation in early antibody HTS cascades. The first issue is sensitivity of assays to detect effects of variable levels of crude, unpurified scFvs or IgGs during early lead isolation, before leads are affinity optimized. The expression level of scFv in E. coli is dependent on the primary sequence and can be extremely variable,11,18 with similar variations in protein concentration also observed in hybridoma supernatants. Variable or low expression, the unknown concentration of antibody fragments in crude preparations, a wide range of potential affinities, 19 and potency shifts often observed between biochemical and cell assays all affect observed cellular responses.
The second issue is assay tolerance to crude bacterial preparations, with cell assays typically tolerating less than biochemical formats. 17 By-products from bacterial cells and osmotic shock agents, used to release proteins from cells, can have adverse cellular effects, reducing responses or increasing variability. Pathogens express pathogen-associated molecular patterns (PAMPs), which are sensed by pattern recognition receptors (PRRs) and trigger innate immune responses. 20 Toll-like receptors (TLRs) represent one of the most widely studied classes of PRRs, and many recognize bacterial components. 21 TLR subtypes use adaptor molecules to elicit a wide range of signaling, 20 with most converging on inflammatory pathways involving NFκB, JNK/p38/AP1, and interferon regulatory factors IRF3, 5, and 7. Lipopolysaccharide or endotoxin (LPS) is specifically recognized by TLR4, signaling via MyD88-dependent and -independent pathways to induce expression of proinflammatory cytokines and interferons. 22 There is also evidence for TLR-independent recognition of LPS, with HSP70/90, CXCR4, and GDF5 also potentially binding LPS. 21 Components in hybridoma supernatant medium, including serum/growth factors, may also affect functional cell assays.
To more fully characterize cell assay tolerance and examine the feasibility of implementing cell assays in early antibody screening cascades, the effects of two commonly used types of HTS antibody sample were systematically tested across a wide range of reporter assays. Unpurified E. coli–derived scFv and hybridoma supernatant samples, together with control medium and buffers, were screened in both agonist and antagonist modes across a broad panel of Life Technologies (Carlsbad, CA) CellSensor pathway reporter cell lines, encompassing a wide range of signaling pathways in a variety of cell types. These assays use stable cell lines expressing the beta-lactamase reporter gene under control of pathway-specific transcriptional response elements in various cell backgrounds. Beta-lactamase reporter technology is well suited for HTS due to its robust, ratiometric fluorescence resonance energy transfer (FRET)–based readout that enables detection of subtle changes in signaling pathways. 23 Here we show that some of these assays are tolerant to crude antibody HTS samples and have the potential to be applied in biologics HTS.
Materials and Methods
Materials
Dulbecco’s modified Eagle’s medium (DMEM), glutamine, and penicillin/streptomycin were from Invitrogen (Paisley, UK); OPI media supplement and azaserine-hypoxanthine were from Sigma (Poole, UK); fetal bovine serum (FBS) was sourced from SAFC Biosciences (Lenexa, KS); and hybridoma cloning factor came from Roche Diagnostics (Mannheim, Germany). All other chemicals were standard analytical grade. For reporter assays, cell culture reagents, media, and LiveBLAzer kits were from Invitrogen (Madison, WI); control agonists were from Sigma or Invitrogen with the exceptions of tazobactam from LKT Laboratories (St. Paul, MN); mWnt3a, TGFb1, and sonic hedgehog from R&D Systems (Minneapolis, MN); doxycycline from MP Biomedicals (Solon, OH); and mitomycin C from Fermentek (Jerusalem, Israel).
HTS Assay Sample Generation
The two representative antibody sample types, control buffers and control medium ( Table 1 ), were produced at MedImmune (Cambridge, UK). Antigens used to generate antibody samples were carefully selected to minimize the likelihood of antibody-specific biological effects in the set of pathway assays chosen, with the aim of focusing more on generic screening conditions.
Description Summary of the Sample Groups Tested
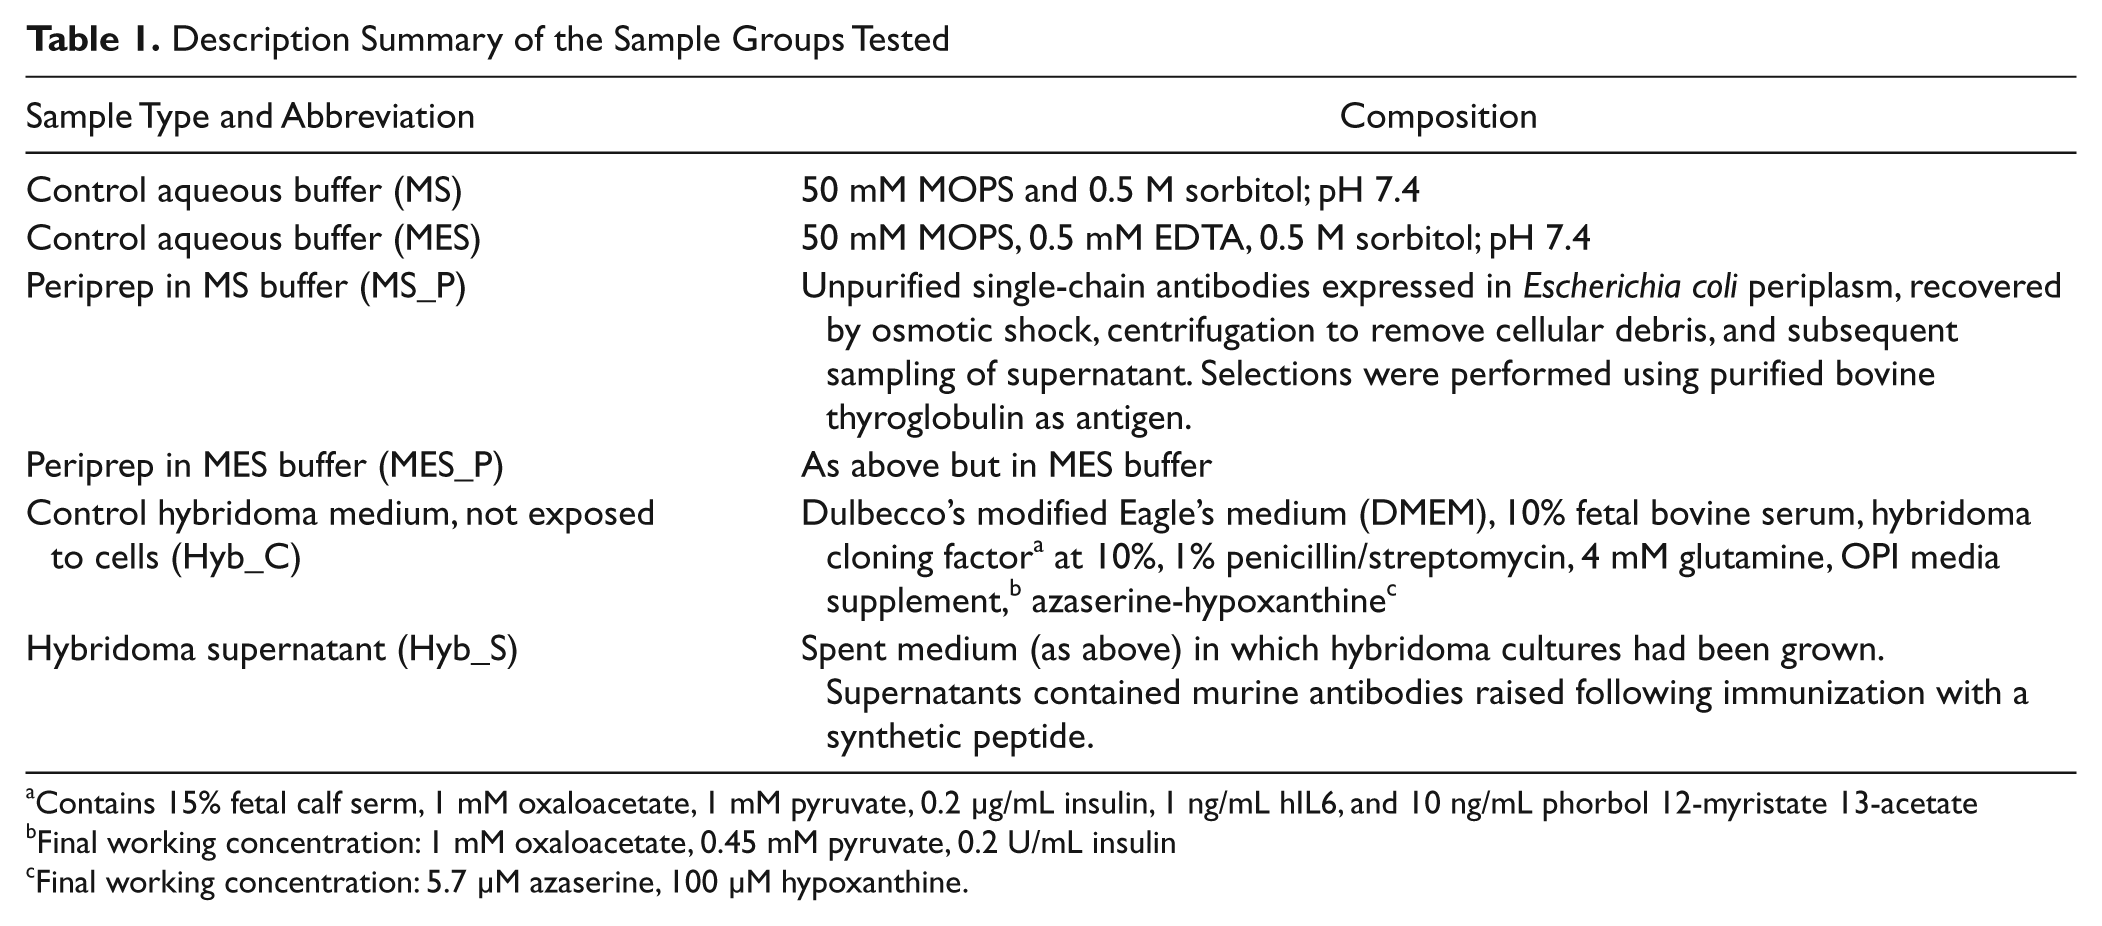
Contains 15% fetal calf serm, 1 mM oxaloacetate, 1 mM pyruvate, 0.2 µg/mL insulin, 1 ng/mL hIL6, and 10 ng/mL phorbol 12-myristate 13-acetate
Final working concentration: 1 mM oxaloacetate, 0.45 mM pyruvate, 0.2 U/mL insulin
Final working concentration: 5.7 µM azaserine, 100 µM hypoxanthine.
In E. coli, the secretion machinery directs proteins with specific signal sequences to the periplasm. Some may also leak into the culture supernatant, with the yield and relative periplasmic/supernatant expression of soluble scFv affected by growth and induction conditions. 10 Here, periplasmic extracts containing unpurified soluble scFvs (peripreps) were prepared from E. coli TG1s using MS or MES osmotic shock buffers ( Table 1 ). ScFv clones had been selected by phage display from antibody libraries using purified bovine thyroglobulin (a secreted thyroid protein). Peripreps were pooled to generate a bulk sample containing a representative array of target-specific single chains. Buffer controls were also examined in parallel.
Hybridoma supernatant samples were generated following a synthetic protein immunization in transgenic mice using a portion of the extracellular domain of a mammalian ion channel; projects that had used cell-based immunizations were avoided. The transgenic mice produce chimeric antibodies with human variable regions and mouse constant regions, 3 and antibody-secreting hybridomas are generated following standard fusion techniques. Control medium and spent medium containing antibodies ( Table 1 ) were both tested.
Reporter Assay Methodology
Cryopreserved, assay-ready banked vials of cells were thawed and resuspended in their designated assay medium (OptiMEM with 0.5% dialyzed FBS; DMEM + GlutaMax with 0.1% dialyzed FBS or OptiMEM with 0.5% newborn calf serum) and plated at 26 µL/well in 384-well plates (typically between 5000 and 25 000 cells/well). Cells were either preplated overnight or on the day of the assay, depending on the cell line. Test samples were thawed at room temperature and the dilution series prepared in the designated assay medium, such that the final volume was normalized for delivering 10 µL/well. Samples were assessed for reporter assay effects over a range of concentrations representative of those that would typically be used in antibody HTS (1% to 25% final), in both agonist and antagonist modes (n = 4 wells/test). During the test sample preincubation (30 min to 2 h), fresh control agonists were prepared at full-stimulation and EC80 concentrations. Control agonists were then applied to designated wells at 4 µL/well, with 4 µL/well of designated assay medium applied to the remaining wells (agonist mode test wells, unstimulated controls, and cell-free controls), giving a final volume of 40 µL/well in a 384-well format. Following 5 to 6 h of assay incubation, 8 µL/well of 6× LiveBLAzer-FRET B/G (Invitrogen) substrate was applied to each well and incubated for 2 to 3 h at room temperature. Plates were read at 460 nm/530 nm emission on a Tecan Safire Tecan (Männedorf, Switzerland).
Data Analysis
Data analysis was performed with Microsoft Excel (Microsoft, Redmond, WA). Background-subtracted fluorescence was first calculated by subtracting mean sample-specific blue or green cell-free control values from the raw blue and green data. Background-subtracted blue data were divided by background-subtracted green data to produce 460/530-nm ratio values. Ratios were then converted to response ratios, normalizing the data by dividing sample blue/green ratios by mean unstimulated cell control values. Data were subsequently expressed as % activation relative to a control agonist or as % inhibition of an EC80 agonist response in antagonist mode.
Two-dimensional hierarchical cluster analysis of the data set was performed to facilitate sample-to-sample, pathway-to-pathway, and cell background-to-background comparisons. This was done using NCSS 2007 software (NCSS LLC, Kaysville, UT) and the group average (unweighted pair-group) linkage algorithm with Euclidean distance.
Results
Reporter Responses and Assay Performance
The panel of cell lines screened was chosen from Life Technologies’ portfolio of CellSensor pathway assays, with the current set encompassing 15 distinct signaling pathways in seven different cell types ( Table 2 ). The widest range of response elements available was in a HEK293 background, and accordingly, the study compared sample effects across nine different pathways in those cells. Where the same response element was available in different backgrounds, including CHO-K1, Jurkat, HEK293T, or ME-180 (CRE in three backgrounds, NFκB in two backgrounds, NFAT in three backgrounds, AP1/c-fos pathways in two backgrounds), the effect of cellular context was also evaluated. Although primarily focused on cells commonly used to make recombinant cell lines such as HEK293 and CHO-K1, the study was extended to include the human epithelial colon cancer cell line HCT116 (three pathways), human epithelial cervical cancer lines HeLa and ME-180 (three pathways), and NIH3T3 mouse fibroblast cells (one pathway). Immune-derived cells, such as monocyte THP-1 and macrophage RAW264.7, were avoided due to a higher likelihood of them expressing PRRs. An exception was 3 Jurkat (human T cell leukemia cell line) reporters used in cellular context comparisons for CRE, NFκB, and NFAT. Two control CMV-bla lines (CHO-K1 and Jurkat backgrounds) were profiled in parallel to identify effects on general transcription, translation, or beta-lactamase enzyme activity.
Description Summary of the Reporter Cell Lines Tested
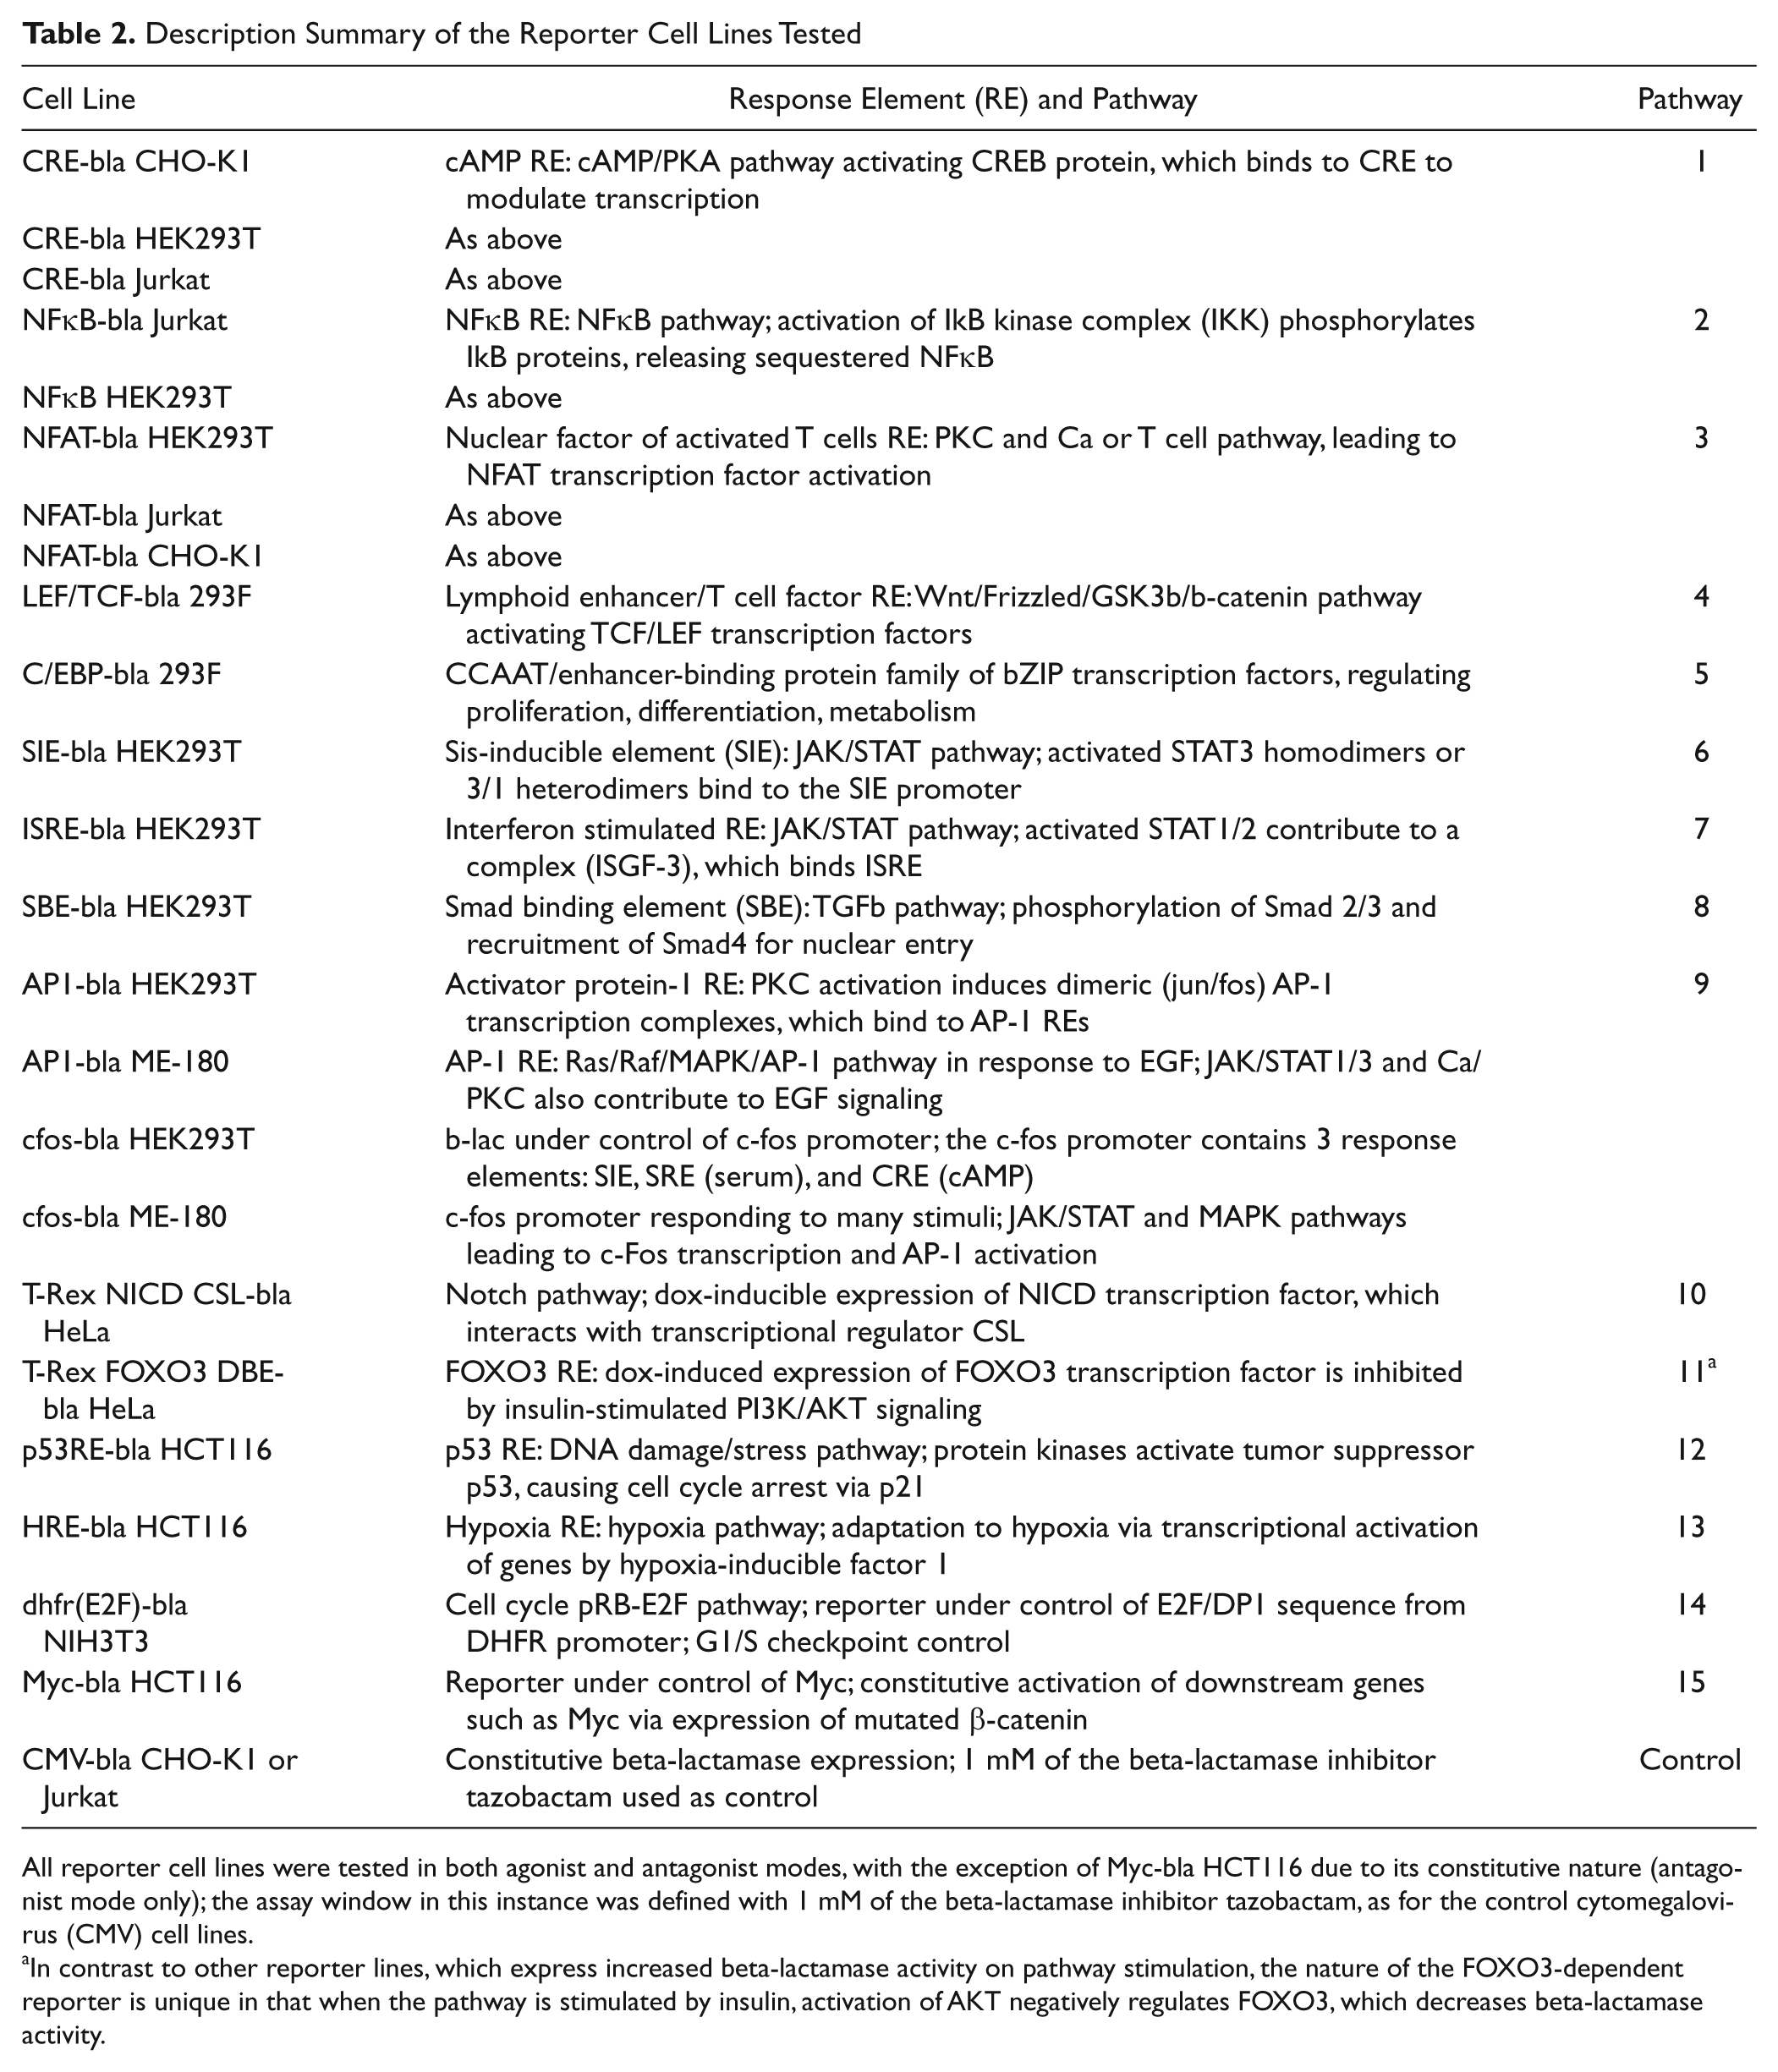
All reporter cell lines were tested in both agonist and antagonist modes, with the exception of
In contrast to other reporter lines, which express increased beta-lactamase activity on pathway stimulation, the nature of the FOXO3-dependent reporter is unique in that when the pathway is stimulated by insulin, activation of AKT negatively regulates FOXO3, which decreases beta-lactamase activity.
Assay windows ranged from 2.5- to 25-fold above basal reporter gene levels (
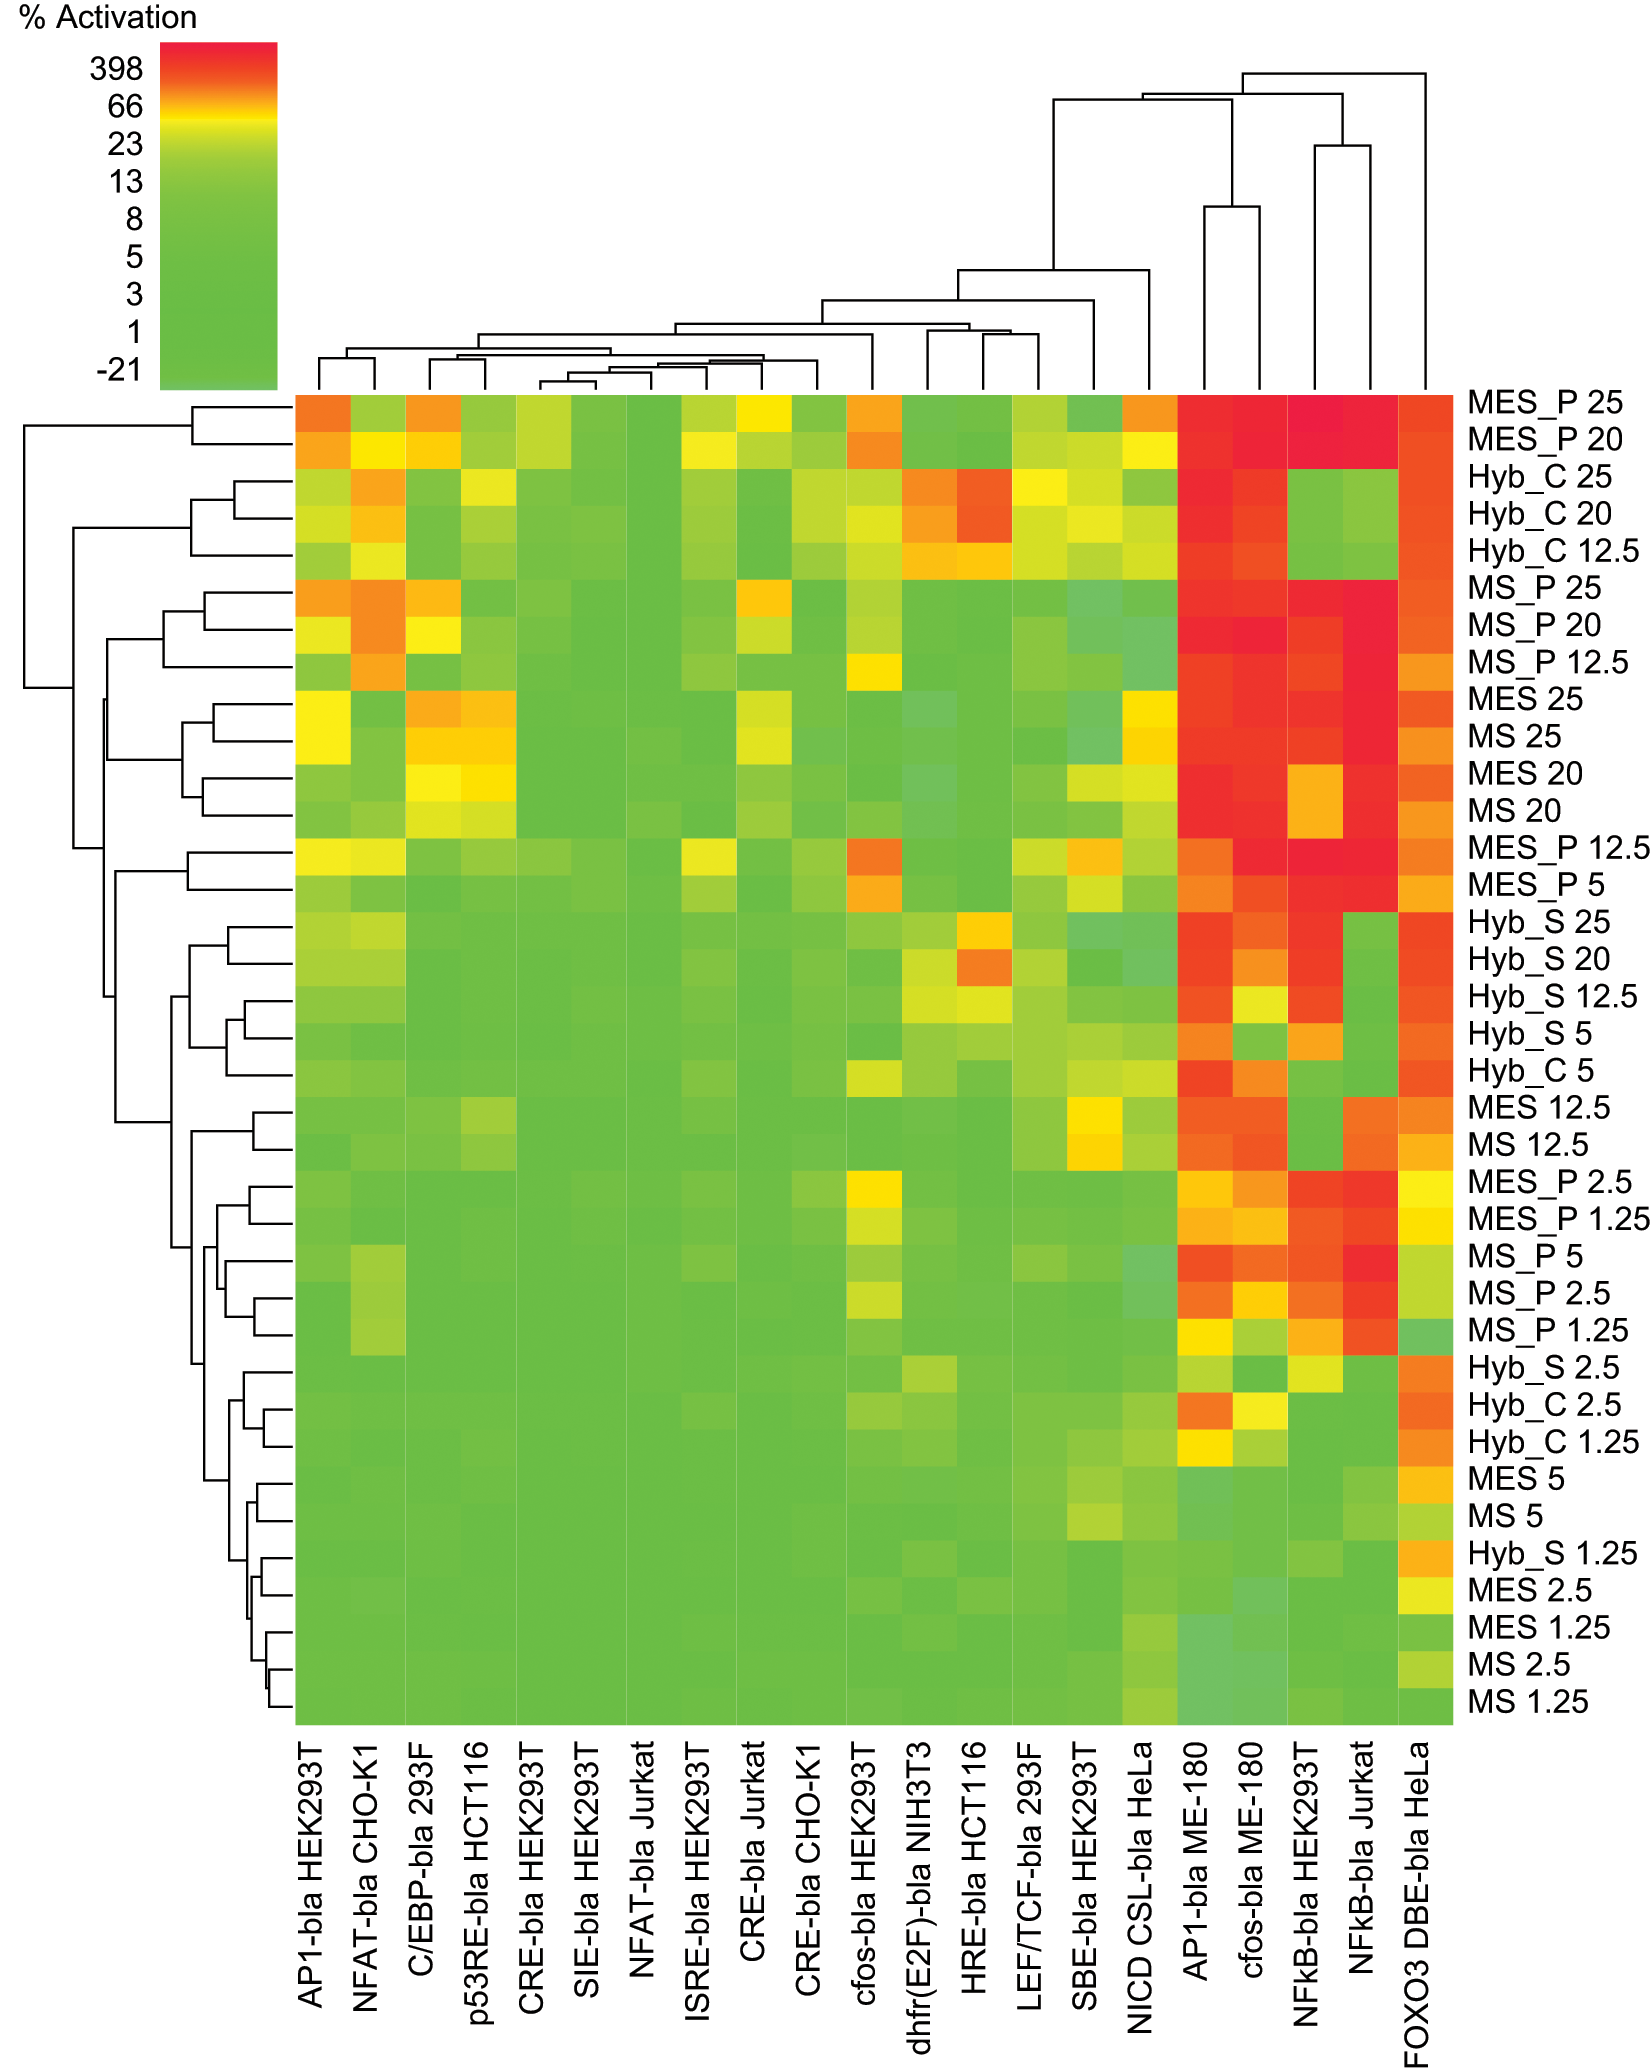
Agonist mode screening, in the basal state with no pathway stimulation, identified assays inherently susceptible to activation by generic antibody sample preparations and/or components of their respective controls. Antagonist mode screening, performed in the activated pathway state with known activators or using constitutively activated assays, was used to identify any inhibitory effects. Since significant activation or inhibition would diminish the potential assayable window, affected assays were flagged as intolerant for screening antibodies generated using the described methods. To help interpret and visualize this complex data set and to analyze patterns in assay tolerance, we performed 2D hierarchical cluster analysis of the data set. A set of heat maps was generated from the % activation or % inhibition normalized data sets ( Figs. 1 and 2 ). These figures show the data sorted by cell background, with sample types grouped together on the y-axis, but no clustering. Two-dimensional hierarchical cluster analysis was then applied, and the clustered data sets are shown in Figures 3 and 4 . In agonist mode ( Fig. 1 ), assays tolerant to the test samples are denoted in green and correspond to a cutoff of <25% activation. Assays exhibiting partial tolerance (25%−50% sample effects) are in yellow or pale orange, whereas intolerant assays are designated dark orange/red (>50% activation). Using these criteria ( Fig. 3 ), 79% of the entire map area was green or relatively unaffected, suggesting most assays were tolerant to most samples in agonist mode. An additional 8% of the map showed partial tolerance and 13% of samples were strongly activating, with assays therefore considered intolerant to those samples.
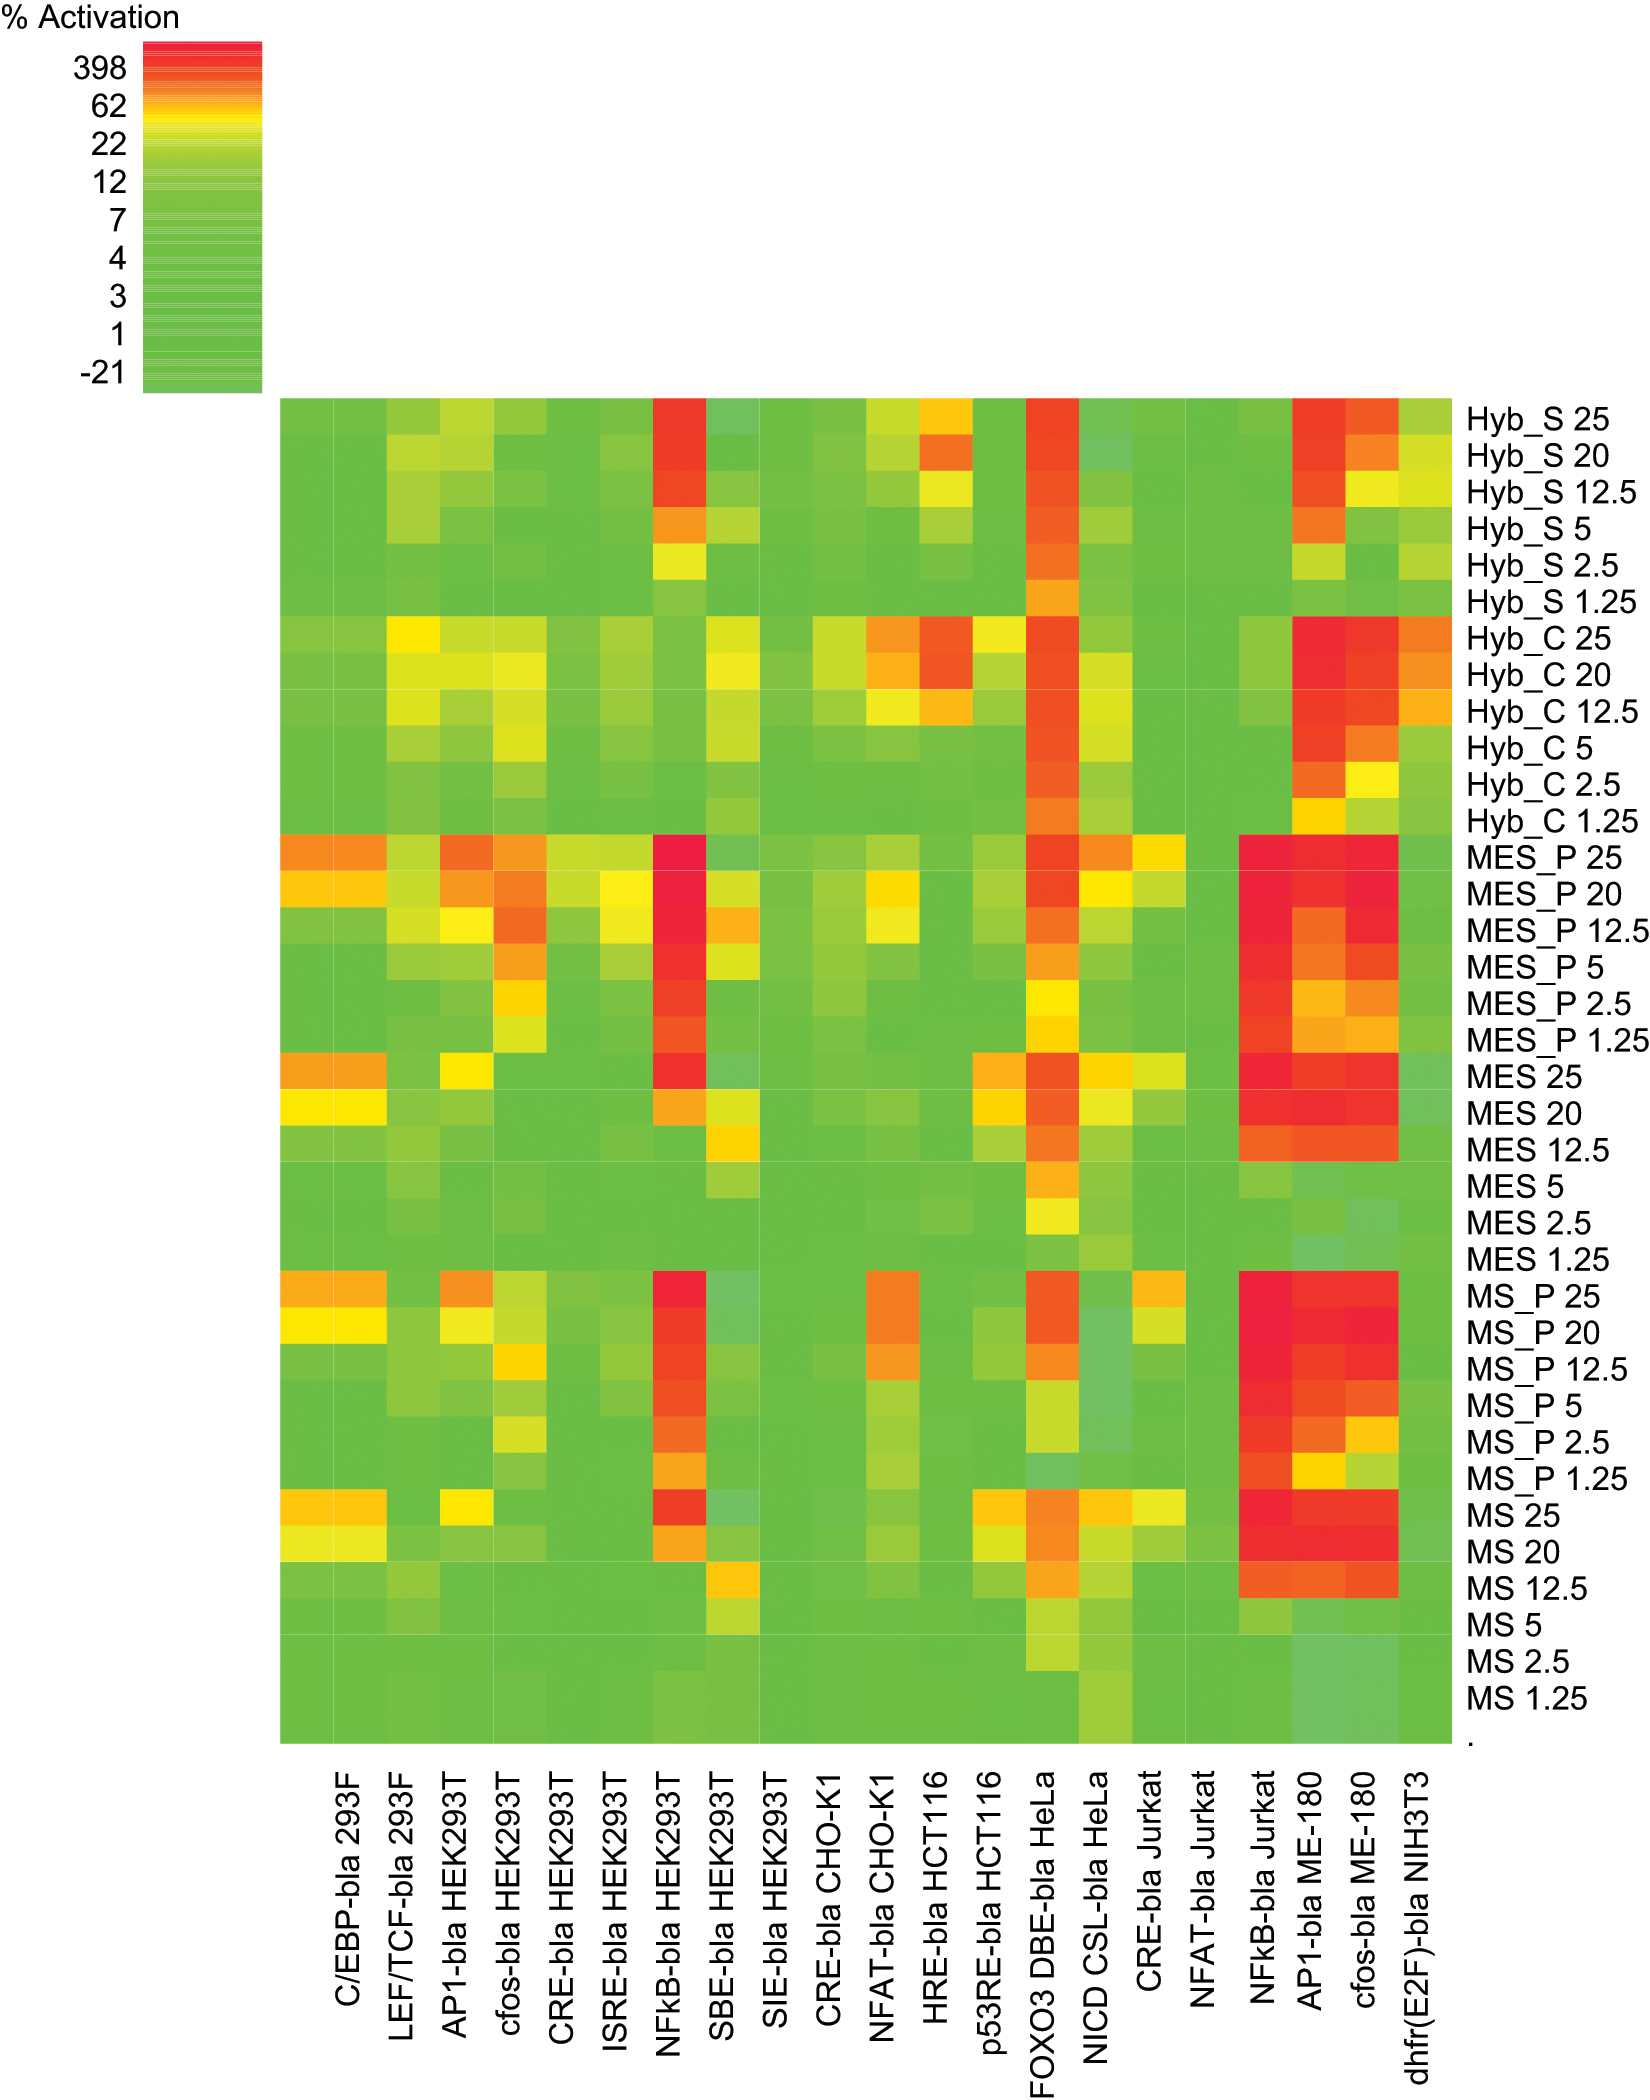
Heat map analysis of the agonist mode data set. Heat map color coding of the % activation is denoted in the upper left-hand corner, with most potent activation colored in red and tolerant assays colored in green (color figure available online).
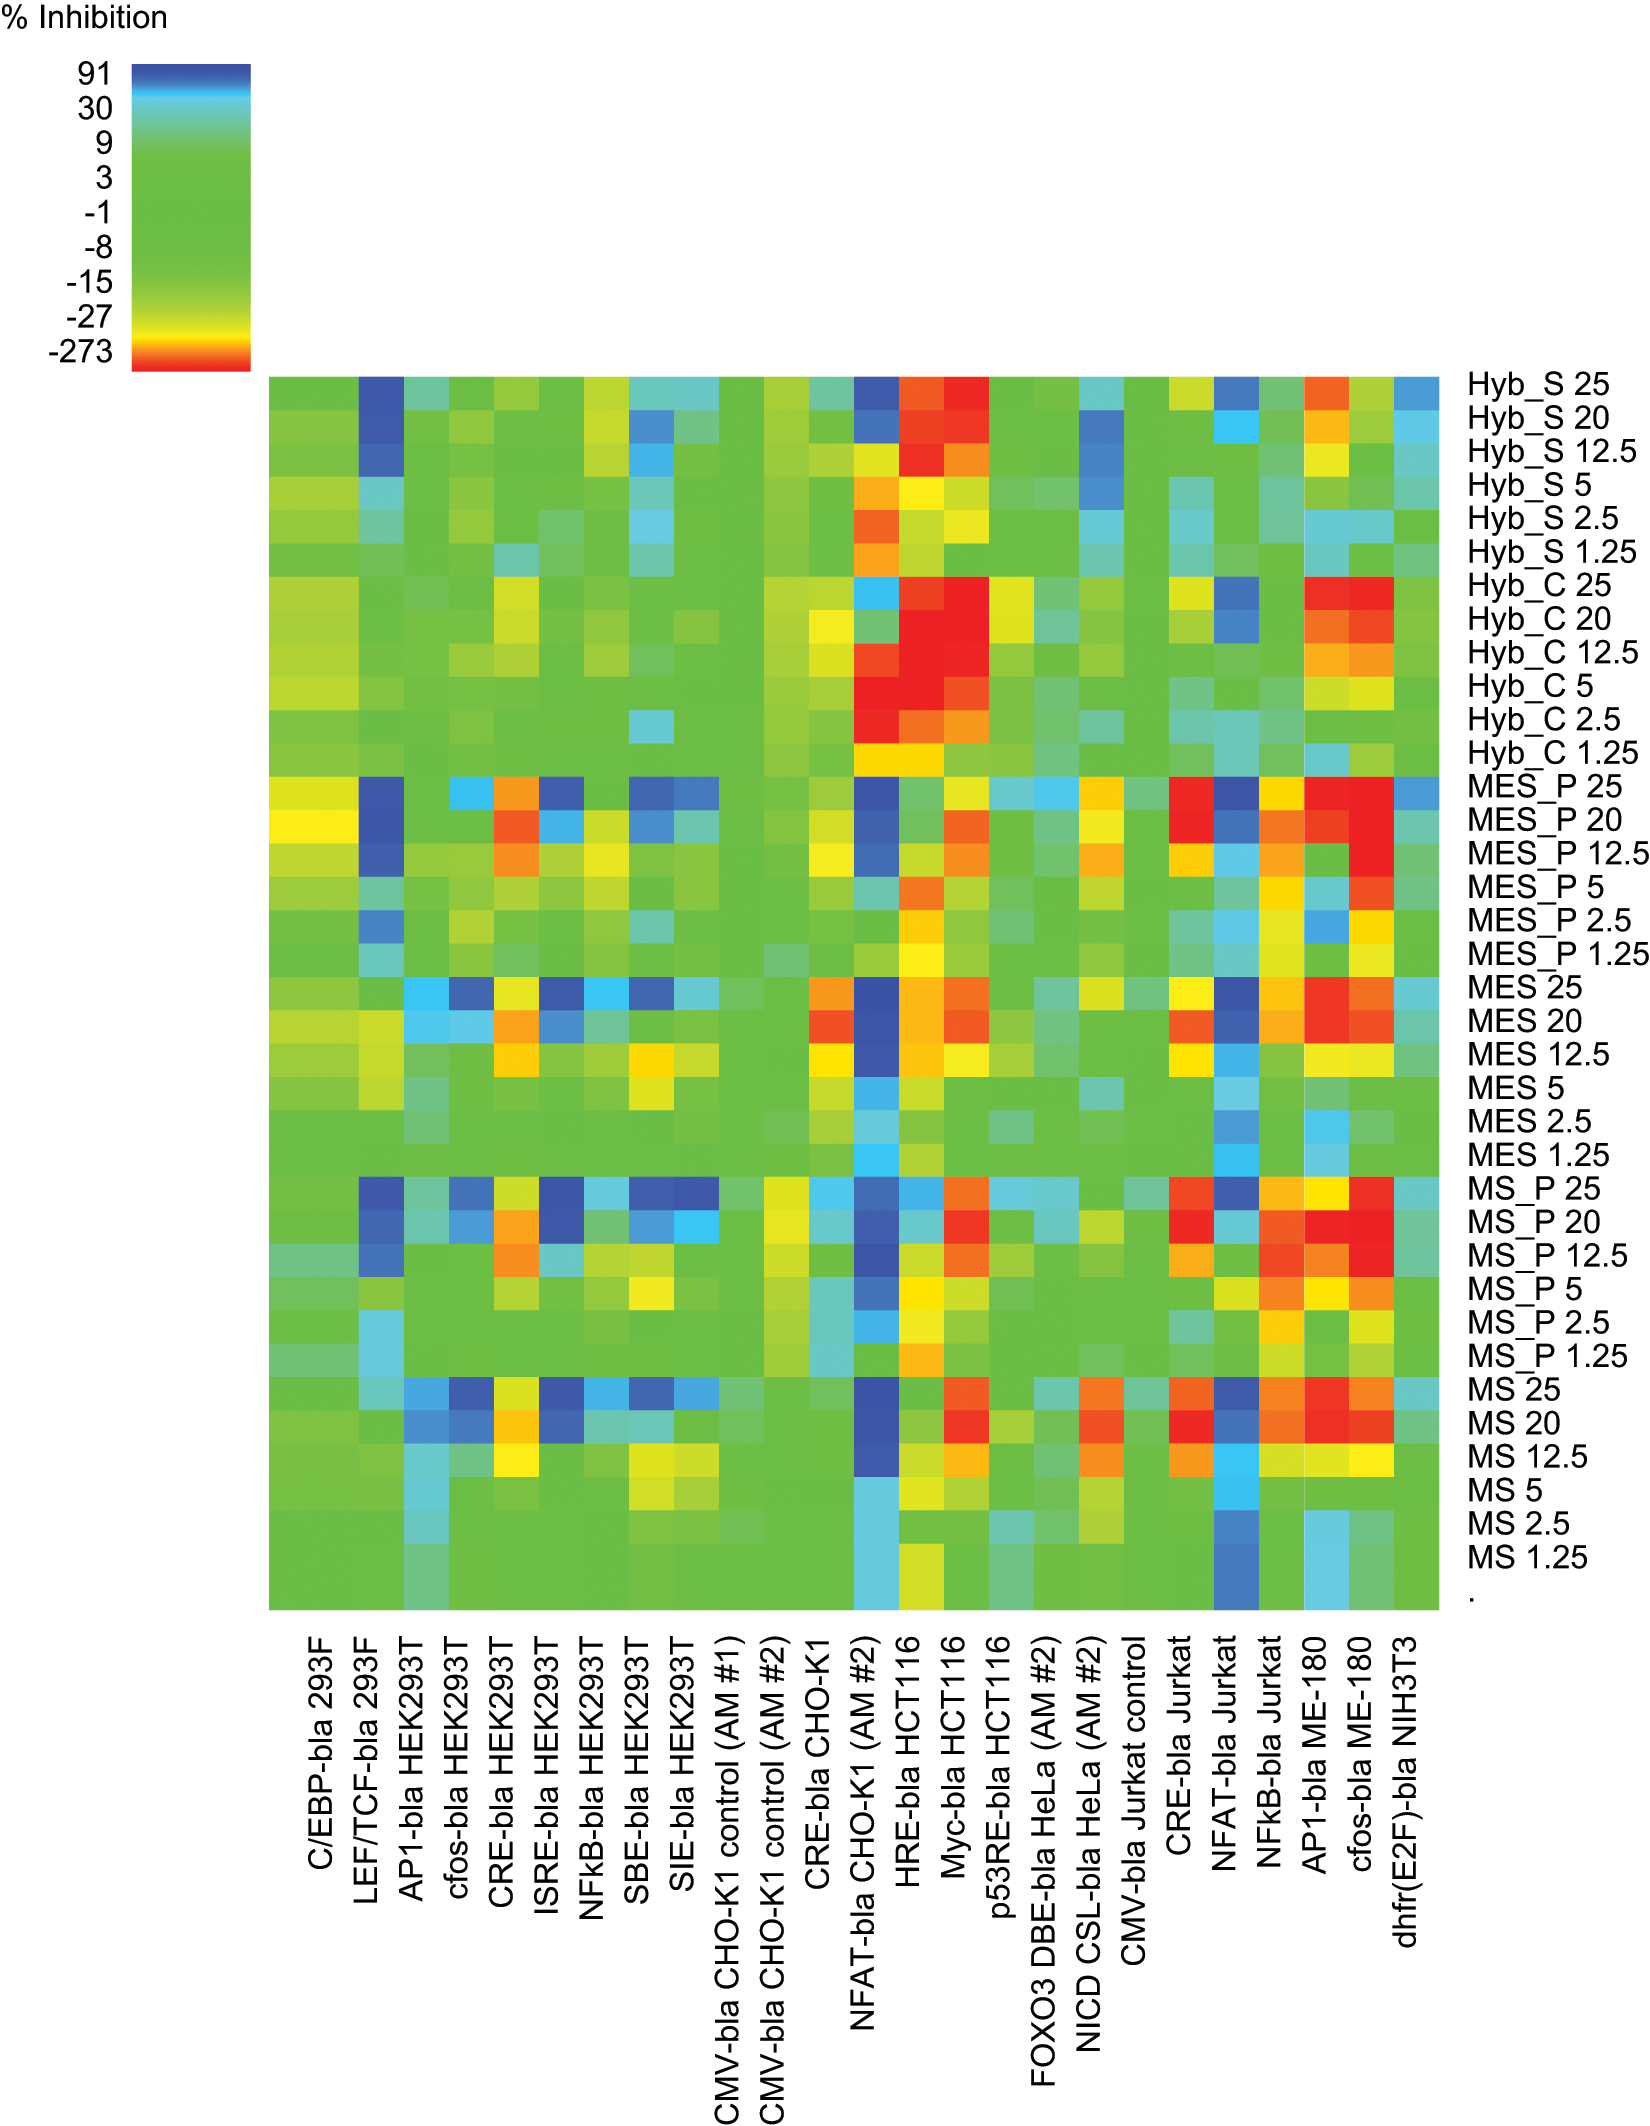
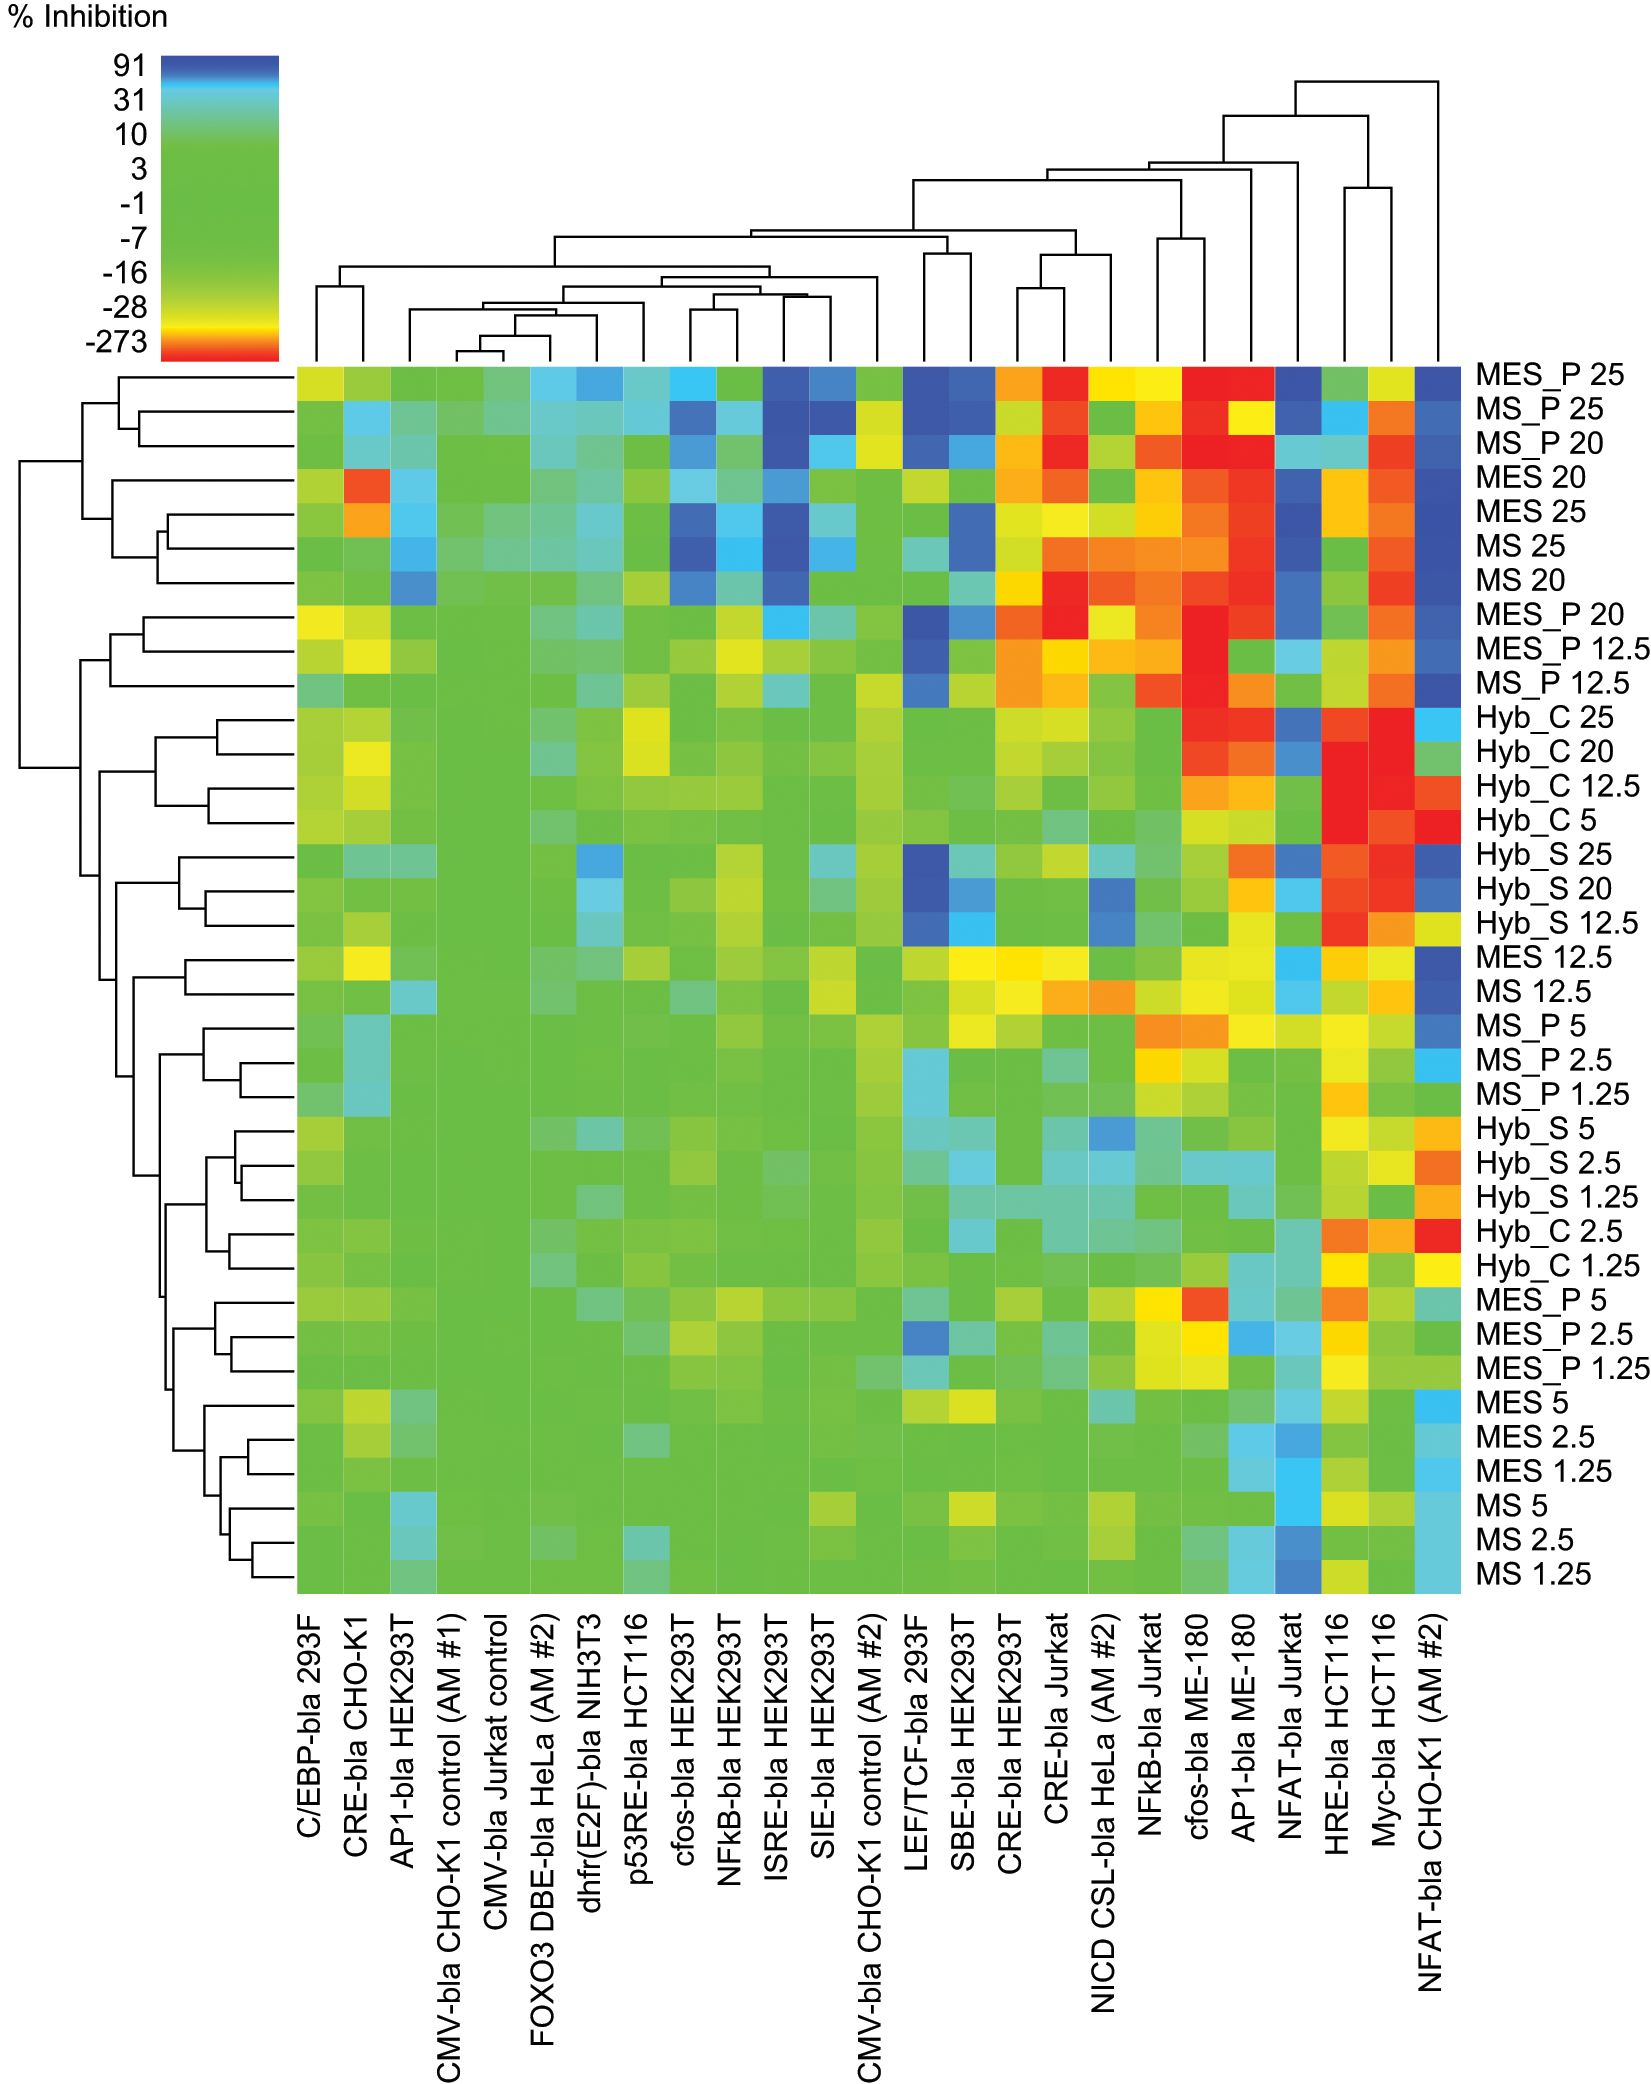
Heat map analysis of the antagonist mode data set. Heat map color coding of % inhibition is denoted in the upper left-hand corner, with most potent inhibition in blues, tolerant assays with green coloration, and potentiation beyond the EC80 agonist response in yellow to red (color figure available online).
Two-dimensional hierarchical cluster analysis of the cell and pathway tolerance profiles for the agonist mode data set. Cluster analysis performed as described in Materials and Methods.
Two-dimensional hierarchical cluster analysis of the cell and pathway tolerance profiles of the antagonist mode data set. Cluster analysis performed as described in Materials and Methods.
Antagonist mode ( Fig. 2 ) is color-coded for tolerance in a similar manner, with greens representing assays that were relatively unaffected. It can be seen, however, that antagonist mode was more complex in that not only inhibitory effects (blues representing reduced tolerance) but also activating effects were detected (yellow to red gradation, as for agonist heat maps). As a result, only 63% of the antagonist heat map was clearly in the tolerant green zone ( Fig. 4 ). Overall, 12% of the heat map displayed inhibition of the EC80 agonist window, with 6.3% exhibiting partial tolerance (25%−50% inhibition, light blues) and 5.4% found to be intolerant (>50% inhibition, dark blues). The remaining 25% of antagonist mode assays exhibited varying degrees of potentiation beyond the EC80 control response, with yellow representing modest activation and red/orange strong activation. Whereas such activation precludes agonist mode screening, screening in antagonist mode could potentially be feasible as long as appropriate controls were included to account for the altered assay baseline. Control CMV-bla CHO-K1 and Jurkat responses were not affected by samples.
Effects of Sample Types on Reporter Responses and Assay Performance, Agonist Mode
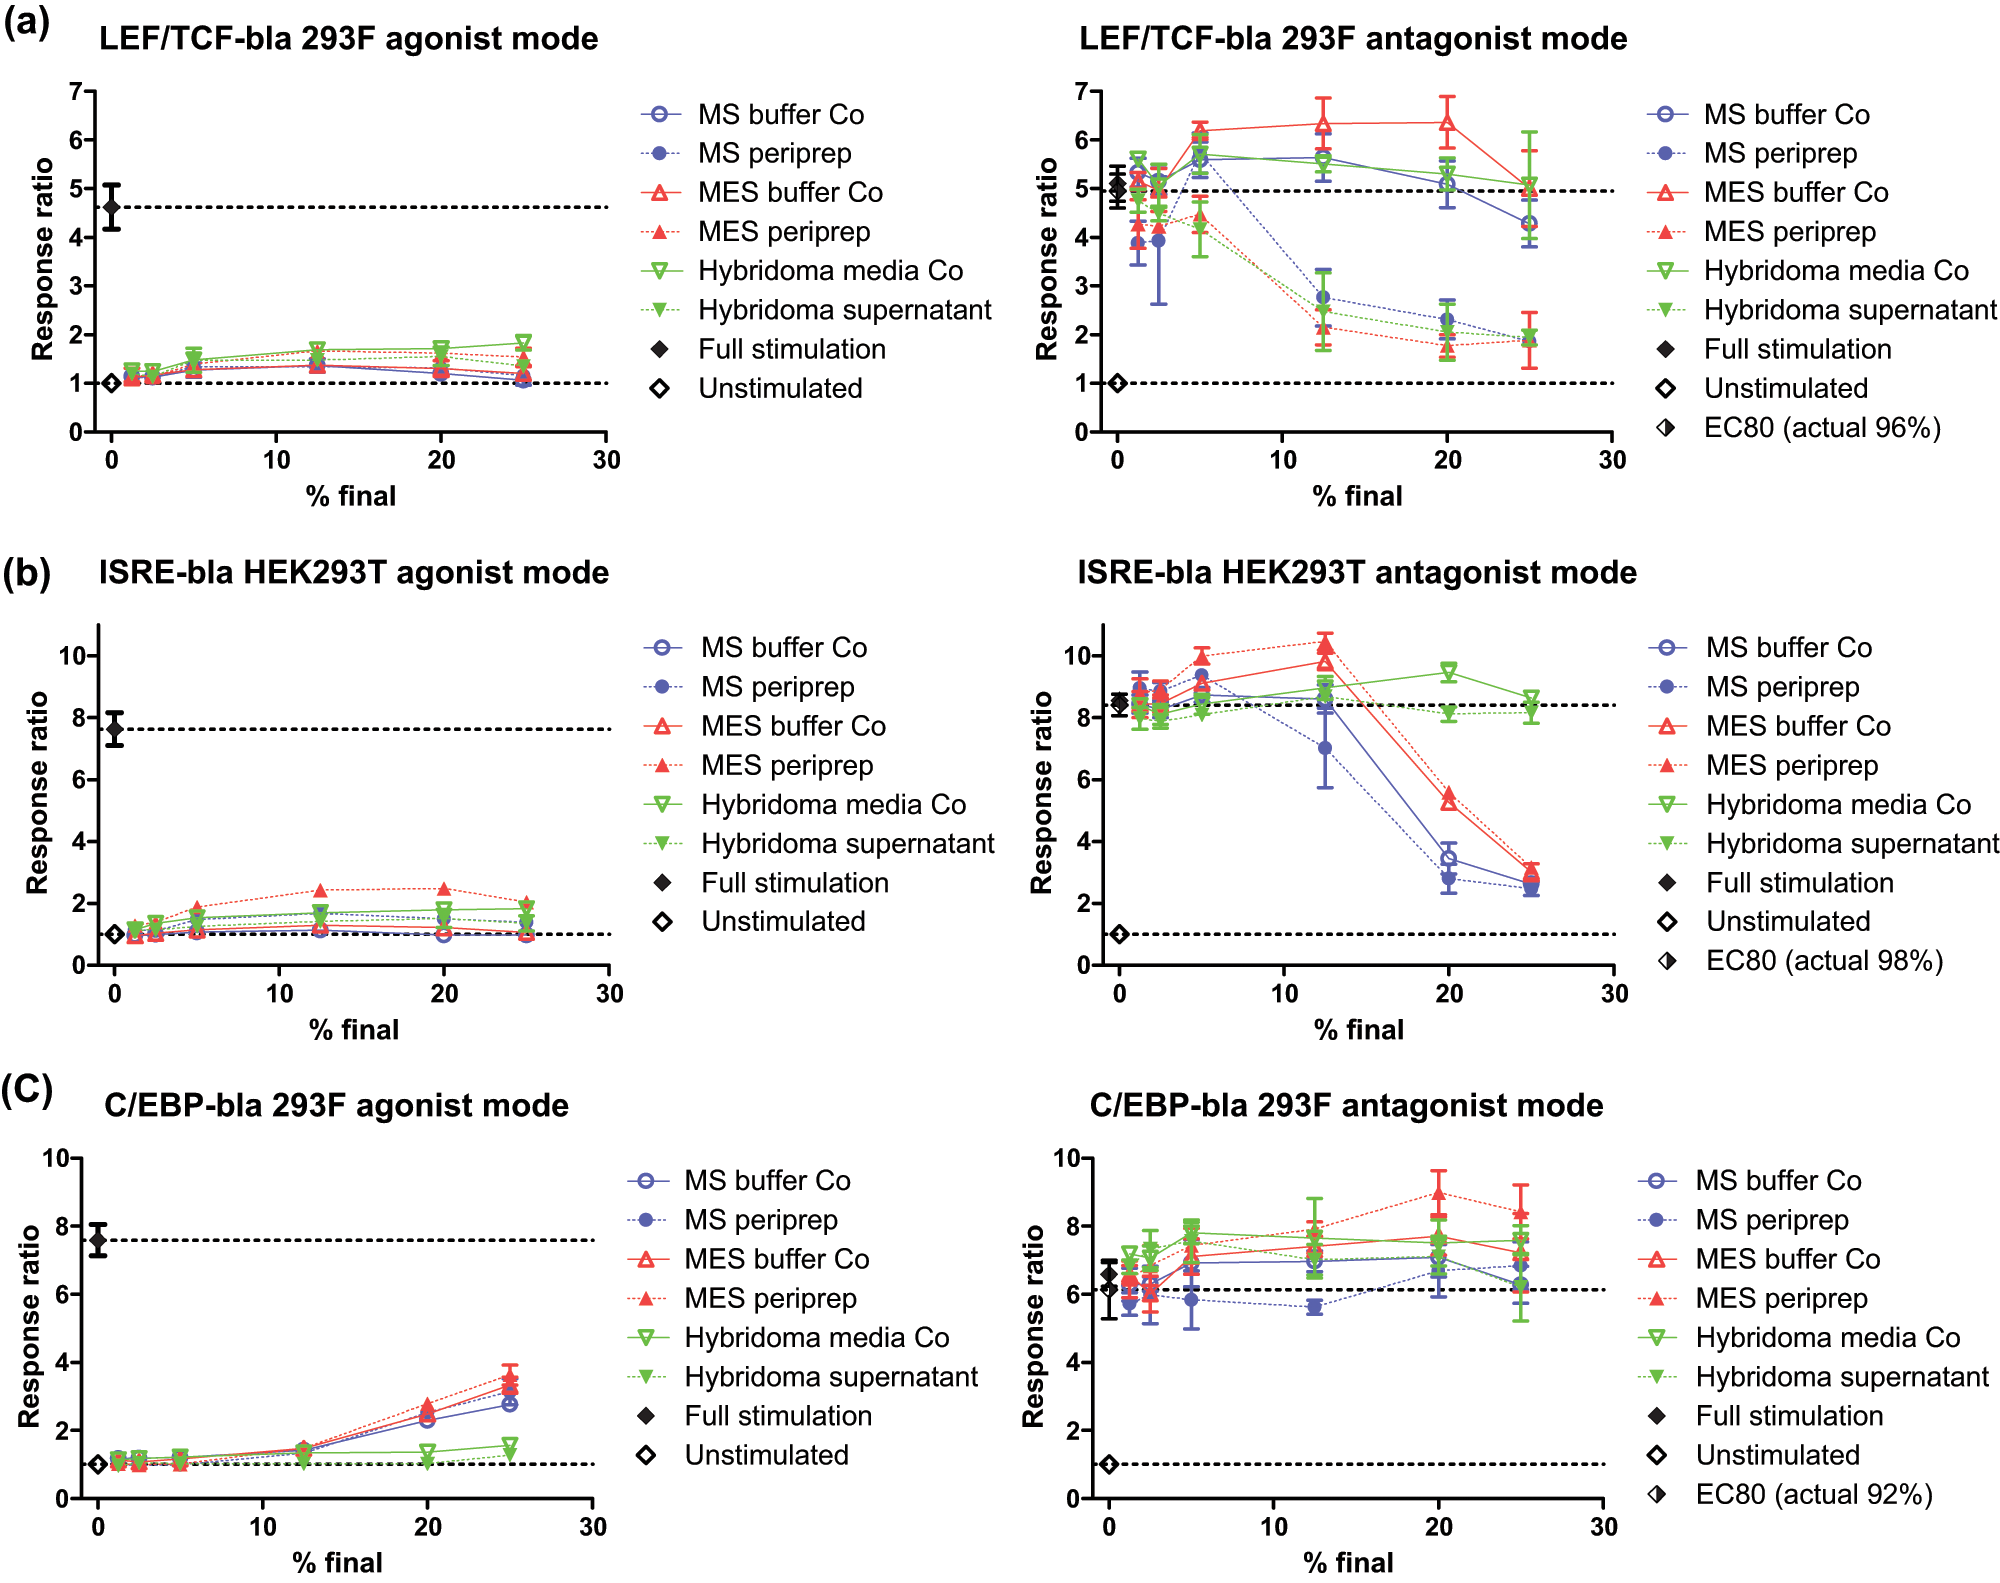
The following reporters were relatively unaffected by any sample in agonist mode: CRE CHO-K1, CRE HEK293T, CRE Jurkat (slight MES/MS periprep effect 24%−29%), NFAT Jurkat, LEF/TCF 293F, SBE HEK293T, and the JAK/STAT assays SIE and ISRE in HEK293T. Cluster analysis indicated sample intolerance was attributed to a small subset of assays. Strong activation was noted for 5 of 21 cell lines: FOXO3 DBE HeLa, AP1 ME-180, c-fos ME-180, NFκB HEK293T, and NFκB Jurkat (
Fig. 3
), with the first three strongly affected by all samples. For NFκB, a difference was noted between the two cell backgrounds, with Jurkat activated solely by MS/MES samples (peripreps > buffers), whereas in HEK293T, agonism also was seen with hybridoma supernatant but not medium (
Closer examination of the affected assays identified both pathway and cell background–specific effects. The FOXO3 pathway in HeLa cells was the most overall affected in that all sample types had significant agonist effects with the exception of the lowest MS/MES buffer concentrations (≤5% final concentration). Regarding cell background influences, there was a pronounced difference in sample effects on the related MAPK pathway reporters AP1 and c-fos in ME-180 versus HEK293T cells. There was strong activation by all sample types in the context of an ME-180 background but to a much lesser extent, and by peripreps only, in the HEK293T background (
Effects of Sample Types on Reporter Responses and Assay Performance, Antagonist Mode
Detailed examination of the antagonist heat map indicated a number of tolerant cell lines, relatively unaffected by any sample: C/EBP 293F, FOXO3 HeLa, p53 HCT116, CMV CHO-K1, and CMV Jurkat. Cluster analysis was also used to compare the 24 antagonist mode assays, which were complicated by both inhibitory and activating effects. At the overview level, cluster analysis identified a large region in the data set that, with a few exceptions (e.g., LEF/TCF 293F) was relatively unaffected by test samples ( Fig. 4 , area below the MS_P 12.5 row for cell lines C/EBP 293F to NFκB Jurkat, left to right). The remaining cell lines to the right corresponded to a clustered subset of six assays affected by most sample types, whereas the area above the unaffected region corresponded to the clustered set of high concentration MS/MES peripreps and buffers, giving the most pronounced overall inhibition or activation. Since sorbitol is the predominant component of these buffers by molar concentration and is a known stressor, these effects may be attributable to the presence of sorbitol.
Nine cell lines showed a degree of strong inhibition (dark blue squares), typically at higher sample concentrations. MS/MES sample sets caused inhibition in eight of the cell lines tested and the hybridoma sample set in five (
Fig. 2
). Four reporters—NFAT CHO-K1, NFAT Jurkat, LEF/TCF 293F, and SBE HEK293T—were inhibited by all sample groups. Another four reporters were inhibited by the MS/MES sample sets only (AP1 HEK293T, c-fos HEK293T, ISRE HEK293T, and SIE HEK293T), and one was inhibited to a variable extent by hybridoma supernatant only (NICD HeLa). NFκB HEK293T was also selectively, but more modestly, inhibited by MS/MES samples. The assays most affected by strong inhibition in antagonist mode were NFAT CHO-K1 and NFAT Jurkat (
Full data for the (
In addition to inhibitory effects, further activation beyond EC80 was also noted in antagonist mode. This strong potentiation is denoted in red or dark orange in Figure 2 and generally affected a different subset of assays to those that showed inhibition. One exception, with mixed responses, was NFAT CHO-K1, where hybridoma samples potentiated at low doses but inhibited at >12.5%, whereas MS/MES sample sets were all strongly inhibitory, as above. Up to 10 assays showed some red coloration, with most clustering in the top right of the heat map, representing higher sample concentrations ( Fig. 4 ).
Three reporters were potentiated by all sample groups in antagonist mode (
Fig. 2
): AP1 and c-fos were strongly potentiated beyond EC80 in the ME-180 background, mirroring the strong activation seen in agonist mode in these cells and contrasting with the parallel HEK293T background where MS/MES sample sets became inhibitory (
Discussion
The study identified three principal influences on reporter responses: bacterial component, osmotic stress, and serum/growth factor effects. The first two are represented in the MS/MES sample set and the third in the hybridoma set, which overall was better tolerated. In addition to assays with clear sample tolerance, potential to implement additional assays was also identified. In addition to the eight tolerant agonist assays, NFκB Jurkat, C/EBP 293F, and AP1/c-fos HEK293T could also be implemented if run with hybridoma samples, whereas dhfr(E2F) NIH3T3 and HRE HCT116 could be used with MS/MES. There is also potential to run NICD CSL HeLa and p53 HCT116 with hybridoma, bringing potentially tolerant agonist assays to 16 of 21 (76%). Five assays were classed as intolerant: FOXO3 DBE HeLa, AP1 and c-fos in ME-180, NFκB HEK293T, with NFAT CHO-K1 also problematic due to some activation by both sample types. In addition to five tolerant antagonist assays, a further seven could be implemented by focusing on hybridoma samples (NFκB Jurkat, NFκB HEK293T, SIE/ISRE HEK293T, AP1/c-fos HEK293T) or MS/MES samples (NICD HeLa). The three CRE reporters and Myc could also be used if potentiation and altered baseline were taken into account, bringing tolerant antagonist assays to 16 of 24 (67%). HRE was more challenging with a trend toward inhibition by peripreps and significant hybridoma potentiation. Five antagonist assays were classed as intolerant (NFAT Jurkat, NFAT CHO-K1, LEF/TCF 293F, SBE HEK293T, dhfr(E2F) NIH3T3) due to some inhibition by both sample types.
For intolerant assays, there is clearly a spectrum of activity. Of intolerant assays listed above, agonist mode NFAT CHO-K1 retained around 50% window at 25% sample, whereas antagonist mode dhfr(E2F) and SBE offer some potential for HTS. For the others, activation/inhibition was quite pronounced at useful screening concentrations (10%−25%). The utility of these assay hinges not just on a residual window but whether additional modulation of response by antibody would be observed beyond that elicited by matrix components. This could depend on the signaling pathway, the required profile of the antibody (antireceptor agonist or antagonist, or ligand-modulating antibody), and the potential for cross-talk, synergy, or amplification in the pathway itself. The risks are that some leads may be missed or false positives identified.
The most affected agonist assay was FOXO3, which reports downstream of the PI3K/AKT pathway, well known to be modulated by serum/growth factors25, 26 and stress, 27 including hyperosmotic shock. In antagonist mode, it was one of the least affected, which may be partly explained by its unique nature, where in the presence of the PI3K/AKT pathway agonist insulin, the FOXO3 reporter is inactivated. This renders it less sensitive in antagonist mode than assays either constitutively “on” or activated by their control agonists. NFκB and response elements in ME-180 cells were also subject to strong activation. ME-180 cells seemed hypersensitive to effects of all samples, and a general recommendation would be to avoid this background. Reasons for the hyperresponsiveness are not clear, but the MAPK pathway in AP1 ME-180s can be stimulated by a wide variety of ligands and receptors. 28
NFκB is pivotal in orchestrating bacterial pattern recognition responses, evidenced here by strong periprep-induced NFκB activation. TLRs can also activate the AP1 and IRF families of transcription factors,20,22,29 and here, the AP1/c-fos HEK293T reporters were activated by peripreps. Effects of LPS on STAT transcription factors 21 and the C/EBP family of basic leucine zipper transcription factors (e.g., C/EBPβ/δ 30 ) have also been reported. Here, C/EBP was preferentially activated by MS/MES sample sets, although less dramatically than NFκB, but interestingly to an equivalent extent by buffers and peripreps, suggesting a sorbitol effect. Conversely, JAK/STAT reporters (ISRE /SIE) were unaffected by any sample in agonist mode, although in antagonist mode, ISRE was strongly inhibited, and SIE more weakly, by peripreps and control buffers equally, suggesting a sorbitol sensitivity. Sorbitol can also affect MAPK/AP1 signaling. Sorbitol- or sucrose-induced hyperosmotic stress stimulates p38 MAP kinase, with prolonged exposure activating SAPK/JNK, 31 leading to activation of the AP1 transcription complex. 32 Here greater activation of AP1 and c-fos was observed with peripreps than with their buffers, although conversely in antagonist mode, inhibitory effects were seen in the HEK background, which were more pronounced with buffers. AP1 and c-fos effects thus appear to reflect a complex interplay between bacterial components and sorbitol.
For NFκB assays in both Jurkat and HEK293T, lower control full stimulation was noted in agonist versus antagonist mode (3.63 vs. 8.04 and 5.13 vs. 23.75, respectively). The two modes were run on different days and may mean that sample effects in agonist mode were overestimated due to low control responses. However, agonism is still significant even if the full stimulation from antagonist mode is transposed onto agonist graphs, although this then makes HEK293T appear comparatively less strongly activated than Jurkat. Although strong activation of NFκB by MS/MES samples was expected, particularly in Jurkat, additional agonism by hybridoma supernatant in HEK293T versus Jurkat was unusual and requires further investigation; none of the other reporters in 293F or 293T exhibited significant activation in response to hybridoma supernatant. The fact that some general activation of NFκB also occurred with control buffers also suggests a sorbitol effect.
For the two cell lines selectively stimulated by hybridoma samples, HRE HCT116 and dhfr(E2F) NIH3T3, results are likely explained by serum/growth factor effects. Serum activation of the hypoxia reporter has been previously reported in HRE HCT116 cells 26 and also for the cell cycle reporter dhfr(E2F). 33 In antagonist mode, a marked hybridoma-specific potentiation of the EC80 response to deferoxamine was observed in the HRE HCT116 reporter but not in serum-stimulated dhfr(E2F) NIH3T3, suggesting synergy between serum and deferoxamine, an iron chelator that stabilises HIF1α by inhibiting its degradation.
Most affected by strong inhibition in antagonist mode were the NFAT reporters, inhibited by all samples except for potentiation by low concentrations of hybridoma sample. The robustness of the latter effect needs to be further evaluated following this preliminary screen. In agonist mode, there was little or only modest activation of NFAT. Effects of sorbitol on Ca2+, 34 protein kinases, and Rho-GTPases have been reported, 32 with hyperosmotic stress inducing Ca2+ release from thapsigargin-sensitive intracellular stores. 34 Dose-dependent depletion of Ca2+ stores by test sample preincubation could thus reduce thapsigargin’s subsequent ability to release Ca2+ and drive NFAT signaling. Apart from NFAT assays, one striking thing about antagonist mode was the number of cell lines showing selective inhibition by the MS/MES sample set: NFκB HEK293T (strong activation in agonist mode), SIE HEK293T, ISRE HEK293T, SBE HEK293T (clean in agonist mode), AP1 HEK293T, and c-fos HEK293T (some activation in agonist mode). This may imply that sorbitol causes changes that affect subsequent responses to the pathway agonist.
With regard to antagonist mode potentiation, the enhanced Myc activation, most pronounced with hybridoma samples, is likely due to serum stimulation of upstream mitogenic pathways such as MAPK/ERK/PI3K. The c-myc promoter contains sites for E2F transcription factor binding, which increases in response to serum. 35 Potentiation of CRE reporters in antagonist mode, typically more pronounced with MS/MES samples, was unusual in that agonist activation was negligible. This suggests that antagonist potentiation may be due to nonspecific synergistic effects with forskolin rather than direct cAMP/PKA activation. For example, stimulation of Ca2+ release by sorbitol 34 has the potential to activate multiple protein kinases, which could potentially synergize with the direct elevation of cAMP by forskolin.
In general, the pathway tended to influence sample responses more than the cell background. For CRE, samples behaved similarly across all three cell backgrounds in both modes, whereas for NFAT, no activation (Jurkat) or modest activation (CHO-K1) in agonist mode became strong inhibition for all samples in antagonist mode, although the hybridoma sample set was tolerated marginally better. Notable exceptions of cell background influencing observed pathway sample effects were NFκB in Jurkat versus HEK293T and the AP1/c-fos pathway in HEK293T versus ME-180. In the former, HEK293T but not Jurkat were affected by hybridoma supernatant in agonist mode, whereas in antagonist mode, MS/MES potentiation in Jurkat became inhibition in HEK293T. For AP1/c-fos there was a marked difference in agonist mode activation between ME-180 and HEK293T, and in antagonist mode, ME-180 were further potentiated by MS/MES, whereas HEK293T were inhibited.
In addition to the principal influences on reporter responses identified here, a variety of other interactions are possible, including known pathway effects, nonspecific effects on transcription/translation affecting reporter activity, and pathway cross-talk. Agonist mode was generally less affected, with 79% of the heat map in the tolerant zone, reduced to 63% for antagonist mode. The latter also exhibited greater response variety, unsurprising given the potential for both direct potentiation or inhibition of agonist and indirect effects on signaling cascades. In general, different subsets of assays were affected in agonist versus antagonist mode, although there was some overlap in the agonist mode activation and antagonist mode potentiation. This study is a useful initial screen of reporter assay tolerance to antibody HTS samples and clearly demonstrates the potential to use cell-based reporter assays. Consideration of sample type or method of antibody production, in the context of the required assay mode, could further facilitate implementation of these assays.
Footnotes
Declaration of Conflicting Interests
The authors declared no potential conflicts of interest with respect to the research, authorship, and/or publication of this article.
Funding
The authors received no financial support for the research, authorship, and/or publication of this article.
References
Supplementary Material
Please find the following supplemental material available below.
For Open Access articles published under a Creative Commons License, all supplemental material carries the same license as the article it is associated with.
For non-Open Access articles published, all supplemental material carries a non-exclusive license, and permission requests for re-use of supplemental material or any part of supplemental material shall be sent directly to the copyright owner as specified in the copyright notice associated with the article.