
Abstract
A severe drawback in the high-throughput screening (HTS) process is the unintentional (random) presence of false positives and negatives. Their rates depend, among others, on the screening process being applied and the target class. Although false positives can be sorted out in subsequent process steps, their occurrence can lead to increased project cost. More fundamentally, it is not possible to rescue false nonhits. In this article, we investigate the prediction of the primary hit rate, hit confirmation rate, and false-positive and false-negative rates. Results for approximately 2800 compounds are considered that are tested as a pilot screen ahead of the primary screening work. This pilot screen is done at several concentrations and in replicates. The rates are predicted as a function of the proposed hit threshold by having the replicates serve as each other’s confirmers, and confidence limits to the prediction are attached by means of a resampling scheme. A comparison of the rates resulting from the resampling with the primary hit rate and the confirmation rates obtained during the screening campaign shows how accurate this method is. Hence, the “optimal” compound concentration for the screen as well as the optimal hit threshold corresponding to low false rates can be determined prior to starting the subsequent screening campaign.
Keywords
Introduction
In the past decade, screening of large compound collections has gained a very high importance in the pharmaceutical industry. Today screening is an essential step in the drug discovery process. The goal is to find among many hundreds of thousands of molecules those few that show an activity against a given target. This process requires strong expertise in many scientific areas, particularly the conception and design of robust biological systems, their automation, and the subsequent data analysis.
Because measurements are subject to random errors, the true but unknown activity of compounds is masked by unwanted effects and cannot always be determined with satisfactory accuracy. Depending on the extent to which noise influences the measurements, two kinds of errors are observed. Type I errors occur where inactive compounds are identified as hits. These falsely classified hits are called false positives. Conversely classifying actually active compounds as inactives is known as type II error (false negatives).
Many studies on the field of assay quality and hit selection procedures have appeared in the past years.1-6 Probably the most frequently used criterion for assessing the quality of assays was introduced by Zhang et al. 1 On the basis of the Gaussian distribution of the positive and negative controls, the authors defined a statistical measure called Z′, which reflects the assay separation window and the variability. Sui and Wu 2 went on to establish a link between high Z′ values and the power of identifying (actually) active compounds by means of (true) hits. A hit selection method based on structural clustering techniques was described in Gagarin et al. 3 The hit confirmation rate as a quality criterion for the hit selection procedure and the assay was discussed extensively in the literature. For instance, Zhang et al. 4 showed that under some assumptions (including Gaussian distribution of the measurement errors and a constant standard deviation on the whole activity range), the lower limit for the confirmation rate is 50%.
This article describes the benefit of having access to primary hit rate and confirmed hit rate information prior to starting the primary screening process within a project.
Materials and Methods
Running a Pilot Screen
Prior to starting the primary screen of a compound library, it is a routine to conduct a pilot campaign beforehand. A structurally representative subset of the screening library is tested in replicates at one or many fixed compounds concentrations. The purpose is to determine the compound concentration appropriate for the screen and to gain information on the prospective hit rate. A high compound concentration may result in a too large number of hits for the subsequent project phases and considered a flawed experiment. The analysis of the results from the pilot screen can be expanded by taking the compound structures into consideration. A relationship between compound structure and potential issues such as aqueous solubility can be observed, quantified, and potentially rectified ahead of the screen.
The results presented in this article are based on the routine measurement of approximately 2800 representative lead-like compounds in several assays. This represents roughly 1% of the compounds we typically apply during primary screening, per project and target.
Hit Selection Strategy
Throughout this article, the assay response is normalized with respect to positive and negative controls. This yields normalized assay signal values (% inhibition or % activation) in the range between 0% (no activity) and 100% (full activity).
Besides compound, positive, and negative controls, DMSO wells (sample negative controls) are distributed uniformly on each assay plate. They undergo the same process steps as the compounds. Therefore, they can be thought of as additional controls for the assay performance. In many studies on hit selection and plate pattern correction (see, e.g., Brideau et al. 5 ), it is assumed that most compounds on an assay plate are not active. Computations of location and scale parameters are conducted by means of robust statistics (median and median absolute deviation) to eliminate the effect of outliers. This assumption may fail to be valid, for instance, in the case of focused libraries on 96-well assay plates, where a high concentration of active molecules on the plate and hence a high hit rate are expected. Furthermore, there is some circular dependency. In fact, the compound results are used to compute the location and scale parameters, which are again used to classify the same compounds as active or nonactive. To overcome this problem, the hit threshold was calculated by means of the “k sigma” method (k standard deviations away from the mean) using the normalized assay signal results of the sample negative control. Because they contain all assay reagents, they reflect the natural assay variability. The main advantage is that they behave like inactive compounds, and their statistical distribution is fully independent of that of the bulk population of compounds. The hit threshold is calculated for each assay plate separately. Compounds showing normalized assay signal values greater than the corresponding plate hit threshold are identified as hits.
Definitions
In the process of hit finding, a primary screen is usually conducted, where a large library containing hundreds of thousands of compounds is tested in singlicate. A hit list is obtained after applying a hit selection procedure. The next step in the process consists of confirming these hits by testing them in replicates. Definitions that are necessary for derivation of statistical parameters are given below. Most of them are in Zhang et al. 4 or are slightly modified to fit with this context.
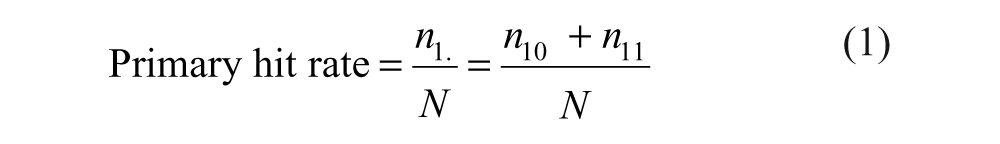
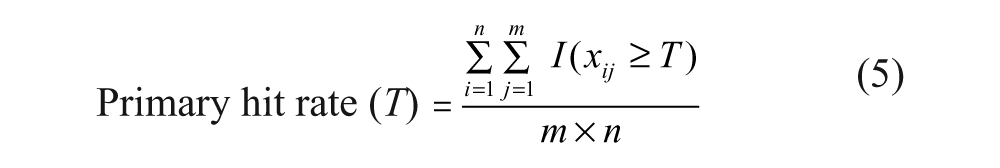
Primary hit rate: Ratio of the number of hits in the primary screening campaign to the total number of compounds having been tested
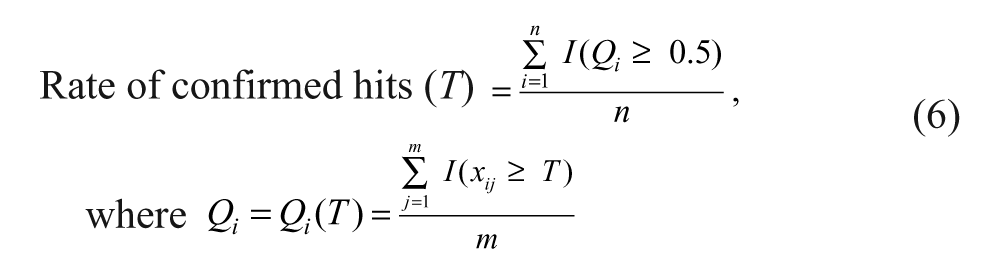
Confirmed hit: A compound for which at least 50% of the results from replicated measurements are greater than the associated plate hit threshold
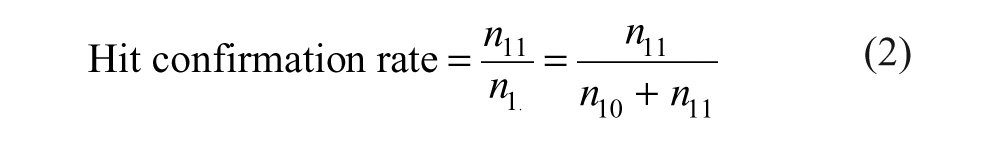
Hit confirmation rate: Ratio of the number of confirmed hits to the total number of primary hits included in the confirmation testing
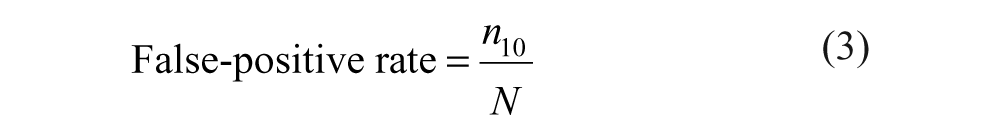
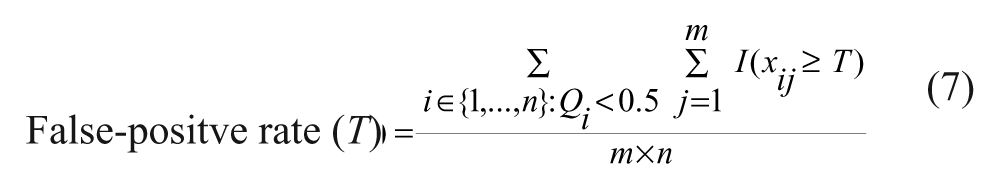
False-positive rate: Ratio of the number of primary hits not being confirmed to the total number of compounds that have been tested in the primary campaign
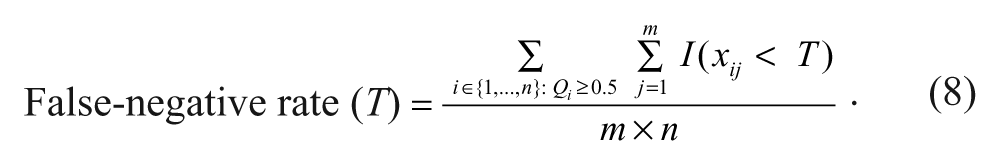
False-negative rate: Ratio of the number of actually active compounds that did not hit in the primary screen (i.e., that became false nonhits) to the total number of compounds that were tested in the primary screen
The definitions used here are based on the following argument: A robust assay is one that produces few false positives and at the same time enables the classification of actually inactive compounds as negatives with high confidence. Hence, the false-positive rate (calculated after the hit confirmation testing has been completed) also depends on the number of negatives among the compound set.
The definitions of false-positive and false-negative rates given above correspond to unconditional probability of false positivity (false hit) and of false negativity (false nonhit), respectively. In other scientific fields such as ordinary diagnostics, the false-positive rate corresponds to the conditional probability of a positive test result given the absence of target disease and the false-negative rate to the conditional probability of negative test results given presence of target disease.
The following formulas are derived from Table 1 .

Decomposition of the Total Number of Compounds According to the Actual Activity and the Observed Activity
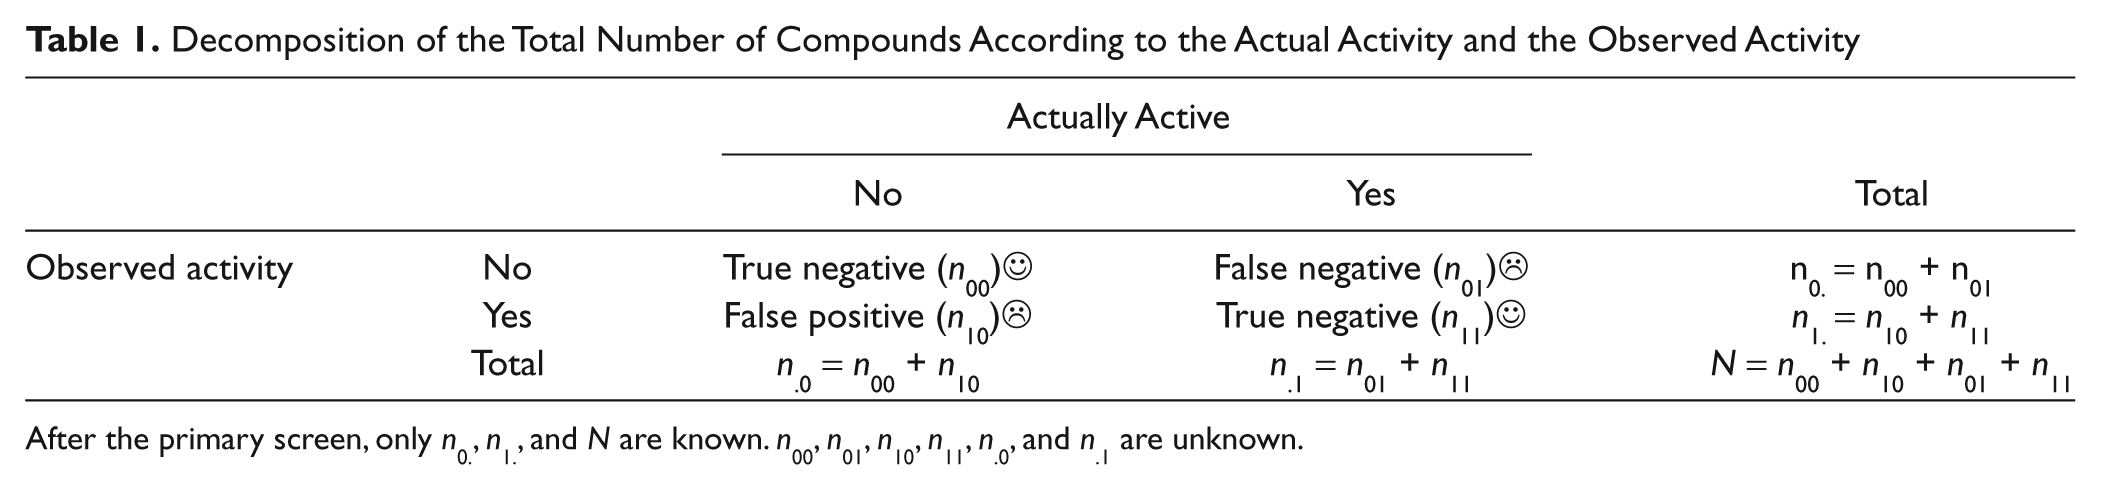
After the primary screen, only n0., n1., and N are known. n00, n01, n10, n11, n.0, and n.1 are unknown.
The difficulty in applying equations (1) to (4) is that not all numbers appearing in them are known. In equation (1), only n1. (i.e., the sum of n10 and n11) is known after the primary screen. n11 and n10, which are required in equations (2) and (3), can only be determined once the hit confirmation campaign has been completed. Because one does not know how many actually active compounds are missed during the primary screen, n01 will remain unknown, making a direct computation of (4) impossible.
The Resampling Scheme
In many applications, one of the objectives is the estimation of unknown parameters that may be of interest. Depending on the complexity of the estimated parameter and the lack of realistic assumptions, the assessment of the statistical accuracy of the parameters can be challenging.
To address this family of questions, Efron7,8 invented the bootstrap. It is a computer-based method that was extensively studied and tested during the past three decades, taking advantage of continuous revolution in computing with the goal to assign measures of accuracy to statistical estimates. The main advantage of bootstrap methods is that they do not require knowledge of the exact statistical distribution of the parameter estimator, a topic that involves highly sophisticated mathematics in most of the cases. The idea behind resampling methods and especially the bootstrap is to generate B new data sets (called bootstrap samples) from the original data set. Typical values of B are 100, 200, 500, or 1000. Suppose we observe n data points x1, . . ., x
n
. A bootstrap sample, usually denoted by
Within the framework of high-throughout screening (HTS), we consider a pilot screening set consisting of n compounds. For a given compound i, there are m i replicated measurements (e.g., the normalized assay signal results) denoted by x1,…, x mi .The number of replicates may differ from one compound to the other. This situation occurs, for instance, if assay plates have been excluded due to poor control wells. In this article, resampling is carried out in two steps. The first step consists of generating a “primary screening result,” which is obtained by selecting one of the replicated measurements at random. In the second step, one of the m i − 1 remaining replicated measurements is excluded to yield m i − 2 values that can be thought of as “hit confirmation results.” For example, in the case of five measurements, x1, . . ., x5, the following may happen: x3 might be selected as the primary result, and x1, x4, x5 may be the hit confirmation results. At this stage, we are in possession of all tools necessary for the definition of a resampling scheme based on the n compounds.
Let m = max i≤1≤n{m i } be the maximal number of replications. For the ease of simplicity, it is assumed that m1= . . . = m n = m (i.e., the number of replicated measurements for each of the n compounds is the same and is equal to m).
Define the observation matrix:

Each row X
i
(i = 1, . . ., n) of
Now considering the indicator function:

A constant hit threshold is assumed for illustration purposes. Based on the whole observation matrix
We are now in the position to describe the steps of the resampling method.
Create the observation matrix
Using equation (6), compute the actual set of “confirmed hits” based on a fixed hit threshold T. It consists of all compounds i for which Q i ≥ 0.5.
For each compound, select one measurement at random out of the m replicated measurements. This yield the “primary screen” results set denoted by X P . A compound i is defined as “primary” hit if its result in X P is higher or equal to the hit threshold T. The estimated primary hit rate is then defined as the ratio of the number of primary hits to the number of compounds n.
False positives are those primary hits (from step 3) that do not belong to the actual set of “confirmed hits” obtained in step 2. According to equation (7), the estimator of the false-positive rate is computed as the ratio of the number of false positives to the number of compounds n.
False negatives are the so-called missed hits. They consist of the “confirmed hits” (from step 2) that do not belong to the set of primary hits obtained in step 3. According to equation (8), the estimator of the false-negative rate is computed as the ratio of the number of false negatives to the number of compounds n.
For each compound, discard one measurement at random from the remaining m − 1 measurements and create therewith the results set for the confirmation screen. Apply equation (6) to the m − 2 remaining measurements by first calculating Q i for each compound i (i = 1, . . ., n). Afterwards, define the set of “confirmed hits” as those compounds for which Q i ≥ 0.5. Denote their number by n c . The estimated confirmation rate is then the ratio of n c to n.
For a fixed hit threshold T, repeat steps 3 to 6 B times. In this article, the number of repetitions B is set to 1000, resulting in 1000 calculated parameters sets. The 1000 calculated parameters are used to create predictions and confidence intervals. As an example, the 95% confidence interval for the hit confirmation rate is defined by the 2.5 and the 97.5 percentiles of the 1000 estimations of the hit confirmation rate obtained in step 6.
The results from steps 3 to 7 are based on a fixed hit threshold T. For a new hit threshold, step 2 and afterwards steps 3 to 7 are calculated again. The results obtained after applying the resampling method are shown next.
Results
Herein, the methodology described above (under Materials and Methods) was applied to three experimental screening data sets. These data sets were analyzed as follows.
Comparison of the predicted values with the experimental values obtained during the screen
Computation of confidence bands for the primary hit rate and the confirmation rate
Recommendation on how to select the optimal hit threshold
Recommendation on how to choose the optimal screening concentration when the compounds have been tested at more than one concentration
The analysis of the data was conducted with the statistical package S-Plus, Version 8.1.1 for Linux (TIBCO Spotfire S+ Version 8.1.1 for Linux 2.6.9-34.EL, 64-bit), a commercially available software. 10
Example 1: Protein Kinase Target
A structurally representative subset of the EVOTEC compound library (Marker Library) consisting of 2816 molecules was screened against a protein kinase target. This pilot campaign was conducted at a compound concentration of 10 µM, the objective being to assess the key statistics and, if necessary, adjust the compound concentration. The compound measurements were replicated four to five times. The pilot screen was carried out on 1536-well plates and revealed a mean Z′ and a mean signal-to-background ratio of 0.60 and 2, respectively. The distribution of the results from compound wells, sample negative control wells, and positive control wells is depicted in Figure 1 .
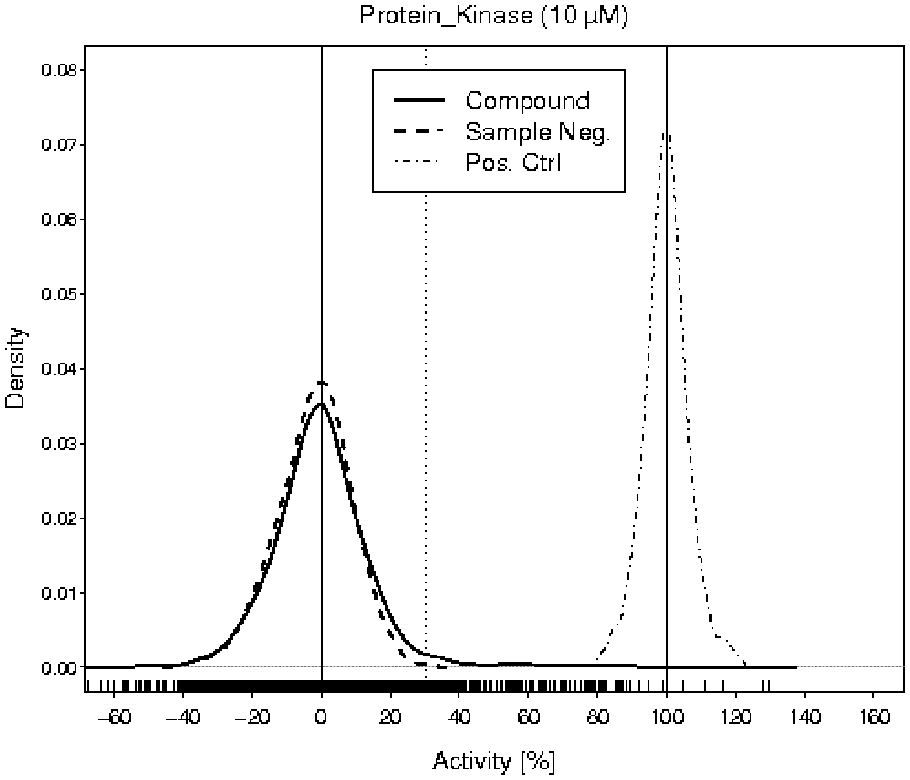
Kernel density estimations 9 of the activity values of compounds (solid curve), sample negative controls (dashed curve), and positive controls (dot-dashed curve) in the pilot screen. The vertical solid lines are drawn at 0% and 100%. The vertical dotted line is an example of a hit threshold at 30%. The short dashes along the x-axis represent the individual activity results of the compounds.
The purpose of the analysis of the collected data was to achieve a compromise between the false-positive rate, false-negative rate, and activity of the confirmed hits. This suggested computing the hit threshold by using the multiplier 5 for the standard deviation instead of 3, as demonstrated in Zhang et al. 1 To obtain the assay plate–dependent hit threshold, the sum from the mean activity of sample negative control wells and five times their standard deviation was calculated.
After the pilot screen, it was decided to run the primary screen of 260 000 compounds and the subsequent hit confirmation screen at 10 µM. Both campaigns revealed a mean Z′ of 0.62 and a mean signal-to-background ratio of 2. A primary hit rate of 1.5% and a hit confirmation rate of 65% were achieved.
The statistics obtained by applying the resampling method are depicted in Figure 2 . The primary hit rate, confirmation rate, and false-positive and false-negative rates were predicted after the completion of the pilot campaign. After the hit confirmation campaign, the huge triangle and circle (observed primary hit rate and hit confirmation rate, respectively) were added to the plot for comparison with the predicted results based on the pilot screen.
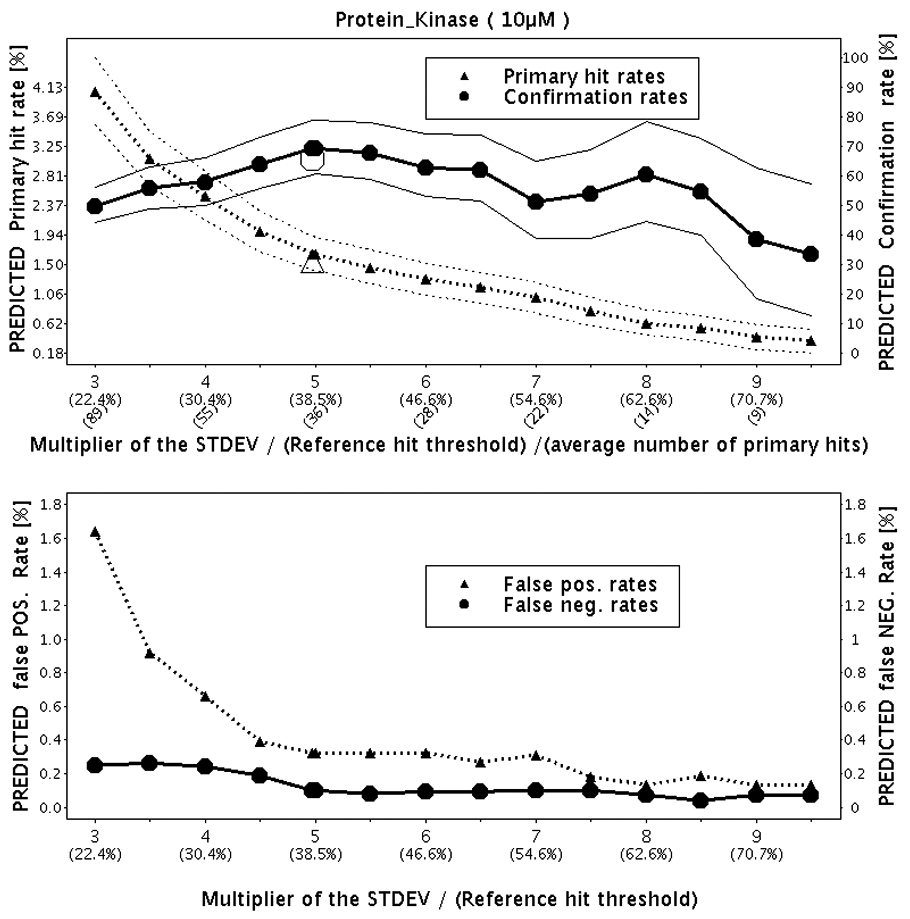
Predictions of the primary hit rate, confirmation rate, and false-positive and false-negative rates by increasing hit threshold. Confidence bands for the primary hit rate and confirmation rates are drawn around the corresponding curves. The huge triangle and the huge circle on the upper part of the figure are the primary hit rate (1.5%) and the confirmation rate (65%), respectively, obtained in the subsequent primary and confirmation screening campaigns. The multiplier 5 for the hit threshold computation was used.
Example 2: G-Protein-Coupled Receptor Target
The Marker Library consisting of 2816 molecules was screened against a G-protein-coupled receptor target (GPCR target) at a compound concentration of 10 µM. Similar to example 1, the goal was to assess the key statistics and, if necessary, adjust the compound concentration. The compound measurements were replicated four to five times.
Based on Figure 3 , the multiplier 8 for the standard deviation was chosen to compute the hit thresholds. Again, the reason was to achieve a compromise between the false-positive rate, false-negative rate, activity of the hits, and number of hits that can be processed in the subsequent hit confirmation campaign.
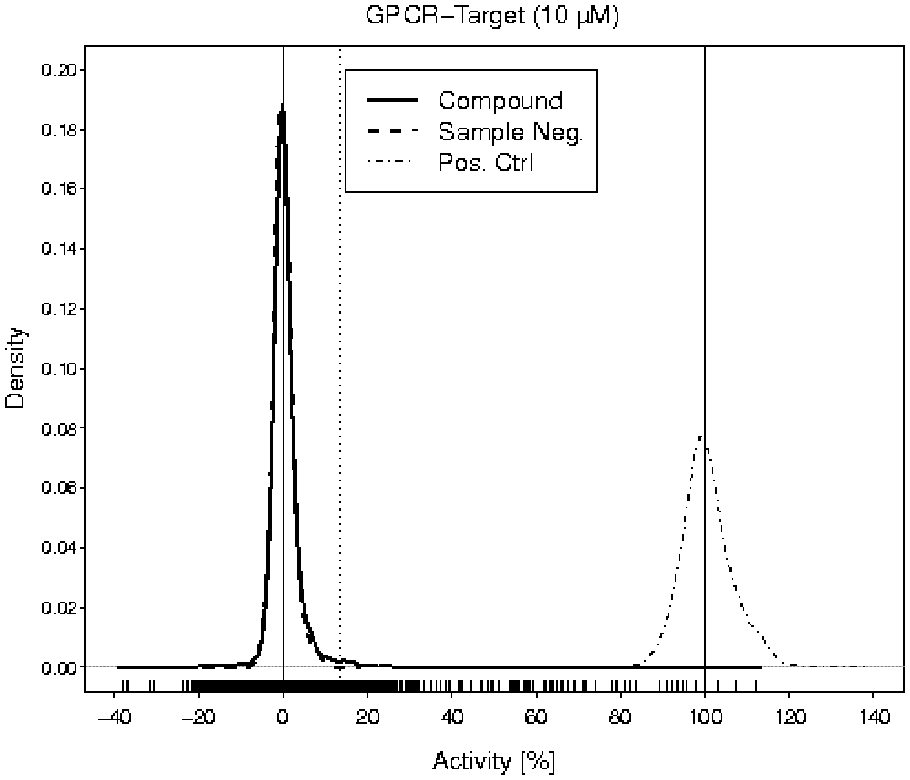
Kernel density estimations 9 of the activity values of compounds (solid curve), sample negative controls (dashed curve), and positive controls (dot-dashed curve) in the pilot screen. The vertical solid lines are drawn at 0% and 100%. The vertical dotted line is an example of a hit threshold at 15%. The short dashes along the x-axis represent the individual activity results of the compounds. GPCR, G-protein-coupled receptor.
The pilot screen was conducted on 1536-well plates and revealed a mean Z′ and a mean signal-to-background ratio of 0.80 and 5.2, respectively.
After the pilot screen, the decision was made to run the primary screen of 300 000 compounds and the subsequent hit confirmation screen at 10 µM. Both campaigns showed comparable performance, translating to a mean Z′ of 0.85 and a mean signal-to-background ratio of 7. Using the multiplier 8 for the hit threshold calculation, a primary hit rate of 0.7% and a hit confirmation rate of 81% were obtained.
Figure 4 depicts the results obtained by applying the resampling method. The primary hit rate, confirmation rate, and false-positive and false-negative rates were predicted immediately after the pilot campaign. After the completion of the hit confirmation campaign, the huge triangle und circle (observed primary hit rate and hit confirmation rate, respectively) were added to the plot for comparison.
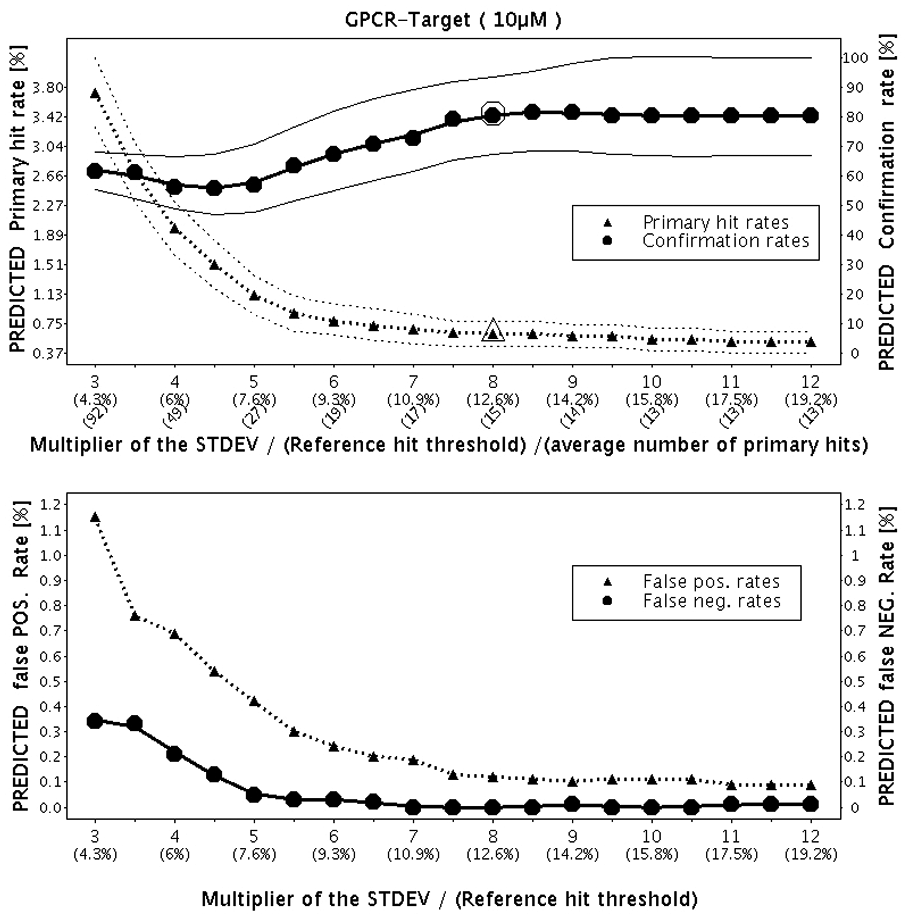
Predictions of the primary hit rate, hit confirmation rate, and false-positive and false-negative rates by increasing hit threshold based on the pilot screen results. Confidence bands for the primary hit rate and the hit confirmation rate are drawn around the corresponding curves. The huge triangle and the huge circle on the upper part of the figure are the primary hit rate (0.7%) and the confirmation rate (81%), respectively, obtained in the subsequent primary and confirmation screening campaigns. The multiplier 8 for the hit threshold computation was used. GPCR, G-protein-coupled receptor.
Example 3: Protease Target
A Marker Library consisting of 2815 molecules from the EVOTEC collection was screened against a protease target. The two compound concentrations of 10 µM and 25 µM were tested on 2080-well plates. Three to four measurements were replicated for each compound at the respective concentrations. A mean Z′ of 0.82 and a mean signal-to-background ratio of 2 were achieved. The screening results at 10 µM showed a very low primary hit rate, so the focus will be on the results at 25 µM. Figure 5 shows the distribution of the results from compound wells, sample negative control wells, and positive control wells.
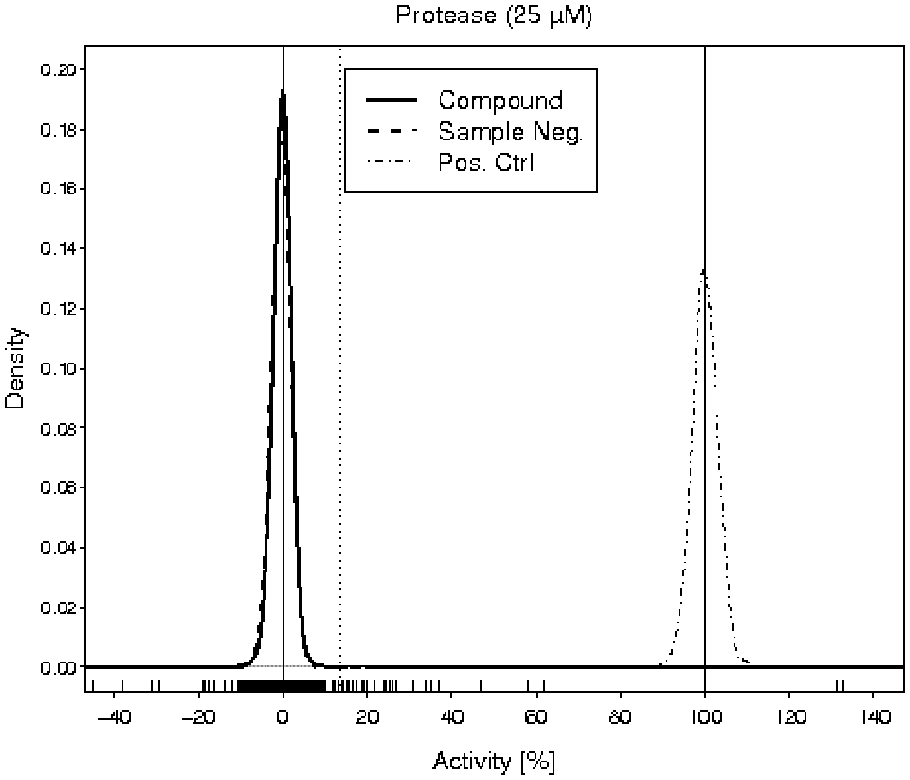
Kernel density estimations 9 of the activity values of compounds (solid curve), sample negative controls (dashed curve), and positive controls (dot-dashed curve) in the pilot screen. The vertical solid lines are drawn at 0% and 100%. The vertical dotted line is an example of a hit threshold at 15%. The short dashes along the x-axis represent the individual activity results of the compounds.
Arguments similar to those in examples 1 and 2 suggested the choice of the multiplier 4.5 for the hit threshold. During the primary screen, 280 000 compounds from the EVOTEC collection were tested in singlicate at a concentration of 25 µM. The multiplier 4.5 for the hit threshold calculation resulted in a primary hit rate of 0.6% and a hit confirmation rate of 56%.
The outcome of the resampling method is shown in Figure 6 . Again, the huge triangle and circle (primary hit rate and hit confirmation rate, respectively) were added to the plot after the completion of the primary and hit confirmation screens.
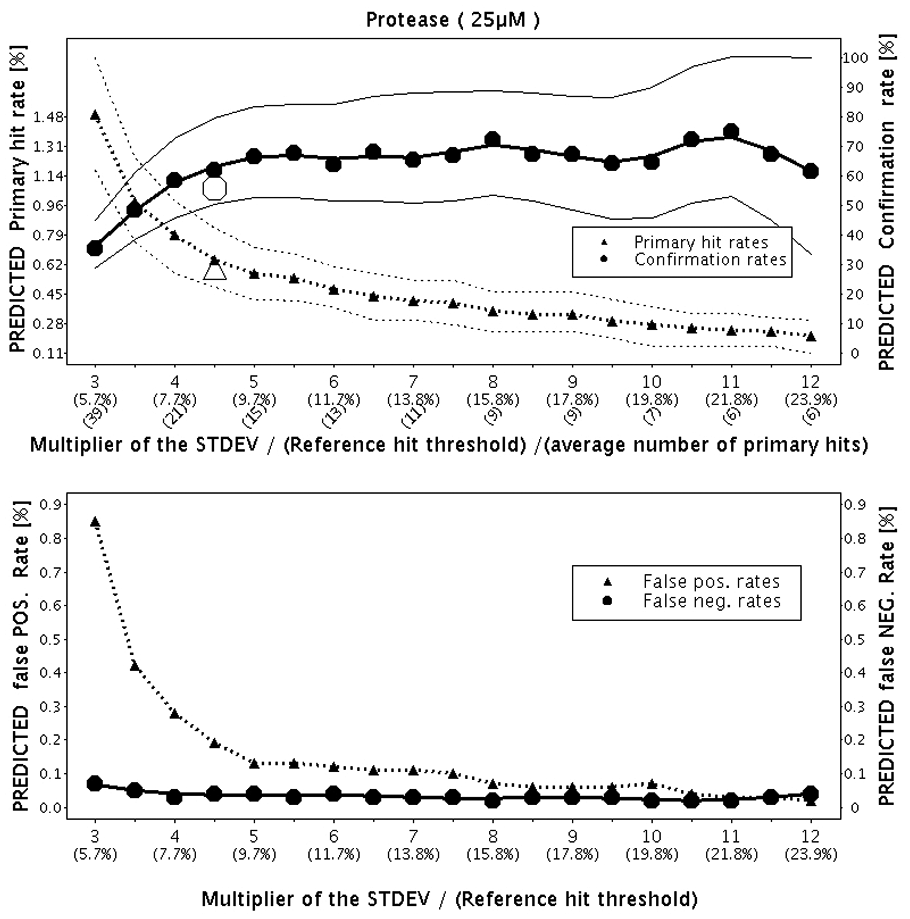
Predictions of the primary hit rate, hit confirmation rate, and false-positive and false-negative rates by increasing hit threshold based on the pilot screen results. Confidence bands for the primary hit rate and the hit confirmation rate are drawn around the corresponding curves. The huge triangle and the huge circle on the upper part of the figure are the primary hit rate (0.6%) and the confirmation rate (56%), respectively, obtained in the subsequent primary and confirmation screening campaigns. The multiplier 4.5 for the hit threshold computation was used.
Discussion
One of the exercises in the early drug discovery process is the development of robust assays that enable a reliable identification of active compounds against a given target. Cost considerations require the minimization of false positives during the primary screen. Increasing the hit threshold is one possibility to account for the reduction of the number of false positives, but at the same time, false negatives are generated.
In this article, a method for an upfront prediction of the primary hit rate, hit confirmation rate, and false-positive and false-negative rates has been proposed and validated with real data. The resampling method uses the information generated in a pilot campaign, where a representative set of the screening library is tested in replicate. In addition to the results in examples 1 to 3, many other campaigns were analyzed. Similar results (not shown in this article) to those of examples 1 to 3 were achieved. In the examples above, the primary hit rate and hit confirmation rate obtained after the corresponding primary and confirmation campaigns are within the confidence bands. The main idea of the method presented in this article consists of capturing the data variability. In other words, there is a link between a robust assay (meaning an assay in which the agreement of the individual measurements for the compounds is very good) and the rate of false positives and negatives.
Another application of the prediction method consists of warning the assay developer in cases where the predicted confirmation rate is low. In this situation, the reasons for the low confirmation rate have to be investigated, and in the majority of cases, a further optimization of the assay toward robustness is essential. It is important to note that the predicted parameters are only useful if the assay performance and quality during the pilot campaign, the primary screen, and the hit confirmation are the same. The sporadic appearance of errors such as edge effects on assay plates may contribute to the discrepancy between the predicted and the observed parameters. This shows again how crucial it is to generate high-quality data.
It is also important to mention an ambiguity that can be caused by the number of replicates m for compounds having a hit probability of exactly 0.5. As pointed out by a reviewer, compounds that happen to be tested with an odd and even number of replications are not given precisely equal chances. This statement follows from the properties of the binomial distribution. In some contexts, steps have to be taken to avoid that imbalance (e.g., the generation of additional replicates). For an odd number of replicates, either less than 50% or more than 50% of the replicated results are greater than the hit threshold. However, in case of an even number of replicates, exactly 50% of the measurements may be greater and 50% less than the hit threshold. At any rate, the corresponding compounds are classified as confirmed hits because this behavior is typical for compounds having their IC50 value at the screening concentration. By taking them into the subsequent phase (usually hit profiling), the scientist has the opportunity to characterize the compounds in concentration-response mode and thus avoids losing them.
Footnotes
Acknowledgements
We thank all members of the screening operation group at EVOTEC for running the assays on the screening devices. We are grateful to our colleagues Dr. Christian Kirchhoff, Dr. Insa Winzenborg, Dr. Alexander Böcker, Dr. Annett Müller, Dr. Mark Slack, and Dr. Dennis Wegener for helpful discussions and input to the manuscript. We also thank two anonymous referees for their valuable comments and their constructive suggestions.
Declaration of Conflicting Interests
The authors declared no potential conflicts of interest with respect to the research, authorship, and/or publication of this article.
Funding
The authors received no financial support for the research, authorship, and/or publication of this article.