
Abstract
Methods and techniques used to detect apoptosis have benefited from advances in technologies such as flow cytometry. With a large arsenal of lasers, fluorescent labels, and readily accessible biological targets, it is possible to detect multiple targets with unique combinations of fluorescent spectral signatures from a single sample. Traditional flow cytometry has been limited as a screening tool as the sample throughput has been low, whereas the data analysis and generation of screening relevant results have been complex. The HTFC Screening System running ForeCyt software is an instrument platform designed to perform high-throughput, multiplexed screening with seamless transformation of flow cytometry data into screening hits. We report the results of a screen that simultaneously quantified caspase 3/7 activation, annexin V binding, cell viability, and mitochondrial integrity. Assay performance over 5 days demonstrated robustness, reliability, and performance of the assay. This system is high throughput in that a 384-well plate can be read and fully analyzed within 30 min and is sensitive with an assay window of at least 10-fold for all parameters and a Z′ factor of ≥0.75 for all endpoints and time points. From a screen of 231 compounds, 11 representative toxicity profiles highlighting differential activation of apoptotic pathways were identified.
Introduction
Drug toxicity is a major cause of compound attrition during drug development. 1 Thus, accurately predicting which molecules are safe and less likely to encounter development hurdles cannot only improve downstream productivity but also protect patients. Furthermore, understanding mechanisms of toxicity if or when it arises can help to establish relevance across the various cell lines and animal models used in preclinical testing. The identification of toxicity problems early in the drug discovery process represents the single largest cost-saving opportunity in the pharmaceutical industry at the present time, 2 but detection methodologies to assist with this need are still under constant development and refinement. Methods traditionally have encompassed either a high-throughput, low-content approach, such as single-endpoint assays, or a lower throughput, high-content approach as represented by many imaging technologies. Relatively new to the field is the concept of high-throughput flow cytometry, which offers rapid and sensitive data acquisition coupled with high-content (multiple endpoints per well/sample) analysis. In addition to the ability to multiplex endpoints, many traditional single-endpoint assays can actually be performed earlier and under more biologically relevant assay conditions by flow-based detection. Flow cytometry makes use of the scattering of laser light and the fluorescence excitation of fluorochromes to facilitate rapid single-cell analysis of large numbers of cells within short periods of time—often upwards of 10 000 cells/s. Using the scatter characteristics of a sample, it is possible to recognize subsets of cells present in complex cell populations such as blood, bone marrow, spleen, thymus, and lymph node populations. 3
Although this analytical method has been used for more than 30 years, the adaptation of flow cytometry as a commercially available screening tool has only occurred recently. The limiting factors have been sample throughput and the necessity for rapid transformation of a potentially complex flow-based data set to a quickly accessible and relevant screening result. To effectively perform a screening campaign, some key requirements must be met. First, given the large number of samples within a screen, the instrument must be able to quickly sample the test compounds in appropriate replicates—typically on the order of a few minutes per plate. Second, the detection equipment must have the sensitivity and speed required for sampling plates at a high acquisition rate. And finally, there must be automated software that can analyze the data sets quickly to identify samples or wells of interest within the screening campaign. Although many pieces of equipment satisfy the first two key requirements (e.g., plate readers, imaging cytometers), software packages that can handle screening-level flow cytometric data using automated analyses and quick identification of hits within a plate are just recently emerging. 4 For the screening assay described here, the data handling was done using ForeCyt software. This software package uses analysis templates that have predrawn gates and, in contrast to typical flow-based data, can analyze data from the entire plate at once. Both of these features significantly streamline the data analysis workflow and allow users to quickly analyze large numbers of not only samples but also large quantities of plates and quickly identify hits from screening runs.
Here we introduce a novel high-throughput flow-based screening assay for the simultaneous detection of multiple readouts of apoptosis. As a multiplexed screening assay, the simultaneous assessment of each sample for caspase 3/7 activation, annexin V binding, mitochondrial integrity, cell viability, and cell size was achieved with ~6-µL sample volume. Proprietary software provides a simplified solution for capturing critical screening metrics from the flow cytometry data set by the use of acquisition and analysis templates with prespecified gating that can be applied uniformly to all screen plates. Assay performance over 5 days demonstrated robustness, reliability, and performance of the assay. This system is high throughput in that a 384-well plate can be read and fully analyzed within 30 min. From a screen of 231 compounds generating ~68 000 data points, several distinct toxicity profiles highlighting differential activation of apoptotic pathways were identified.
Materials and Methods
Materials
All tissue culture reagents were purchased from HyClone Laboratories, Inc. (Logan, UT). The 384-well microplates were purchased from Corning (Corning, NY). Test compounds were obtained from either Sigma (St. Louis, MO) or Toronto Research Chemicals (Toronto, Canada). Staurosporine was purchased from LC laboratories (Woburn, MA). Triton X-100 was purchased from VWR International (Radnor, PA). A fluorescent-labeled inhibitor of caspase (FLICA; cat. #93) reagent was purchased from Immunochemistry Technology (Bloomington, MN). The DNA binding dye 7-amino-actinomycin D (7-AAD; cat. #559925) and annexin V (cat. #560930) reagent were purchased from BD Biosciences (San Jose, CA). MitoProbe dye was obtained from Invitrogen (cat. #M34151; Carlsbad, CA).
Methods
Cell culture conditions
Jurkat cells (clone E6.1) were obtained from ATCC (Manassas, VA) and maintained in RPMI media supplemented with 10% cosmic calf serum and 2× L-glutamine (all HyClone Laboratories, Inc.; SH30027, SH30087, and SH30034, respectively). Cells were maintained in log growth phase under standard conditions (37 °C, 5% CO2), in 175-cm2 flasks and seeded onto 384-well plates (30 000 cells/well) for individual experiments.
Compound preparation and testing
Compounds were dissolved in 100% DMSO at either 30-mM stock solutions or 10-mM stock solutions (staurosporine-positive controls). Test compounds were prepared using 11 doses in a 2-fold dilution scheme ranging from 30 to 0.03 mM, then diluted to 2× of final dosing concentration in complete cell media (final DMSO content 2%). All compounds were tested in this dilution scheme in duplicate. Equal volumes of compounds and cells were combined (final assay volume of 30 µL, 1% DMSO) and incubated for either 4 h or 24 h before the staining protocol. Each plate was prepared in duplicate on the first day of the assay, with cells and compounds added at the same time. After 4 h of incubation, one plate was processed (stained) and analyzed. The second plate was analyzed after 24 h of incubation with cells and compound.
Multiplexed apoptosis screening assay
Cells in log-phase growth were prepared in suspension at 2 × 10⁶ cells/mL on the day of the experiment. Staurosporine and/or test compounds were diluted to the appropriate concentration on the day of the assay in complete cell medium. Equal volumes of cells and compounds were combined and mixed. All plates were incubated at 37 °C, 5% CO2 for 4 h or 24 h. All plates contained appropriate vehicle only (DMSO) and positive controls (staurosporine) in replicates of 16 per type/per plate.
At each time point (4 or 24 h after compound addition), 50 µL complete media was added directly to each well and plates were centrifuged, then medium removed by aspiration. Cells were sequentially resuspended and incubated with 20 µL per well of the caspase detection reagent (diluted 1:450 into cell media from stock solution as prepared according to the manufacturer) and then with 20 µL per well of the mitochondrial reagent (diluted 1:500 from stock into cell media) with a wash step after each staining step. The final staining step combined the annexin V reagent (diluted 1:500 from stock) and cell viability reagent (prepared 1:100 from stock) in 20 µL per well sample buffer (phosphate-buffered saline [PBS] with 0.1% bovine serum albumin [BSA]), and samples were directly acquired from the plates without washing off the final stain. Total time for the staining protocol was ~1.5 h, and all samples were analyzed on the HTFC Screening System (IntelliCyt Corporation, Albuquerque, NM).
Data acquisition and analysis
Each well of the 384-well plate was sampled with a 3-s sip time, 1-s up time, resulting in a total read time for each plate of approximately 30 min. For each sample, ≥2000 cells were analyzed. ForeCyt Screening Software (IntelliCyt Corporation) was used for rapid analysis of all experimental data. The initial generation of an acquisition and analysis template file at the beginning of the screen took approximately 30 min, and using the template, all additional analyses were completed within 1 to 2 min after data acquisition was complete. The template file included compensation adjustment, which was uniformly applied to the data to digitally minimize fluorescence overlap between detection channels. The initial template file was constructed using electronic gates within the software to create a hierarchical population tree. From the scatter profile (plot of FSC vs. SSC), two distinct population clusters of Jurkat cells were visually identified, and then gates were manually drawn, the first corresponding to normal morphology cells and the second to smaller, late apoptotic cells. One-dimensional histograms for each fluorescence parameter were constructed for the identified cells. “Positive” and “negative” gating of the fluorescence signal was drawn based on fluorescence intensity of the positive and vehicle-only control samples, as appropriate to the endpoint, and these gates were applied to all individual wells on a per plate basis ( Fig. 1 ). This template was then automatically applied to all subsequent plates ran in the screen. The final data output for endpoints at 4 h was expressed as percent positive events relative to the normal cell population only and for 24 h as percentage of all cells.
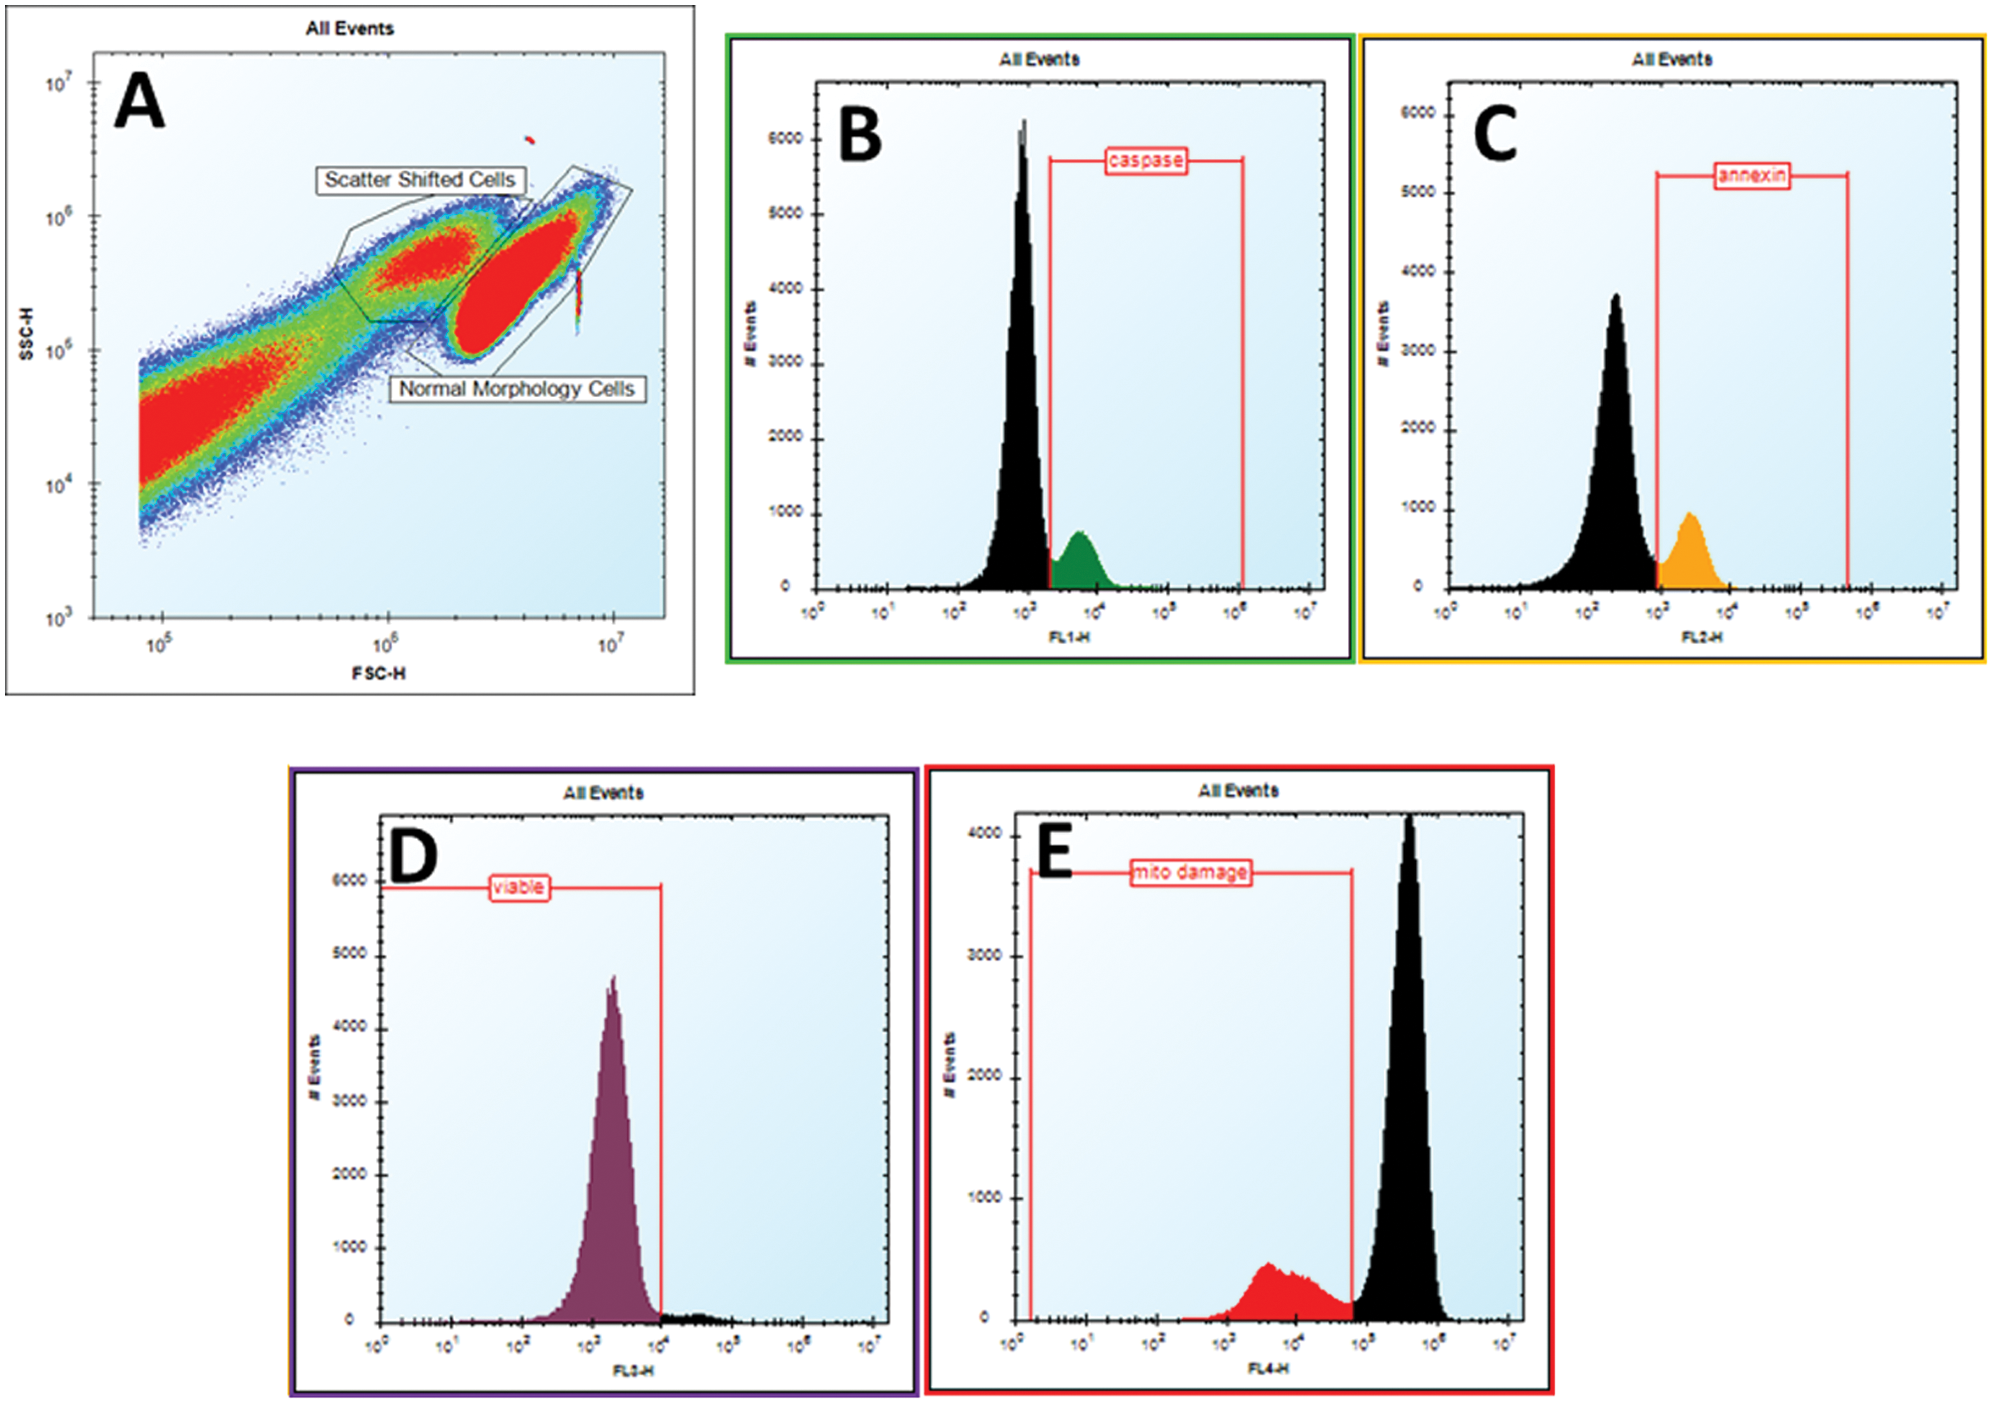
Gating and analysis strategy for toxicity data generated on HTFC Screening System. Data in ForeCyt software is organized and analyzed on a plate-level basis, where all the samples from a plate can be analyzed with a uniform gating strategy. The first level of discrimination is to identify the cell population by manually drawing a gate around the “clusters” of cells (
For the Z′ factor calculation, the formula by Zhang et al. 5 was used.
Results and Discussion
Assay robustness and interassay variation
A 5-day validation study in 384-well plates was performed to define the Z′ factor, assay window, well-to-well variability, and day-to-day variability for each endpoint. Replicate data for vehicle-only and staurosporine-treated positive controls for each day were compiled, and statistics for 4-h and 24-h incubations are shown in Table 1 . For the 4-h data point, the Z′ factor was calculated at 0.95 for caspase 3/7 activation, with an assay window of 58.0 and a signal-to-noise ratio of 25.7. Values for annexin binding and mitochondrial integrity demonstrated similarly robust values at 4 and 24 h ( Table 1 ).
Demonstration of Robustness and Reliability of a Multiplexed Toxicity Assay over 5 Days
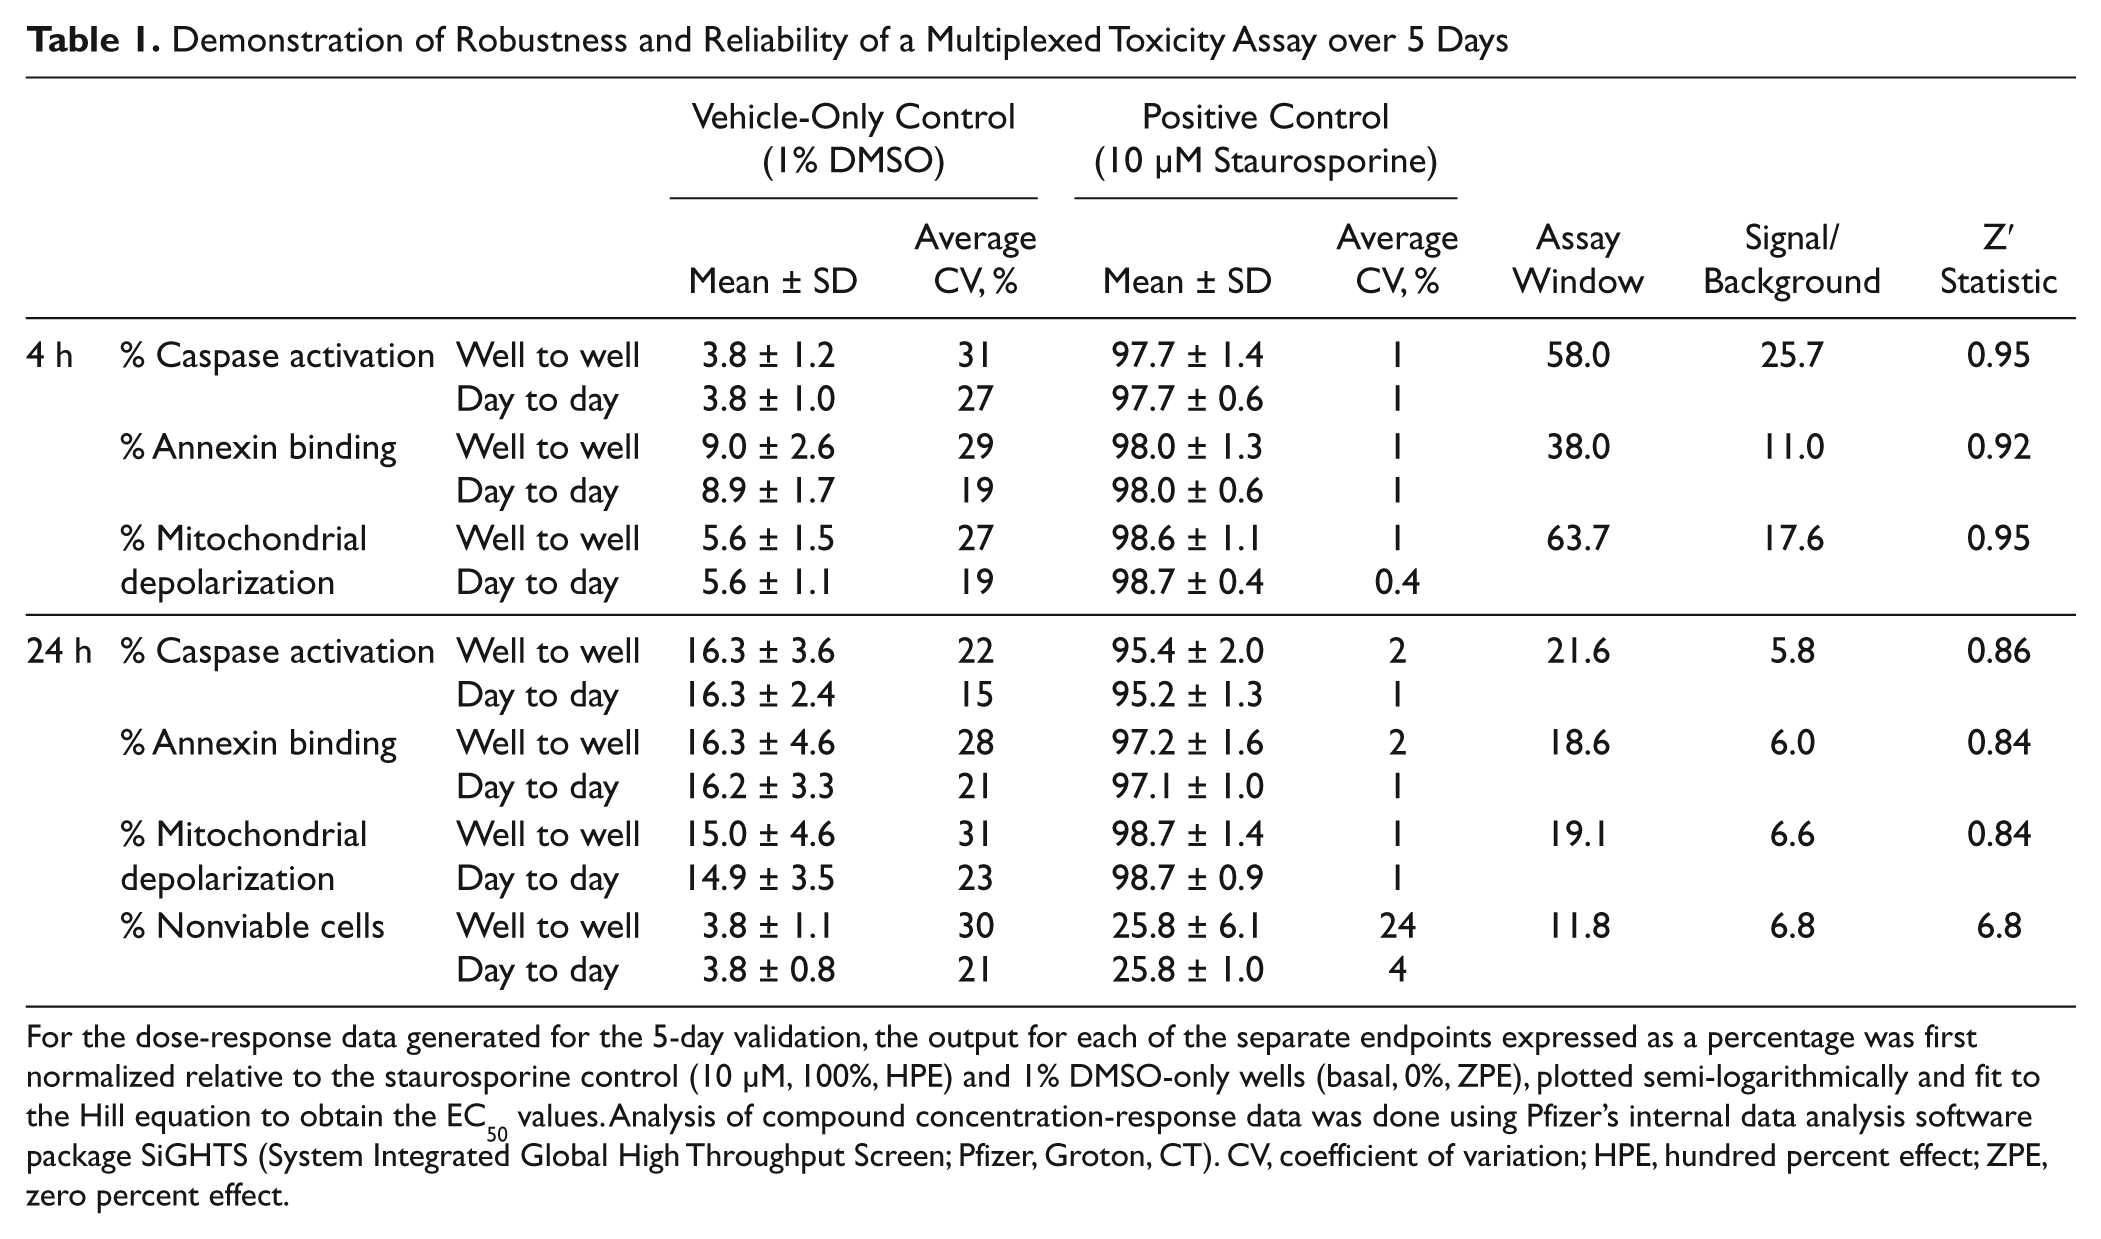
For the dose-response data generated for the 5-day validation, the output for each of the separate endpoints expressed as a percentage was first normalized relative to the staurosporine control (10 µM, 100%, HPE) and 1% DMSO-only wells (basal, 0%, ZPE), plotted semi-logarithmically and fit to the Hill equation to obtain the EC50 values. Analysis of compound concentration-response data was done using Pfizer’s internal data analysis software package SiGHTS (System Integrated Global High Throughput Screen; Pfizer, Groton, CT). CV, coefficient of variation; HPE, hundred percent effect; ZPE, zero percent effect.
DMSO (vehicle control) and staurosporine (positive control) were used to assess the variability of the assay over a 5-day period. Each day, 16 replicates of DMSO controls and 16 replicates of the staurosporine dose-response curve were run. Mean values and standard deviation (SD) for each parameter at each time point are tabulated in Table 2 . The average measured value (%) at 4 h for DMSO (vehicle)–treated cells was 8.9 ± 1.7 for annexin, 3.8 ± 1.0 for caspase, and 5.6 ± 1.1 for mitochondrial depolarization. The average measured value at 24 h for DMSO (vehicle)–treated cells was 16.3 ± 3.3 for annexin, 16.3 ± 2.4 for caspase, and 14.9 ± 3.5 for mitochondrial depolarization. In addition, % nonviable cells measured at 24 h was 3.8 ± 0.8 ( Table 2 ). For staurosporine-treated cells, the average EC50 value (µM) at 4 h was 0.14 ± 0.055 for annexin, 0.16 ± 0.060 for caspase, and 0.15 ± 0.057 for mitochondrial depolarization. The average EC50 (µM) value at 24 h for staurosporine-treated cells was 0.05 ± 0.014 for annexin, 0.05 ± 0.013 for caspase, 0.05 ± 0.015 for mitochondrial depolarization, and 0.08 ± 0.034 for viability ( Table 2 ). The day-to-day variation is captured in the mean ± 2SD values reported for each respective parameter. Overall, the results show that the EC50 values with staurosporine and the single dose of DMSO (1% v/v) were reproducible over 5 days in the multiplexed assay for each of the five measured endpoints and each time point.
Comparison of 5-day Validation Values (Average ± Standard Deviation, n = 16) of Multiplexed Assay Endpoints for DMSO (Vehicle)– and Staurosporine-Treated Jurkat Cells
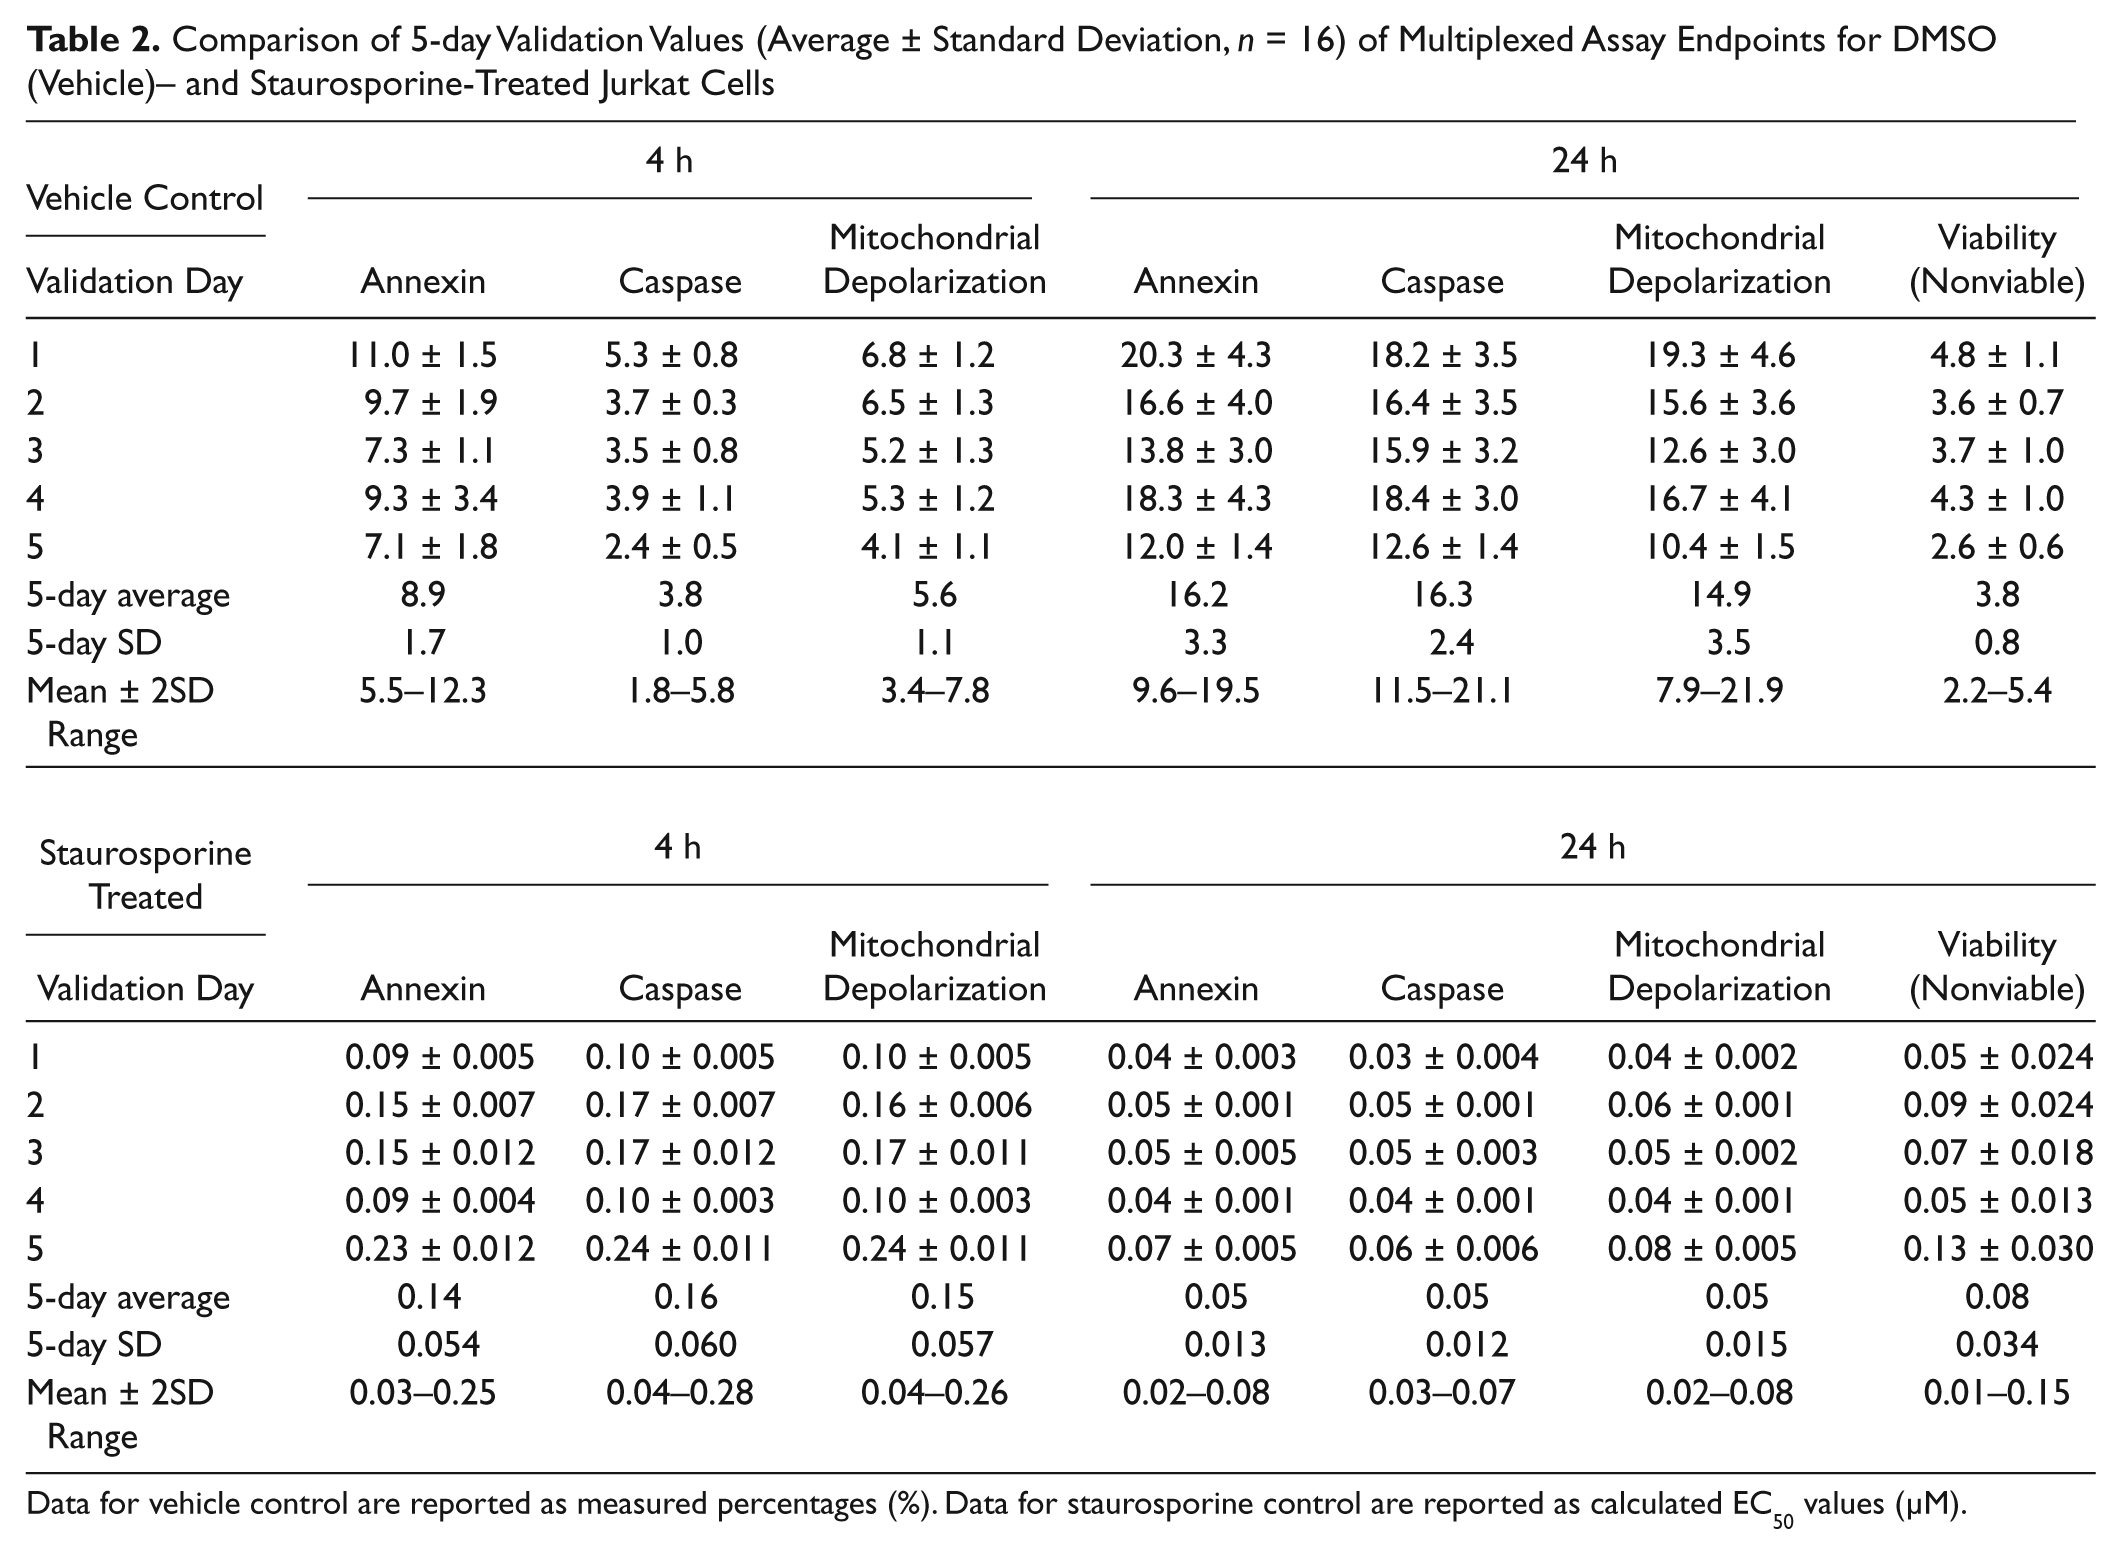
Data for vehicle control are reported as measured percentages (%). Data for staurosporine control are reported as calculated EC50 values (µM).
Distinction between early and late apoptotic processes
In addition to understanding compound concentration-dependent toxicity, there is also a need to characterize the time dependence of apoptosis. Building on the ability to discriminate early and late apoptotic cell populations based on scatter, 6 we have used a data analysis strategy that can robustly identify time and potency dependence. For the 4-h data points, the calculated ratios for caspase 3/7–activated cells, annexin-positive cells, and cells with mitochondrial damage were calculated against the normal population only, to characterize an early potency response. This was done to reduce the additional background signal from the scatter-shifted late apoptotic cells. For the 24-h time points where the interacting effects of time and concentration are of interest, the ratios are all calculated against the entire cell population, including both normal morphology and scatter-shifted cells. Thus, in addition to short and long incubation times with a compound, a population-based analysis scheme provides an additional assessment on early and late apoptosis.
Data for all endpoints at both 4 and 24 h showed essentially saturation of the signal at the highest concentrations with values above 90% activation or activity for all parameters except for the viability endpoint. Although the assay window (11.8), signal-to-background ratio (6.8), and Z′ factor (0.75) for the 24-h viability signal were robust, the maximum value of 25.8% nonviable cells was likely an artifact of having several wash steps involved in the assay protocol, which resulted in preferential loss of late-stage apoptotic cells. In the future, homogeneous or “no-wash” protocols can be adapted for flow-based staining to remove this assay artifact.
Multiplex data set enables establishment of compound “signatures.”
A compound library of 231 compounds known to cause toxicity in either animals or humans was characterized for four common apoptosis endpoints. A graphical illustration of the typical workflow and detailed description are provided in
The categorization of each compound was based on the individual EC50 values generated from the 11-point dose-response curves averaged over replicates for each compound. A “toxic response” was categorized as an EC50 value of ≤150 µM. Any values above 150 µM were categorized as nonresponsive. This value was used for illustrative purposes, as the actual cutoff value for an assay system has to be established for each screen based on the cell type being used and the specific goals of the test. The true and relevant “effect” value can only be established by testing a large set of reference compounds that are well characterized with respect to animal or human exposure and toxicity profile. 7 The establishment of this value does not affect the 21 theoretical profiles but will affect the number of compounds in each category. The two most extreme profiles were those that showed no response (EC50 ≥150 µM) at any time point with any of the parameters measured (17-β estradiol; Fig. 2A ) or a profile that showed a significant response (EC50 ≤150 µM) at all time points and with all parameters analyzed (simvastatin; Fig. 2B ). Tamoxifen ( Fig. 2C ) likewise exhibited toxicity based on all three parameters but only after 24 h of incubation with the compound. Felbamate ( Fig. 2D ) and diclofenac ( Fig. 2E ) both exhibited toxicity but represented a category of compounds that did not activate caspase at any time point. Cephaloridine ( Fig. 2F ) did not show caspase activation at 4 h but a significant effect after 24 h. Retinyl palmitate ( Fig. 2G ) represents the category of compounds that activated annexin binding and caspase but without mitochondrial involvement. The thiazolidine (TZD), pioglitazone ( Fig. 2H ), exhibited toxicity involving caspase activation and mitochondrial depolarization without annexin binding at 4 h; however, at 24 h, all endpoints were affected. The compounds benzbromarone ( Fig. 2I ), neurontin ( Fig. 2J ), and norgestrel ( Fig. 2K ) are representatives of compounds that caused single-pathway activation, with each compound only activating a single endpoint—caspase, mitochondria, or annexin, respectively—after 24 h of compound incubation.
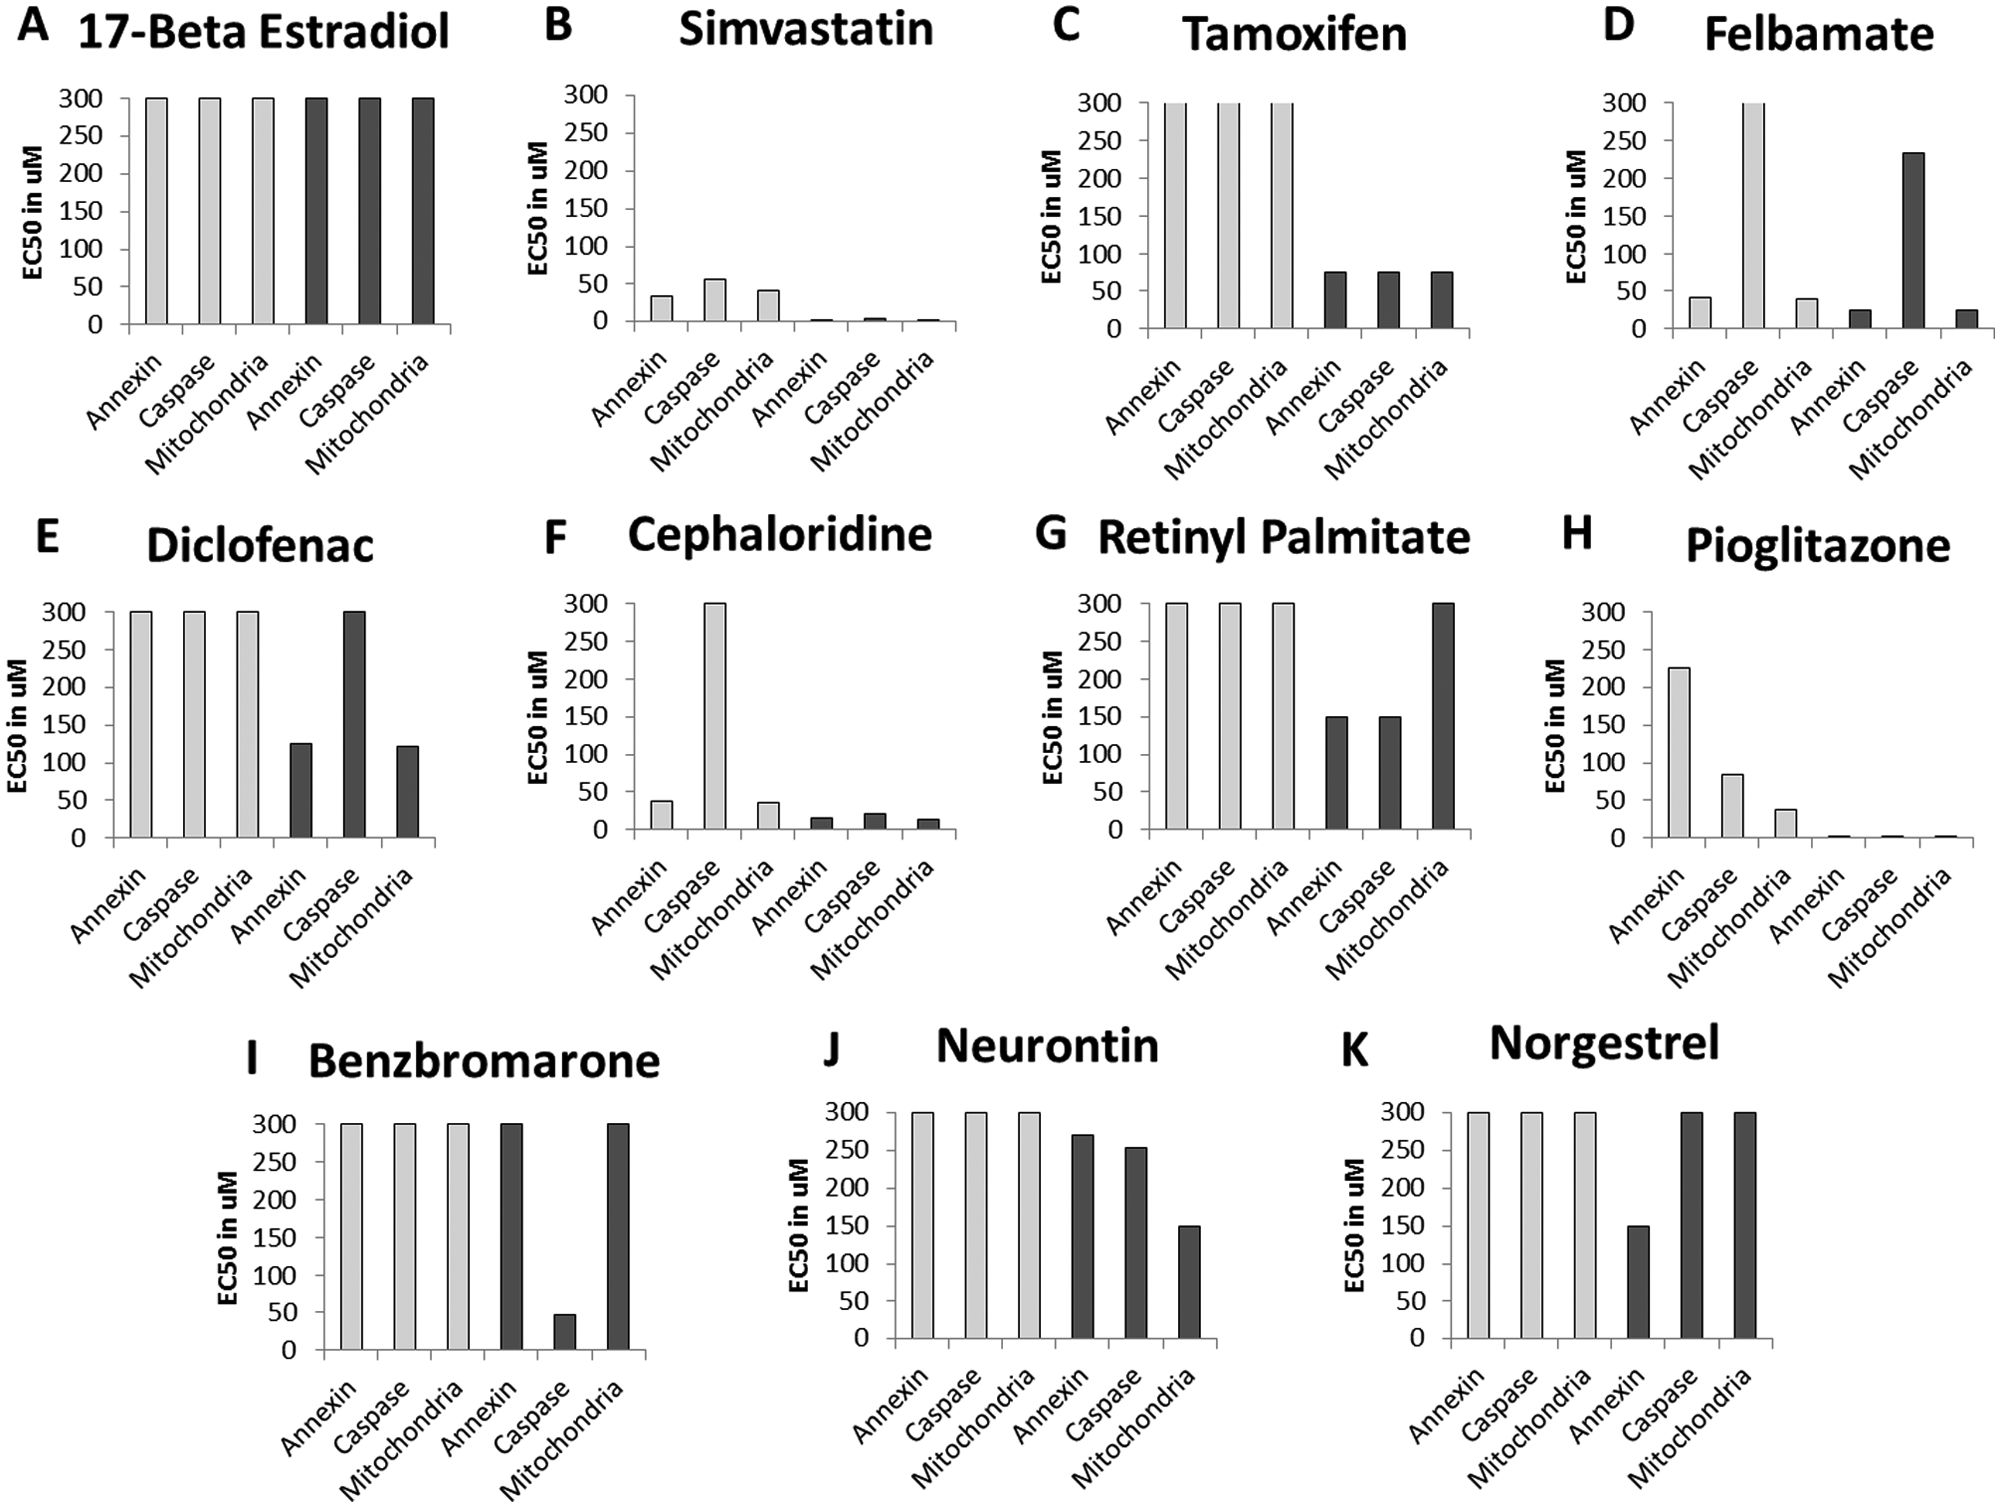
Distinct toxicity dose-response profiles. From the 231-compound set that was screened, 11 compounds with unique response profiles are highlighted to demonstrate the utility of the multiplexed data set. Each compound was tested in an 11-point dose response at a maximum dose of 300 µM, with 1:2 fold serial dilutions in duplicate. EC50 values calculated for 4 h are shown in light gray. EC50 values for 24 h are shown in dark gray bars. A “response” is categorized as an EC50 value of ≤150 µM. Any values above 150 µM are categorized as nonresponsive. Based on this criterion, 17-β estradiol (
The unique compound profiles identified in this assay are illustrative of differential apoptosis profiles that are accessible from this large data set, and taken together, the data provide a much more detailed understanding of the biological process that can assist in structure-activity relationship (SAR) work and de-risking approaches. Please refer to
Within the realm of toxicity testing, there is a need and interest in precisely distinguishing the mechanism of cell death. The ability to measure multiple markers of apoptosis in each sample and to track the response in each endpoint over concentration and/or time highlights the value of high-throughput flow cytometry for toxicity screening. For compounds with pathway-specific modes of action, the multiplexed assay can readily identify preferential pathway activation—essentially, a single sample will yield the same amount of data as a suite of assays individually testing for the same endpoints. The general recommendation for the use of this assay would be as an early toxicity screen to identify the most cytotoxic compounds (all endpoints affected) in a screening campaign and establish preliminary mechanism of action for compounds with preferential activation of pathways.
Footnotes
Declaration of Conflicting Interests
The authors declared no potential conflicts of interest with respect to the research, authorship, and/or publication of this article.
Funding
The authors received no financial support for the research, authorship, and/or publication of this article.
References
Supplementary Material
Please find the following supplemental material available below.
For Open Access articles published under a Creative Commons License, all supplemental material carries the same license as the article it is associated with.
For non-Open Access articles published, all supplemental material carries a non-exclusive license, and permission requests for re-use of supplemental material or any part of supplemental material shall be sent directly to the copyright owner as specified in the copyright notice associated with the article.