
Abstract
Tankyrase, a member of human PARP protein superfamily, catalyzes a covalent post-translational modification of substrate proteins. This modification, poly(ADP-ribos)ylation, leads to changes in protein interactions and modifies downstream signaling events. Tankyrase 1 is a potential drug target due to its functions in telomere homeostasis and in Wnt signaling. We describe here optimization and application of an activity-based homogenous assay for tankyrase inhibitors in a high-throughput screening format. The method measures the consumption of substrate by the chemical conversion of the remaining NAD+ into a stable fluorescent condensation product. Conditions were optimized to measure the enzymatic auto-modification of a recombinant catalytic fragment of tankyrase 1. The fluorescence assay is inexpensive, operationally easy and performs well according to the statistical analysis (Z′= 0.7). A validatory screen with a natural product library confirmed suitability of the assay for finding new tankyrase inhibitors. Flavone was the most potent (IC50=325 nM) hit from the natural compounds. A flavone derivative, apigenin, and isopropyl gallate showed potency on the micromolar range, but displayed over 30-fold selectivity for tankyrase over the studied isoenzymes PARP1 and PARP2. The assay is robust and will be useful for screening new tankyrase inhibitors.
Introduction
Tankyrases belong to the poly(ADP-ribose) polymerase (PARP) enzyme family (EC 2.4.2.30). They transfer ADP-ribose units from NAD+ to the target protein one by one to form a polymer of ADP-ribose (PAR). The polymer is covalently linked to glutamate or lysine residues of acceptor proteins. In the PARsylation reaction, the NAD+ molecule is cleaved to ADP-ribose and nicotinamide. ADP ribosylation modulates the affinity of the target molecules toward binding partners, and subsequently, PARPs are involved in important cellular functions such as DNA damage detection and repair, transcriptional regulation, intracellular trafficking, chromatin modification, mitotic apparatus formation, and cell death. 1 The most studied member of this protein family is PARP1 (ARTD1), which is involved, among other functions, in DNA repair mechanism as a DNA nick sensor and in apoptotic cell death. This has created a therapeutic strategy to treat cancer cells deficient in the repair of DNA double-strand breaks. 2
One subfamily of PARPs consists of two enzymes called tankyrases or TRF1-interacting ankyrin-related ADP-ribose polymerases 1 and 2 (PARP5a/ARTD5 and PARP5b/ARTD6, respectively). Tankyrases are multidomain proteins having four distinct characteristic domains ( Fig. 1 ): HPS domain, found only in tankyrase 1; ANK domain; SAM domain; and ART domain. 3 The HPS domain has an unknown function, the ANK domain consists of 24 ankyrin repeats and is responsible for the protein-protein interactions, and the SAM domain is required for the multimerization of the tankyrase itself. The catalytic ART domain ( Fig. 1 ) is the domain common to all PARPs. Tankyrases 1 and 2 share 83% overall sequence identity, and the sequence identity is even higher for the catalytic domains (94%).
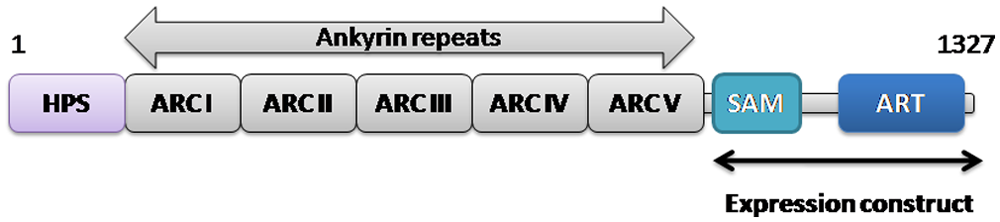
Domain organization of human tankyrase 1. The expressed recombinant fragment of the human tankyrase containing SAM and ART domains is indicated.
Tankyrases have fundamental, partially redundant, cellular roles, which justifies the increasing pharmaceutical interest in inhibiting human tankyrase. They have many binding partners and are able to PARsylate target proteins, including themselves, through automodification ( Fig. 2A ). Tankyrase 1 (PARP5a/ARTD5) interacts with TRF1, which binds and protects telomeric DNA and prevents telomerase activity. Tankyrase 1 PARsylates TRF1, which then dissociates from the telomeric DNA, leading to telomere elongation. 4 Elongated telomeres are associated with immortality of cancer cells, and therefore telomerase has been a target for drug development. 5 Overexpression of tankyrase 1 leads to elongated telomeres, 6 and its inhibition enhances the effect of telomerase inhibitors. 4
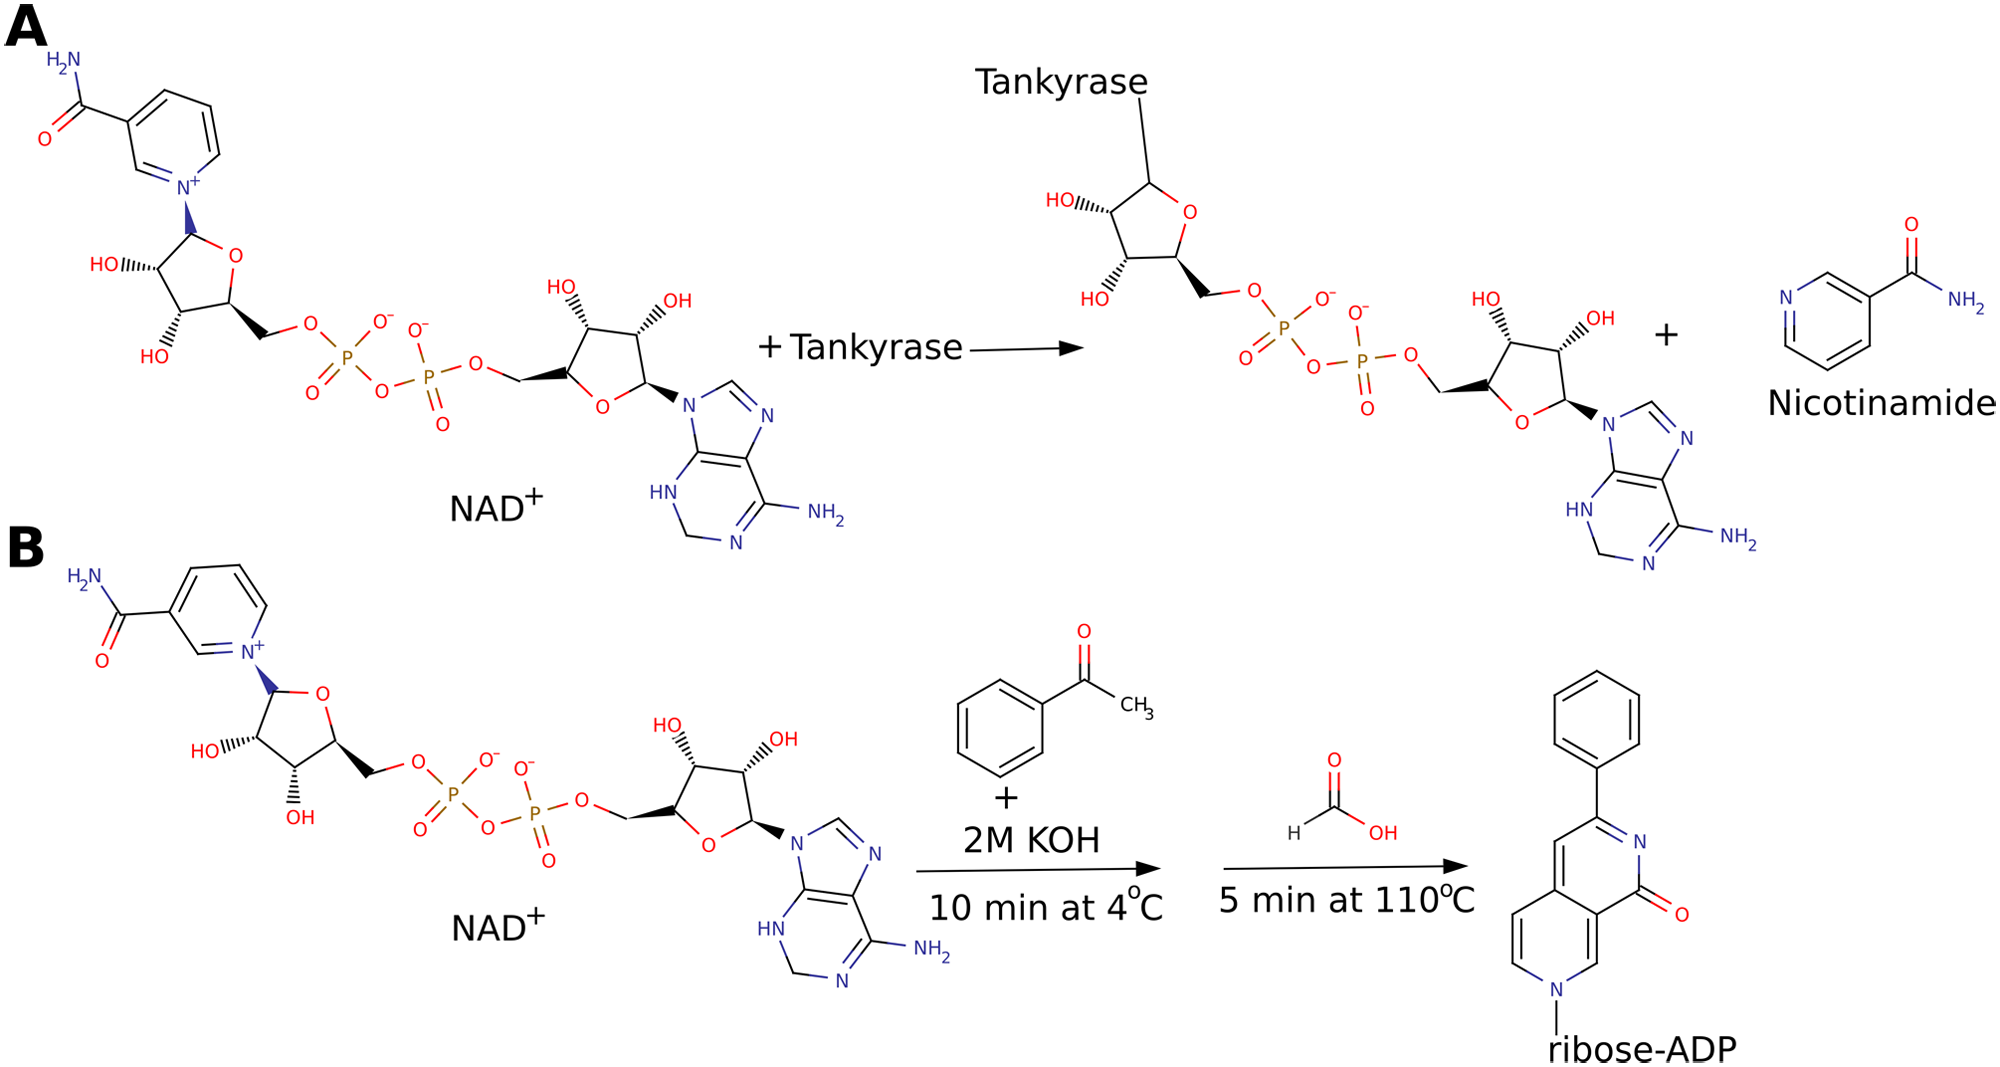
Enzymatic and chemical reactions. (
Both tankyrases are also involved in the modulation of the Wnt signaling pathway, which is often overactivated in cancers. The role of this pathway is to control the proteolysis of β-catenin by a destruction complex. β-Catenin is an oncoprotein that controls the expression of specific genes. Tankyrases PARsylate axin, leading to its proteolysis, and this way they control the stability of the destruction complex: Proteolysis of axin subsequently causes β-catenin stabilization. 7 As a therapeutic strategy, inhibition of tankyrase stabilizes axin, resulting in lower levels of β-catenin in the cell.
BRCA1/2-deficient cancer cells have impaired DNA repair mechanism, and inhibition of PARP1 is synthetically lethal to them. 2 This makes it possible to target only cancer cells of a certain type with PARP inhibitors. Tankyrase inhibition was recently shown to also induce selective lethality to BRCA-deficient cells, thus further expanding the therapeutic potential of tankyrase inhibitors. 8
This increasing evidence supports the relevance of tankyrase 1 as a target for cancer therapy and the need to identify new potent and selective inhibitors. Some assays have been developed in the past to monitor PARP activity. They involve the use of radiolabeled NAD+, 9 an antibody to ADP-ribose, 10 or biotinylated NAD+ (bioNAD+). 11 Particularly the in case of tankyrase 1, only two screening assays have been reported so far.12,13
In a cell-based method, 12 tankyrase 1 is overexpressed in yeast cells, and cellular growth after compound addition is monitored using WST-1 cell proliferation reagent (Roche, Basel, Switzerland) after adding the compounds to be screened. Overexpression of tankyrase 1 leads to a growth defect in yeast cells. Using this method, flavone was discovered as a tankyrase inhibitor, as it restored the growth. The second assay described for tankyrase is based on a colorimetric substrate and requires preparation of a modified substrate, ADP-ribose-pNP. 13 ADP-ribose-pNP is synthesized from commercially available NAD+. In this assay, protein is incubated with the substrate and the reaction is monitored by measuring absorbance at 405 nm during the reaction. The method is continuous, allowing the reaction to be followed. However, the substrate preparation and the requirement to use high concentrations of ADP-ribose-pNP to achieve a small absorbance signal limit the usefulness of the assay.
We describe here optimization of a homogeneous assay reported earlier for human PARP1 14 for screening of inhibitors of human tankyrase 1. The method is based on a chemical modification of NAD+ to a fluorescence analog ( Fig. 2B ).15,16 Although the nature of the assay makes it universal for NAD+-consuming enzymes, it has previously been described only for PARP1 of the human PARP family. 14 The method is based on a simple fluorescent readout and consists only of addition and incubation steps, which make it is easy to apply in manual and automated settings. Reagents are easily available with no need of customized components or expensive measurement units to conduct the screening runs. Thus, it offers practical advantages when compared with other described assays that rely on special reagents or on cell lines.
Materials and Methods
Protein Epression
An expression construct for the catalytic fragment of human tankyrase 1 consisting of the SAM and ART domains (1030-1317) was a generous gift from the Structural Genomics Consortium (Stockholm, Sweden). The plasmid, based on pNIC-Bsa4, contains a 6xhis-tag followed by a TEV protease cleavage site before the tankyrase sequence (MHHHHHHSSGVDLGTENLYFQ*SM). Plasmid was transformed to Escherichia coli Rosetta2 (DE3) cells. Overnight preculture (5 mL) in Terrific Broth (TB) media containing 34 µg/mL chloramphenicol and 50 µg/mL kanamycin was used to inoculate 4 × 750 mL of autoinduction TB media containing trace elements (ForMedium, Hunstanton, Norfolk, England) supplemented with 8 g/L glycerol and the same antibiotics. Cultures were incubated at 37 °C in shake flasks until culture turbidity (i.e., OD600 reached 1). Then, the cultures were moved to an incubator (set at 18 °C/180 rpm) and incubated overnight. After 15 h, cells were collected by centrifugation (4 °C, 5500 g, 10 min). Pellet was resuspended in lysis buffer (100 mM HEPES [pH 7.5], 500 mM NaCl, 10% glycerol, 10 mM imidazole, and 0.5 mM tris(2-carboxyethyl) phosphine [TCEP]), and solution was stored at −20 °C.
Protein Purification
Cell suspension was quickly thawed in warm water and 2 mM TCEP, 0.01% Triton X-100, approximately 0.2 mg lysozyme, and 250 U benzonase (Sigma-Aldrich, St. Louis, MO), and an ethylenediaminetetraacetic acid (EDTA)–free protease inhibitor tablet (Roche, Basel, Switzerland) was added. The suspension was sonicated on an ice-water bath for 25 min in total with a 50% duty cycle (Branson 250 Sonifier; Branson, Teltow, Germany). Solution was cleared by centrifugation (35 000 g, 20 min, 4 °C), and supernatant was filtered through 0.45-µm filters. Sample was loaded on a HisTrap HP column (GE Healthcare, Little Chalfont, Buckinghamshire, UK), which was preequilibrated with binding buffer at 4 °C (20 mM HEPES [pH 7.5], 500 mM NaCl, 10% [w/v] glycerol, 10 mM imidazole, 0.5 mM TCEP, 0.01% Triton X-100), and the column was washed with the same buffer. Next steps of purification were performed with an Äkta purifier (GE Healthcare) at room temperature. The column was washed with buffer containing 50 mM imidazole, and protein was eluted from the column with buffer containing 250 mM imidazole. Pooled fractions were loaded on a size exclusion column (Hiprep 16/60 Sepharyl S-100 HR or Superdex S-200 10/30; GE Healthcare) preequilibrated with gel filtration buffer (20 mM HEPES [pH 7.5], 500 mM NaCl, 10% [w/v] glycerol, 0.5 mM TCEP, 0.01% Triton X-100). Fractions were analyzed with sodium dodecyl sulfate–polyacrylamide gel electrophoresis (SDS-PAGE) and tested for tankyrase 1 activity. Protein was concentrated using VIVASPIN 20 concentrators (Sartorius Stedim biotech, Aubagne, France). Concentration of protein was measured using the extinction coefficient calculated from the sequence and absorbance at 280 nm. Protein preparations were divided to small aliquots, flash frozen in liquid nitrogen, and stored at −70 °C.
Activity Assay
The assay described earlier for PARP1 14 was adapted here to test the activity of the expressed recombinant tankyrase 1 fragment. This assay measures the substrate consumption by quantifying the remaining NAD+ through its chemical conversion to a stable fluorescent condensation product upon treatment by acetone and alkaline followed by heating in acidic conditions ( Fig. 2B ). Reaction was carried out on U-shaped black polypropylene 96-well plates (Greiner BioOne, Frickenhausen, Germany). The volume in the control (maximal signal) and reaction (minimal signal) wells was 50 µL, and they contained buffer and NAD+ (Sigma-Aldrich) (500 nM in most experiments) or buffer, NAD+, and tankyrase 1, respectively. The plate was kept at 25 °C, 300 rpm using the Biosan PST 100HL (Riga, Latvia) plate shaker during the enzymatic reaction. The plate was covered with an Amplate cover (Simport, Waltham, MA) throughout the enzymatic and chemical reaction. Original assay protocol was modified so that 20 µL of 20% acetophenone in ethanol was added in the fume hood before the addition of 20 µL 2 M KOH. After incubation, the plate was moved to 4 °C for 10 min. Next, 90 µL of 88% formic acid was added, and the plate was transferred to an oven set at 110 °C for 5 min. The plate was allowed to cool for 30 min at room temperature. The resulting fluorescent signal was measured with a Varioskan flash plate reader (Thermo Fisher Scientific, Waltham, MA) at an excitation wavelength of 372 nm and emission wavelength of 444 nm. Activity of the protein was registered by the decrease in fluorescence in the wells containing tankyrase 1 with respect to the control (maximal signal) wells.
Optimization of Assay Conditions
Conditions for the enzymatic assay were optimized by manually testing the effect of buffer components, including divalent cations, metals, reducing agents, and detergents, at different concentrations ( Table 1 ). The effect of pH and buffering reagents was studied by carrying out the reactions at 50 mM buffer. Effect of different NAD+ concentrations (50 nM to 5 µM) was also assayed, and their impact on assay performance was analyzed. Assays were carried out as described above, and separate controls were used for each condition. Control wells without enzyme were set to 0% conversion and wells without NAD+ to 100% conversion. The amount of protein used and the incubation time varied on due course, but the aim was to reach approximately 25% of NAD+ consumption to clearly distinguish the effect of different buffers and other reaction components. Tolerance of the enzymatic assay to DMSO was studied at a DMSO concentration ranging from 0.1% to 10%. Robotic compatibility of the assay also was tested. For that purpose, the initial addition steps leading to the enzymatic reaction were conducted using a Biomek 3000 liquid-handling workstation (Beckman Coulter, Brea, CA). After the incubation period at 25 °C, the rest of the steps were done manually.
Effect of Different Buffer Components for Tankyrase Activity
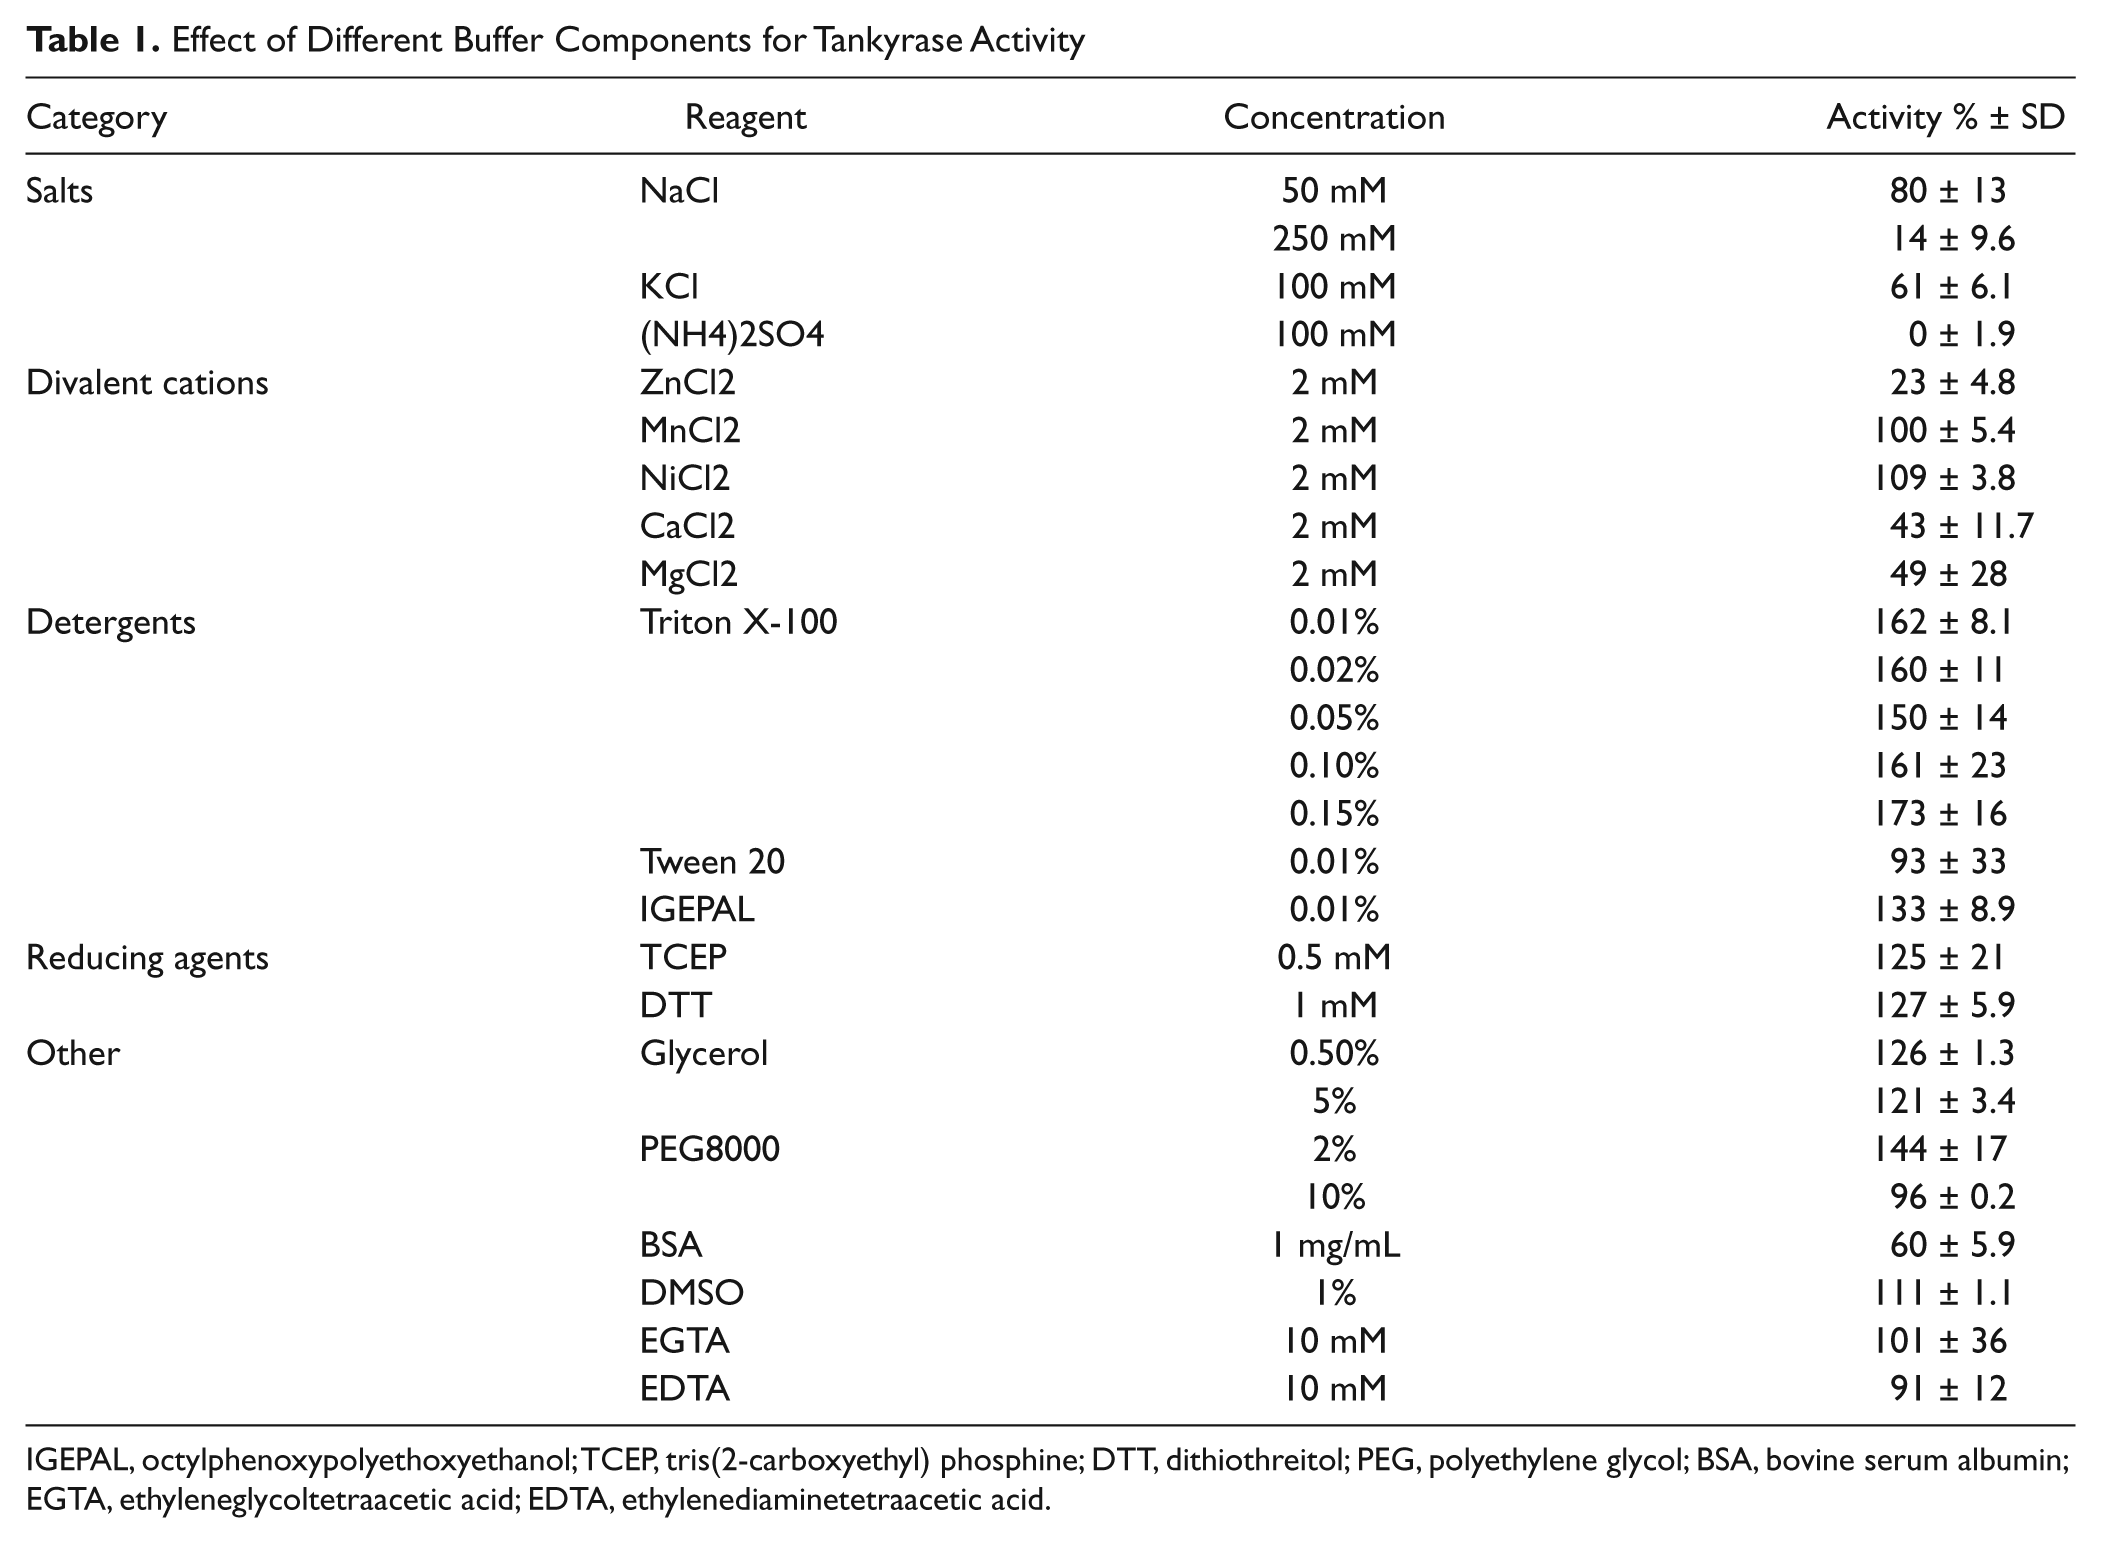
IGEPAL, octylphenoxypolyethoxyethanol; TCEP, tris(2-carboxyethyl) phosphine; DTT, dithiothreitol; PEG, polyethylene glycol; BSA, bovine serum albumin; EGTA, ethyleneglycoltetraacetic acid; EDTA, ethylenediaminetetraacetic acid.
Assay Repeatability
Typical variations of the maximal and minimal signals were measured to establish the precision of the assay. Maximal and minimal signal wells consisted of samples containing only NAD+ or NAD+ with tankyrase 1, respectively. To exclude potential positional effects on the plate given by possible evaporation gradients during the incubation periods, patterns of variations between wells were studied and well-to-well variations were quantified. Also, plate-to-plate and day-to-day variations were measured by testing two plates on the same day and two plates on different days, respectively. During these studies, the optimized assay conditions were applied and the same protein batch was used. The repeatability was done in manual conditions as well as with the aid of Biomek 3000, as described above.
Assay Accuracy: Potency Measurement
Inhibitory potency of a known tankyrase inhibitor of natural origin, flavone, was measured using 500 nM NAD+ and lower protein concentration (50 nM). Incubation time was set to 2 h so that the NAD+ consumption did not exceed 15%. Flavone concentrations ranging from 3.2 nM to 100 µM (with half log dilution step) were added to a 96-well plate in triplicates along with the buffer and NAD+ solution. The experiment was repeated three times, and each curve was fitted separately. Controls without enzyme were set to correspond to a 10-mM inhibitor concentration, and controls without substrate were set to correspond to a 32-pM concentration and included in the fitting.
Screening of Natural Products Library
Validatory screening was carried out with an in-house library of 142 low molecular weight (MW) natural compounds, ranging from 120 to 1700 Da with an average MW of 284 Da. The library has been built from compounds individually picked from different commercial sources: Sigma-Aldrich, ExtraSynthese (Lyon, France), and Carl-Roth GmbH (Karlsruhe, Germany). The collection contains around 25% of coumarins (simple coumarins and furanocoumarins), 23% of flavonoids (belonging to different subgroups; i.e., flavones, flavonols, flavanols, flavanones), 17% of organic acids (mostly aromatic, including phenolic acids, such as cinnamic acids), and 13% of other phenolic compounds. In addition, it contains a minor proportion of alkaloids (ca. 4%), terpenes (ca. 3%), and other organic compounds (ca. 12%). The list of compounds is provided in
Western Blot
The results of the homogeneous assay were confirmed with reactions carried out in parallel in a test tube using bioNAD+ as a substrate (Trevigen, Gaithersburg, MD). Enzyme was incubated with 1 µM bioNAD+ together with 10-µM compounds at room temperature for 3 h, after which the reaction was stopped by adding Laemmli sample buffer (Bio-Rad, Hercules, CA) and incubating the sample for 5 min at 98 °C. SDS-PAGE was run and gel was blotted onto a nitrocellulose membrane (Whatman, Maidstone, Kent, UK). Blocking was performed overnight with 1% casein (Bio-Rad). Proteins modified by bioNAD+ were detected using streptavidin-conjugated horseradish peroxidase (PerkinElmer, Waltham, MA).
Potencies of Hit Compounds toward Tankyrase, PARP1, and PARP2
The hit compounds were tested also with human PARP1 (Trevigen) and PARP2 (GST tag; BPS Bioscience, San Diego, CA) similar to the screening assay described above for tankyrase (
Statistical Analysis
The distributions of the control data (maximum and minimal signals) were studied using Kolmogorov-Smirnov (KS) and D’Agostino and Pearson omnibus normality tests to detect deviations from a Gaussian distribution. The potency values (IC50) were calculated using a nonlinear regression analysis (sigmoidal dose-response fitting with variable slope) with the following equation: Y = Bottom + (Top – Bottom)/(1 + 10(L
Results
Protein Purification
Protein expression was tested using different E. coli culture media (Luria Broth, 2xYT Broth, Super Broth, Terrific Broth) in small scale (200 mL) using isopropyl-β-D-thio-galactoside (IPTG) induction or autoinduction methods. 21 Terrific Broth autoinduction media gave the highest expression levels in small-scale culture tests as judged by SDS-PAGE analysis and therefore was used in the larger cultures. The protein was purified with affinity chromatography followed by size exclusion chromatography. Although the Ni-NTA purification already yielded pure protein, the second step was needed for the most active protein preparations. The second purification step increased the observed enzyme activity approximately fourfold. In the gel filtration, the main form of the 37-kDa protein eluted at a retention time corresponding to a MW of approximately 600 kDa, which is in agreement with the reported extended multimerization of tankyrases through the SAM domain. 22 For screening compounds at high concentrations (10 µM), the affinity-purified protein could also be used without the additional polishing step. During assay optimization trials, Triton X-100 also was added to the purification buffers. Yield of purified protein in the best case was 0.6 mg per liter of culture media.
Activity Assay Optimization
To select the best assay conditions, buffer type and other reaction components typically affecting enzyme activities were tested and analyzed based on the amount of substrate conversion at a given time. The protein activity was measured in different buffers with a pH range from 3.5 to 9. Tankyrase 1 was active from pH 5 to 8 and most active around pH 5.5 ( Fig. 3A ). We selected pH 7 for further experiments to ensure assay conditions that better reflected the properties of compounds tested in physiological conditions. Buffering agents also affected the protein activity, and tankyrase 1 was found to be most active when Bis-Tris propane was used ( Fig. 3B ).
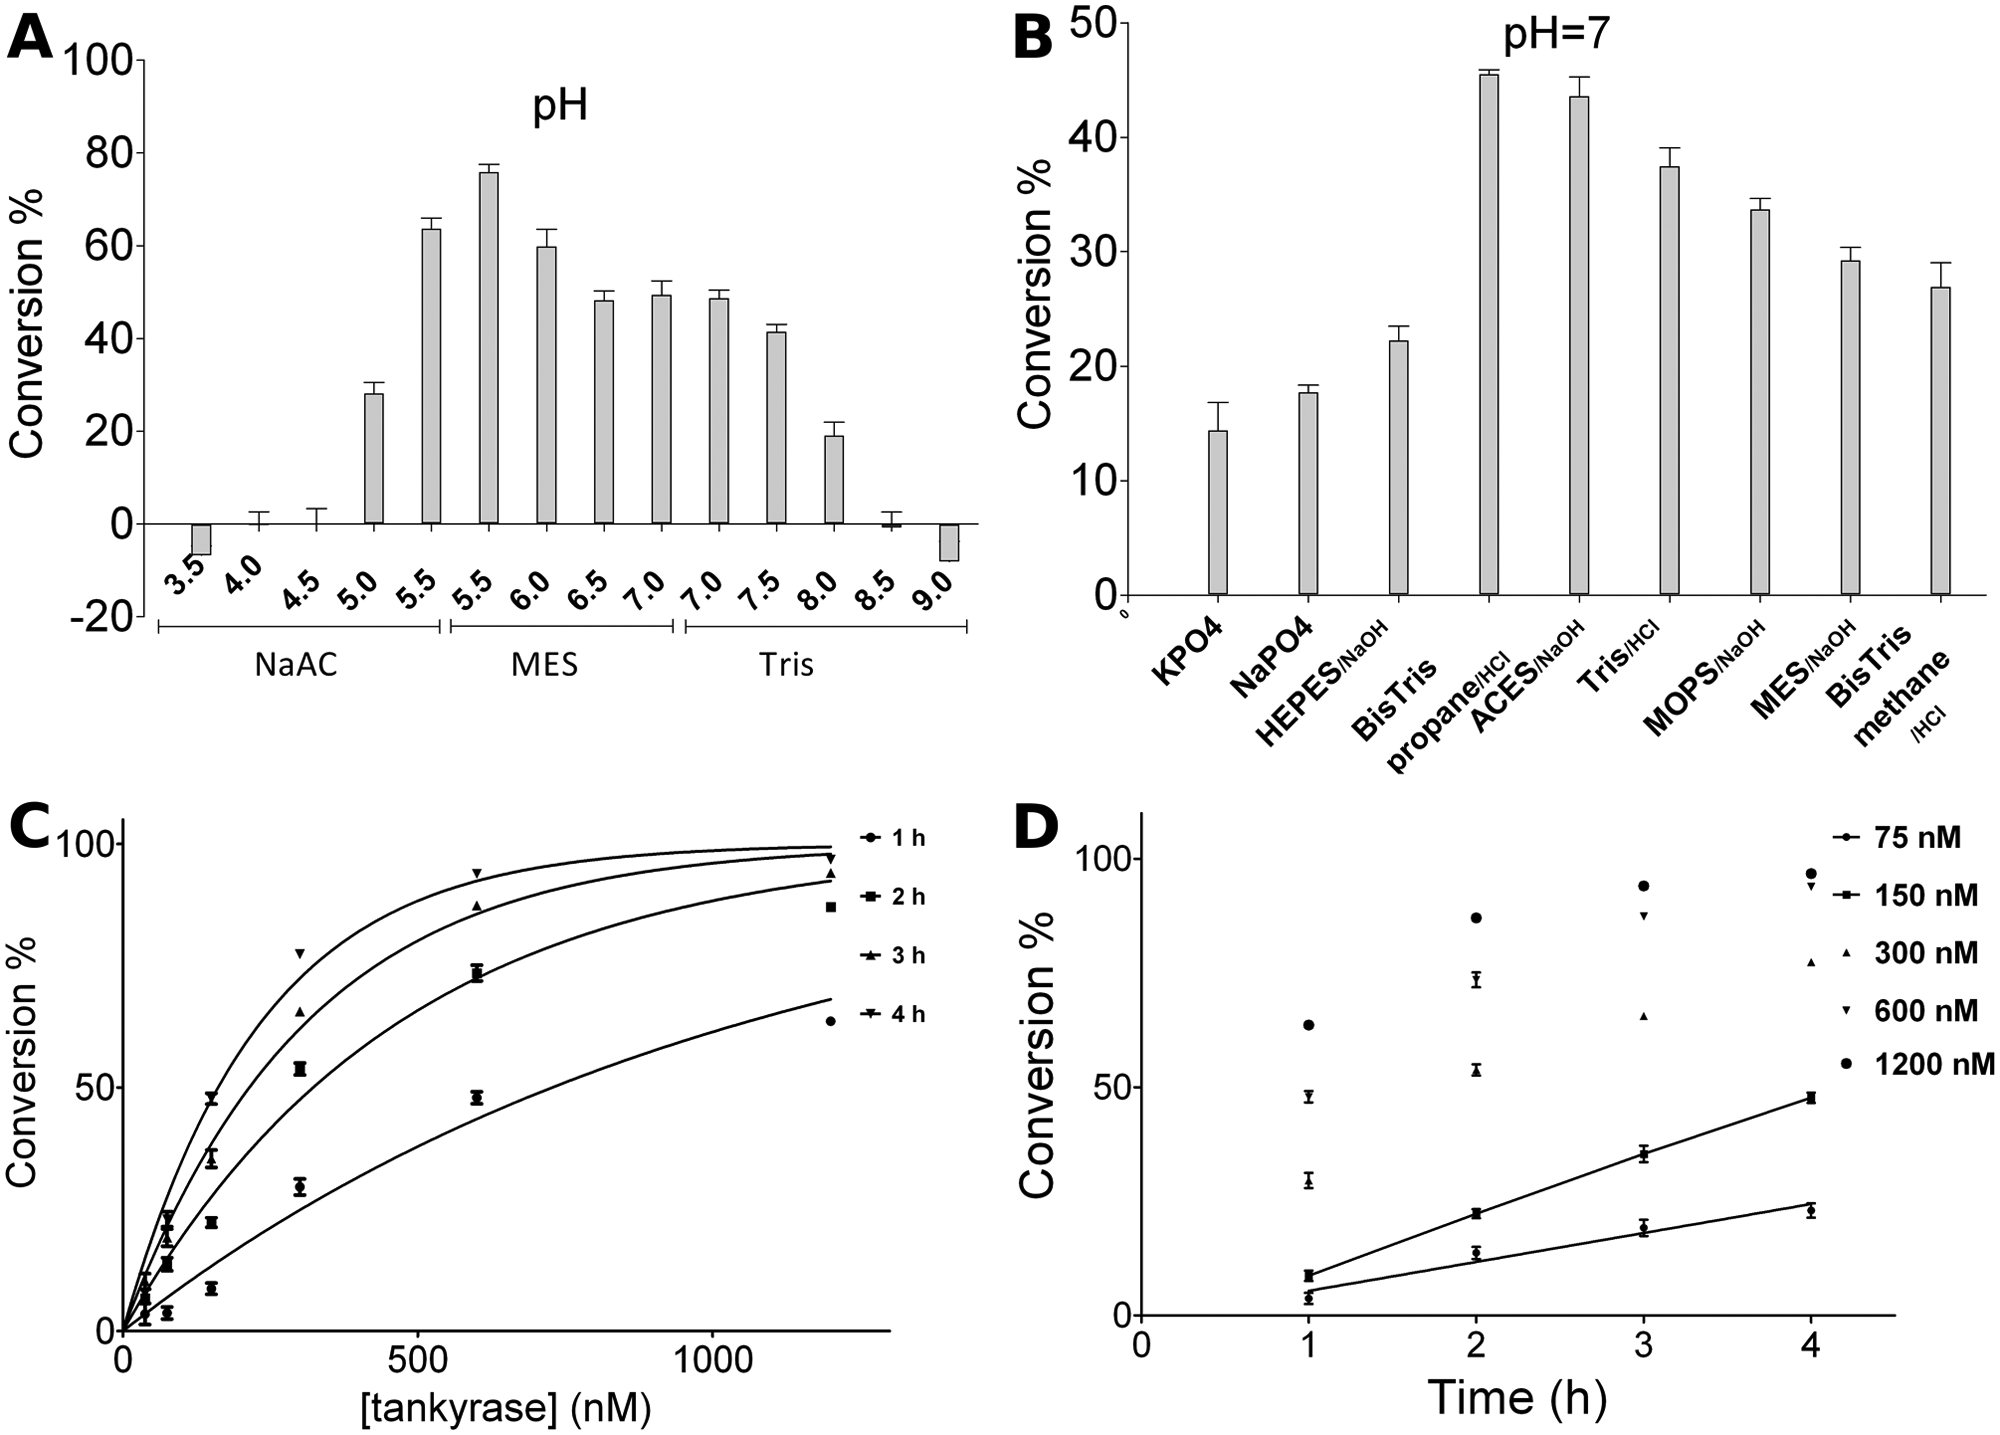
Optimization of the enzymatic reaction for screening. (
After selecting the Bis-Tris propane as the reaction buffer, the effect of different additive and reaction components was tested ( Table 1 ). Higher salt concentration was found to decrease the enzyme activity, and ammonium sulfate completely inactivated the protein. Divalent cations are known to be beneficial for PARP1 activation, but in the case of tankyrase 1, cations (Mg2+, Zn2+, and Ca2+) reduced tankyrase 1 activity. Notably, although tankyrase 1 is known to contain a zinc binding site within the ART domain, 23 zinc inhibited the enzyme, whereas EDTA did not have an effect on the activity at the concentration tested. Triton X-100 was found to significantly increase the enzyme activity even when added at a relatively low concentration ( Table 1 ). Subsequently, Triton X-100 was also added to the buffers used in purification. Igepal had a similar effect for the enzyme. Also, reducing agents increased the enzyme activity. From the stabilizing/crowding agents, PEG8000 was beneficial for the enzyme activity, but it drastically decreased the fluorescence signal of the chemical reaction and therefore was not used in further trials. Bovine serum albumin (BSA), typically used in enzymatic assays, decreased the activity. Tankyrase 1 activity was found to be stable over long incubation times of up to 4 h used in the screening assay, but dilution of the protein to low nM concentrations led to loss in the activity. The response was tankyrase concentration and time dependent ( Fig. 3C , D ). The rate of substrate conversion was found to be linear over time when the conversion was kept below 50% ( Fig. 3D ). It should be noted that in the present assay, tankyrase 1 acted as both the enzyme and the target protein for the modification. The final optimized buffer consisted of 50 mM Bis-Tris propane at pH 7, 0.01% Triton X-100, and 0.5 mM TCEP.
Assay Performance
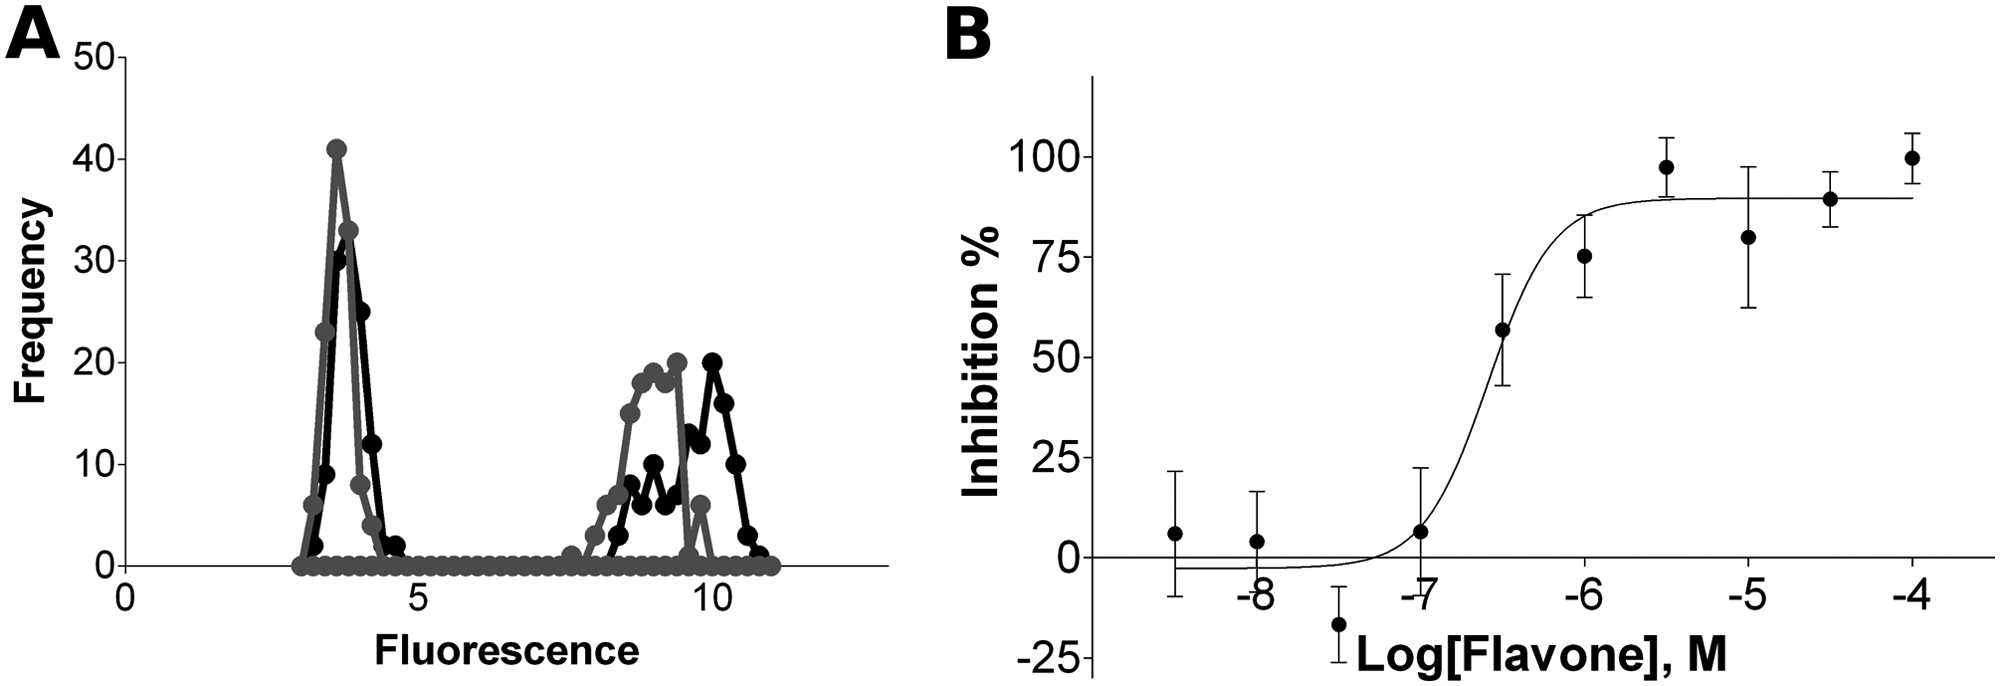
Assay performance was analyzed first by measuring plates containing only minimal and maximal signal. The behavior of control signals in a typical experiment run under the optimal conditions is shown in Figure 4A (black line). The signals generated by the manual assay were binomially distributed, and a good dynamic signal window was observed. Thus, a clear distinction between active and nonactive molecules can be achieved with this assay, which is particularly important for screening. The quality parameters obtained for the assay are summarized in Table 2 . The Z′ value registered for the manual assay was 0.72, giving an indication of a well-performing assay. 18 This high quality was maintained when different plates were prepared during the same day or on different days. Signal variations were low, as reflected by the maximal and minimal signal values measured between wells within the same plate. In particular, the incubation period did not cause edge effects, and no systematic trend across the plate was detected (results not shown). Overall, signal variation between wells did not exceed 6% ( Table 2 ). The concentration of NAD+ in the assay was 500 nM as it gave the best performance (Z′ > 0.7), but the assay was also found to be useful for screening even at 50 nM NAD+ (Z′ > 0.6). Signal variation was found to increase when higher substrate concentrations were used. Moreover, the assay performance was not affected when the assay reaction was conducted in a robotic environment (gray line, Fig. 4A ; Table 2 ). The combination of S/B and CVs achieved resulted in Z′ within the acceptable range for a screening assay (0.6).
Performance of the assay. (
Assay Performance in the Manual and Automated Reactions
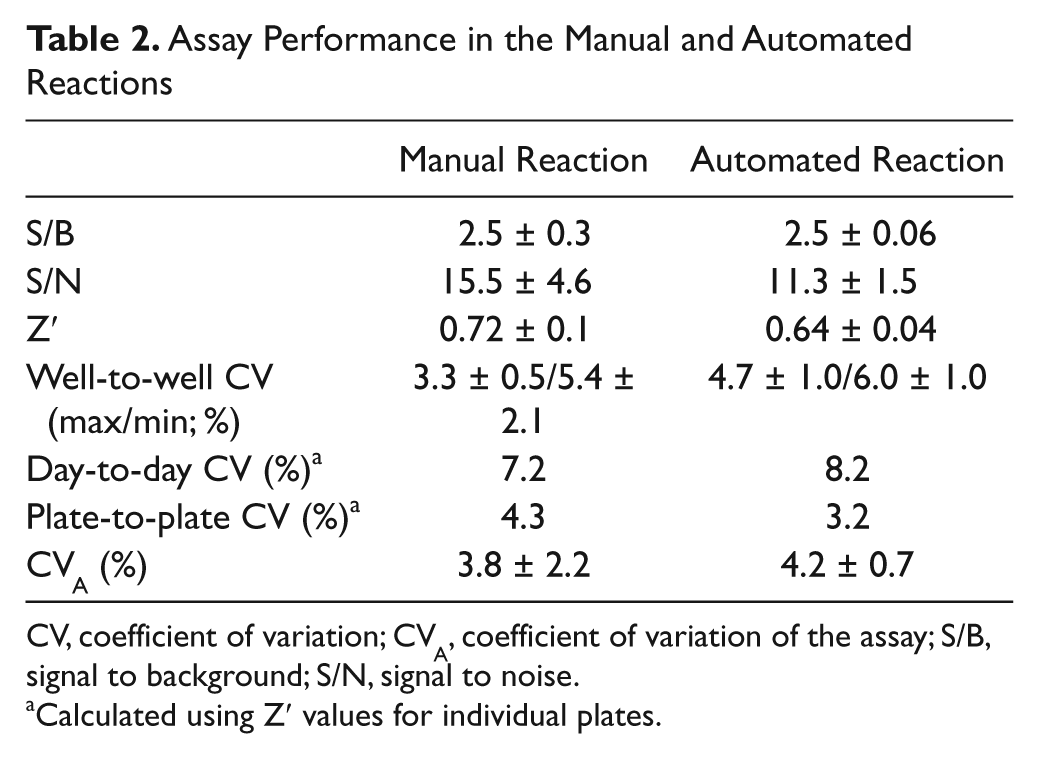
CV, coefficient of variation; CVA, coefficient of variation of the assay; S/B, signal to background; S/N, signal to noise.
Calculated using Z′ values for individual plates.
Chemical libraries are typically stored in DMSO, and therefore it is crucial to test the DMSO tolerance of the assay. The assay proved to tolerate up to 2% DMSO without significant change in the enzyme activity (results not shown), making the assay suitable for screening compounds even at concentrations over 100 µM.
The ability of the assay to provide reasonably good potency estimates was tested using flavone as a control compound. Half-inhibitory concentration (IC50) of flavone was determined for tankyrase 1 using the optimized assay. In this case, lower protein concentration was used and the conversion of the substrate was kept below 15% to achieve a reasonable signal and to minimize the effect of the decrease in substrate concentration to the reaction rate. The reactions were carried out three times and curves were fitted separately. Measured pIC50 value was 6.49 ± 0.19, which corresponds to an IC50 value of 325 nM ( Fig. 4B ).
Screening Results
A natural products library was screened at 10 µM concentration using the described assay (
Fig. 5A
). In total, 9 of 142 compounds showed fluorescence more than 1 × SD higher than the mean (
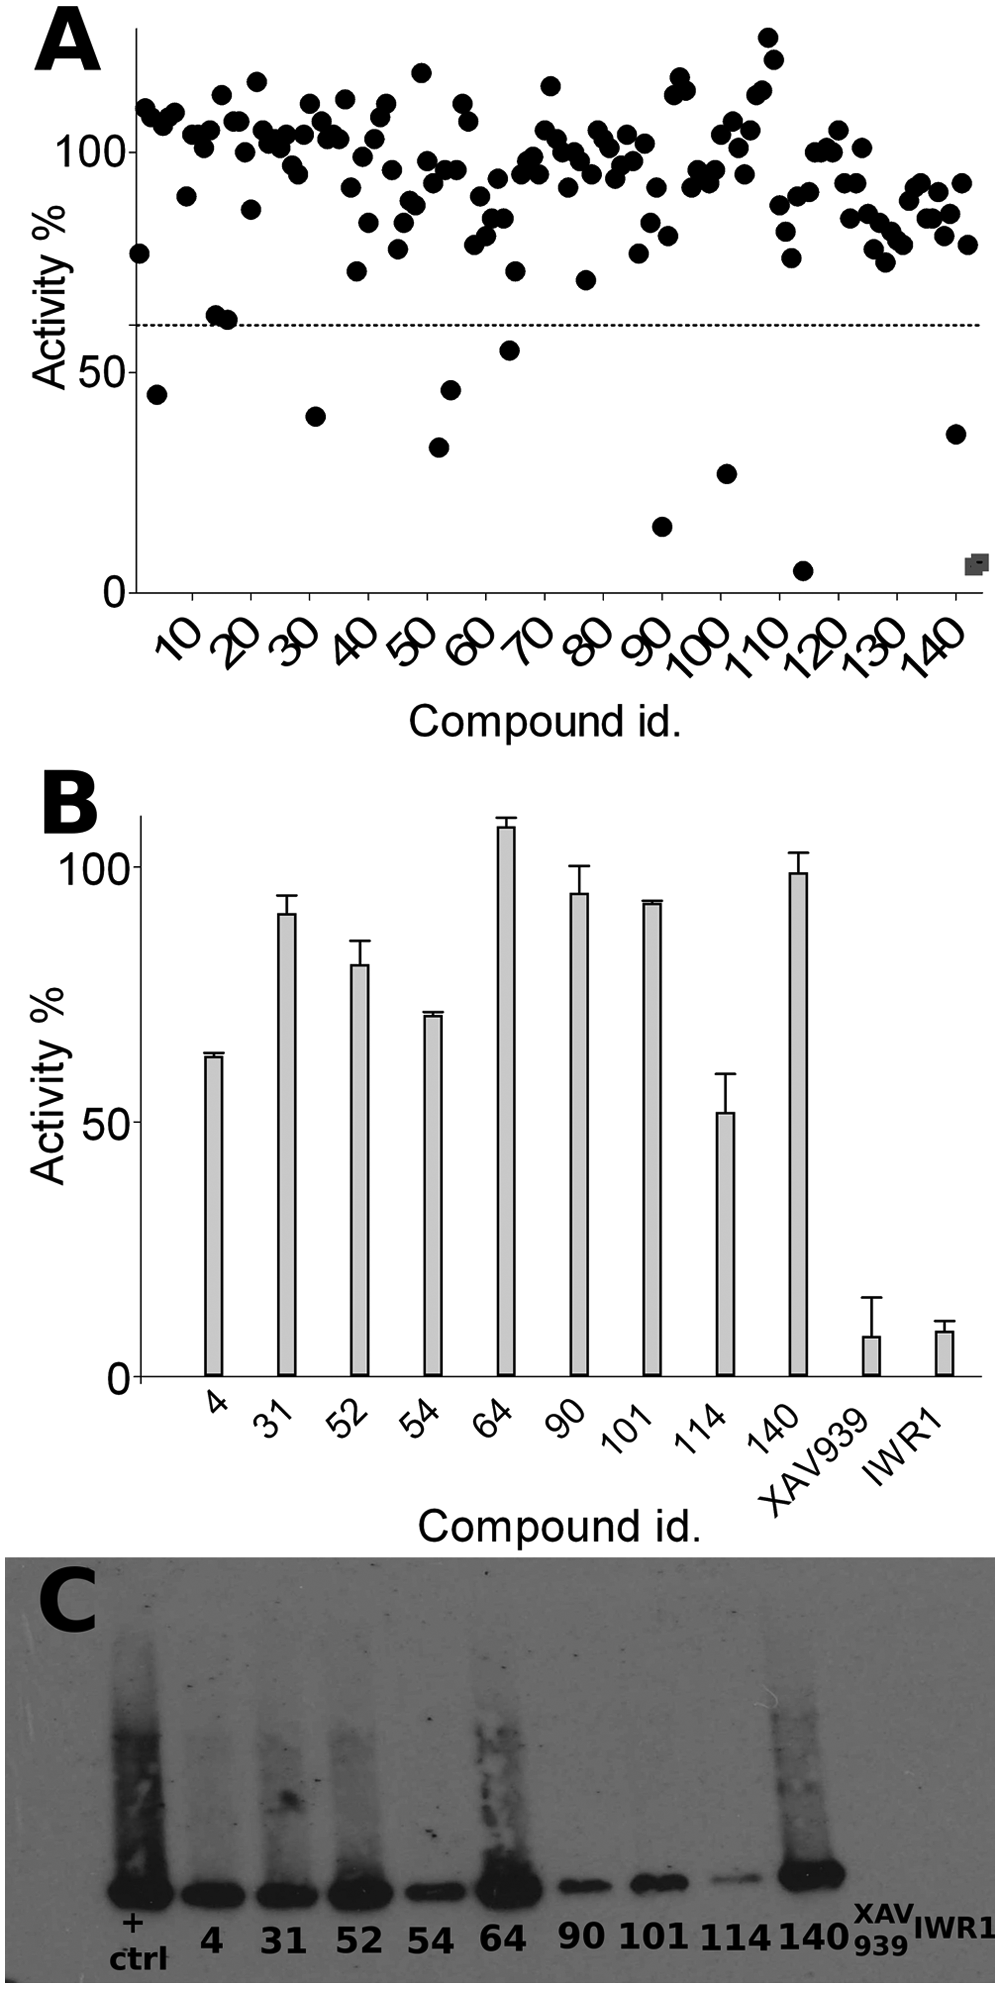
Validatory screening. (
Results of the fluorescence assay were also corroborated with reactions carried out using bioNAD+ and the Western blot technique (
Fig. 5C
). Western blot showed that although all compounds inhibited the PAR formation somewhat, flavone (
The most potent inhibitors identified for tankyrase were flavones apigenin (
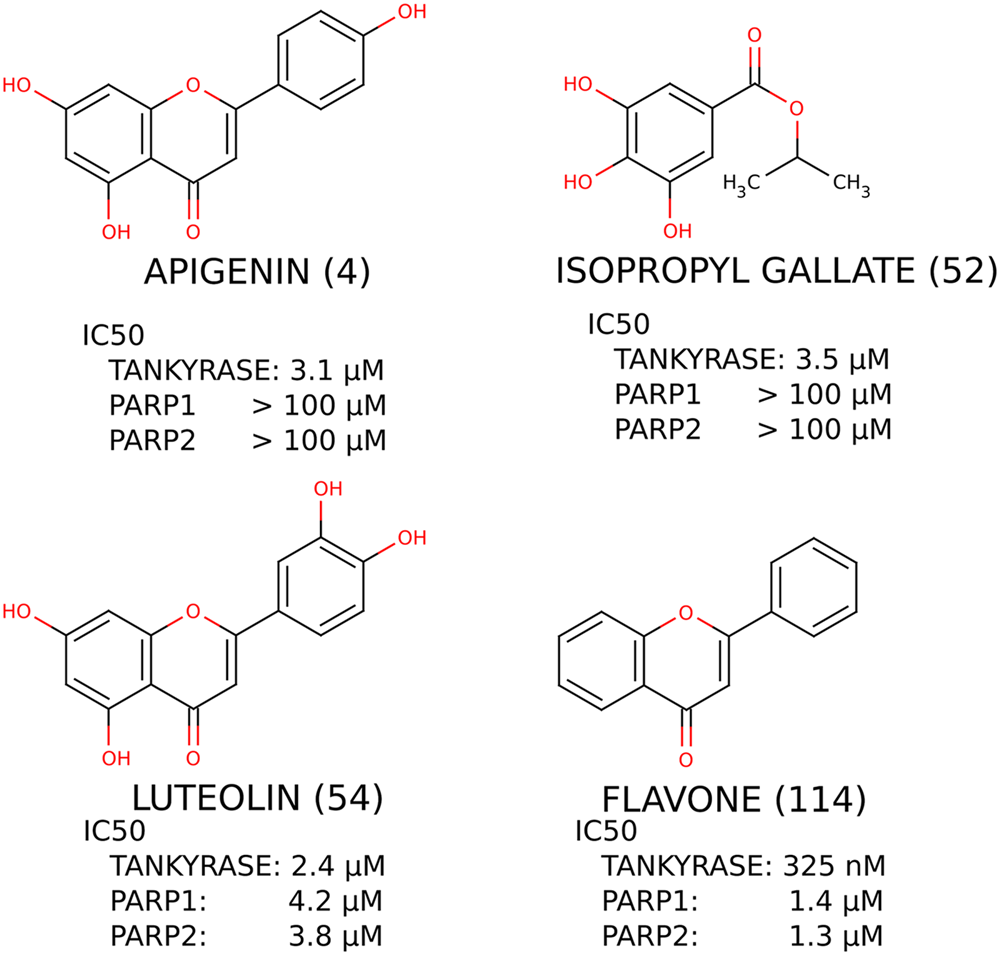
Structures of the most potent confirmed hit compounds, flavones and isopropyl gallate, with IC50 values measured for tankyrase, PARP1, and PARP2. Marvin was used for drawing chemical structures and reactions, Marvin 5.2.1_1, 2009, ChemAxon (http://www.chemaxon.com).
Discussion
Tankyrases are attracting increasing attention as targets for therapeutic drugs against cancer. In this contribution, we described an assay for screening tankyrase 1 inhibitors using compound libraries in a homogeneous plate format. We describe also an easy and efficient production and purification strategy for the catalytic fragment of human tankyrase 1, which is the similar fragment that is also commercially available for chemical screening. The assay is based, similar to the assay described earlier for PARP1, 14 on the automodification activity of tankyrase 1, so that tankyrase 1 acts as both an enzyme and a target protein. The chemical reaction is based on the principle that N′-methylnicotinamide, when treated with acetone and alkali followed by heating in acidic conditions, forms a highly fluorescent and stable compound.15,16
The assay conditions were optimized, and the highest activity for tankyrase 1 was obtained at pH 5.5. There is a notable difference between optimal conditions for tankyrase 1 and the “PARP buffer” used for measuring activity of human PARP1. Traditional PARP buffer contains Mg2+ and has a pH of 8.13,25 Tankyrase activity is low at this pH ( Fig. 3A ), and also addition of Mg2+ inhibited tankyrase activity. Furthermore, differences were detected between the buffering agents used at neutral pH. Phosphate buffer was an especially poor choice, but there were clear differences also between organic buffers ( Fig. 3B ). Addition of Triton X-100 and a reducing agent showed an increase in tankyrase activity. After optimization, the final buffer used for the assay and screening of compounds was 50 mM Bis-Tris propane (pH 7) containing 0.01% Triton X-100 and 0.5 mM TCEP.
Assay performance was analyzed using control plates done manually and with a pipetting robot. Signals were normally distributed in both cases, and the statistical parameters proved that the assays were robust, as judged in particular from the screening window coefficient (Z′) values. This parameter basically depends on two elements: the amplitude between the signals (given by the S/B ratio) and the signal variations (given by their standard deviations). A good Z′ value is typically the result of having high S/B and low CVs of the signals. Higher S/B values usually permit higher CVs, which is advantageous because it is generally expected that CVs are higher than 5% in most experimental settings. Consequently, to achieve recommended Z′ values (above 0.5), the S/B ratio should be higher than 1.9. 26 In this assay, the S/B value obtained in both assays (manual and robotic) was higher than 2.5, thus potentially permitting higher CVs without affecting the assay quality. However, the signal variations were kept well below 10%, and thus they positively contributed also to the overall quality of the assay.
It is important to point out that, to achieve this high-quality performance, it was necessary to adjust the incubation time so that more than half of the substrate was consumed in the enzymatic reaction. This is mainly due to the detection of a decreasing signal, but it requires relatively long incubation times of hours, even with the high enzyme concentrations used. Despite this, this feature of the method does not drastically limit the screening throughput because even if the reactions are conducted manually, it is possible to screen hundreds or thousands of compounds per day.
To evaluate the usefulness and accuracy of the assay in providing potency estimates, a known tankyrase inhibitor, flavone, was tested. The potency value of 325 nM is in agreement with the effect of flavone on the growth of yeast cells overexpressing tankyrase and the amount of PAR in yeast cell lysates. 12 The limitation of using the automodification reaction for potency measurements is the requirement of using high protein concentrations (50 nM), which makes the potency measurements of tightly binding inhibitors, such as XAV939, inaccessible. To minimize the effects of substrate consumption, the substrate conversion needs to be kept low, which decreases the observed signal. It is possible to increase protein concentration or incubation time to overcome this if it is beneficial for the measurements. The reactions can be carried out with very low (500 nM) concentrations of the substrate, which makes the assay very sensitive for competitive inhibitors. The Km value for tankyrase has been reported to be 0.085 to 1.5 mM.13,25 Although there is a large difference between the measured values, this means that according to the Cheng-Prusoff equation, the measured IC50 value very closely corresponds to the Ki, making it possible to compare potencies directly between isoenzymes. 27 The difference between the IC50 value and Ki is less than 1% as substrate concentration is at least 100 times lower than Km.
To test the performance of the assay in a real experimental setting, we performed a validatory screening using an in-house natural product library. The rationale of using a natural product library lies in the well-known fact that natural products are an invaluable source for new types of scaffolds that can serve as inspirational leads to develop new protein inhibitors. 28 The library also contained flavone as a known tankyrase inhibitor. The fluorescence-based assay was used to identify hit compounds that were then confirmed with a secondary low-throughput assay (Western blot). The hit limit was set at a lower value (2 × SD) to get more hit compounds in the initial stage of the screening. Selecting two times the SD as a “cutoff” value allows excluding from the hits the majority (95.2%) of the expected normal variation of the values around the maximal signals, provided that the data are normally distributed. To ensure less false positives, three times the SD is usually set as the hit limit, but depending on the library size as well as other elements, this threshold can be set at other values, always with the final goal of identifying a reasonable amount of hits. As we used a small library, we decided to keep the limit at 2 × SD. This is also supported by the need to find new tankyrase 1 inhibitors. Three of the most potent hit compounds showed selectivity for tankyrase over isoenzymes PARP1 and PARP2, indicating that they could provide ideas in the future for further development of selective tankyrase inhibitors ( Fig. 6 ). The molecular shape of flavone resembles the control compound, XAV939, which is a potent tankyrase inhibitor displaying selectivity over the isoenzymes. However, flavone is lacking the hydrogen bond donor generally thought to be required for a PARP inhibitor. Structural studies are therefore needed to verify the binding mode of flavone to tankyrase and to explain the structure-activity relationship.
Previous reports of tankyrase assays have been scarce, and they have not included analysis of the assay variability, which makes it difficult to evaluate the usefulness of the assays for screening. In general, PARP inhibitor assays require special reagents such as colorimetric modification of the substrate NAD+, bioNAD+, or radiolabeled NAD+. The assay we described here for tankyrase 1 uses commonly available reagents that are inexpensive, especially in comparison with commercialized reagent kits (e.g., from BPS Bioscience). In addition, the protein used for the assay can be produced with E. coli as the host organism, and it can be purified to homogeneity with a single affinity purification step and without the need of any special equipment. Moreover, in contrast to other assays, the method does not require any washing steps, although it does require the use of organic solvents, thus imposing the need for basic measures of chemical safety (i.e., conducting the reaction in a fume hood).
The only two screening assays described for tankyrase 1 so far are based on a colorimetric substrate variant 13 and a yeast cell–based screening system. 12 As described earlier, in the colorimetric method, the measurement could be done at any point, but the signal observed is not as robust as with the fluorescence method due to the background. On the other hand, the cell-based method uses yeast strains for expressing human tankyrase 1, and it screens for compounds that can protect the cells against the tankyrase 1–induced growth arrest. This assay provides early information regarding the bioavailability of compounds that may eventually become drugs. However, as it is a whole cell–based assay, it could potentially detect nonspecific hits that can protect the cells by mechanisms other than tankyrase 1 inhibition. Therefore, taking these elements together, we believe that the assay described here is advantageous basically because of its high simplicity, feasibility, low cost, high DMSO tolerance, high throughput, and adequate compatibility with automated environments. We also have proven the feasibility of the assay to find potent tankyrase inhibitors, which are needed to evaluate their potential use in cancer therapy.
Footnotes
Acknowledgements
The authors would like to thank Robin Sundström and Yves Nkizinkiko for help with protein purification.
The authors declared no potential conflicts of interest with respect to the research, authorship, and/or publication of this article.
The authors disclosed receipt of the following financial support for the research, authorship, and/or publication of this article: Work was funded by the Academy of Finland [grant no. 128322]. M.N. is supported by the National Graduate Programme in Informational and Structural Biology. A.F. and P.V. acknowledge the support from the Drug Discovery and Chemical Biology Network of Biocenter Finland.
References
Supplementary Material
Please find the following supplemental material available below.
For Open Access articles published under a Creative Commons License, all supplemental material carries the same license as the article it is associated with.
For non-Open Access articles published, all supplemental material carries a non-exclusive license, and permission requests for re-use of supplemental material or any part of supplemental material shall be sent directly to the copyright owner as specified in the copyright notice associated with the article.