
Abstract
For many novel epigenetics targets the chemical ligand space and structural information were limited until recently and are still largely unknown for some targets. Hit-finding campaigns are therefore dependent on large and chemically diverse libraries. In the specific case of the histone methyltransferase G9a, the authors have been able to apply an efficient process of intelligent selection of compounds for primary screening, rather than screening the full diverse deck of 900 000 compounds to identify hit compounds. A number of different virtual screening methods have been applied for the compound selection, and the results have been analyzed in the context of their individual success rates. For the primary screening of 2112 compounds, a FlashPlate assay format and full-length histone H3.1 substrate were employed. Validation of hit compounds was performed using the orthogonal fluorescence lifetime technology. Rated by purity and IC50 value, 18 compounds (0.9% of compound screening deck) were finally considered validated primary G9a hits. The hit-finding approach has led to novel chemotypes being identified, which can facilitate hit-to-lead projects. This study demonstrates the power of virtual screening technologies for novel, therapeutically relevant epigenetics protein targets.
Introduction
Epigenetics may be defined as the study of any potentially stable and heritable change in gene expression or cellular phenotype that occurs without changing the underlying DNA sequence. 1 Covalent modifications of DNA and histone proteins and the mechanisms by which these spatiotemporal patterns influence chromatin structure and networks of gene expression are the main focus of today’s research in epigenetics.
Epigenetic modifications are produced by the “writers,” the proteins that recognize them (the “readers”), and the “erasers,” which remove the modifications.2,3 This description, commonly referred to as the “histone code hypothesis,” has helped to categorize the enzyme families that are involved in the chromatin regulation within cells. Among the “writers” of the histone code, the protein lysine methyltransferases (PKMTs) and protein arginine methyltransferases (PRMTs) have received the greatest attention because histone methylation is an essential function in many biological processes, including gene expression and transcriptional regulation, heterochromatin formation, and X-chromosome inactivation. 4
Over recent years, a significantly increasing amount of data suggest that the enzymatic activities of proteins from both of these enzyme families play significant roles in cancer, inflammation, and neurodegenerative diseases, implicating vast interest for the drug discovery efforts within the pharmaceutical industry.5-10
PKMTs and PRMTs catalyze the methylation of lysine and arginine residues. Similar to other druggable target classes like protein kinases, the PKMTs and PRMTs also share a common mechanism of catalysis, whereby the co-factor S-adenosyl-L-methionine (SAM) is the donor for the transfer of a methyl group to a nitrogen atom of either a lysine or arginine side chain. 11 The numbers of family members for the PKMTs and PRMTs that are encoded in the human genome have been estimated to be 52 and approximately 10 to 50, respectively. 12 For subsets of proteins with significant structural similarity, such as the SET domain histone methyltransferases (HMTs), this allows the application of target family–based approaches for the design of compound libraries, assay development, and thus targeted drug discovery.
Despite the significant interest in HMTs as potential drug targets, there are only a small number of inhibitors known and described in literature. 12 A natural product isolated from Streptomyces spp., the SAM analogue sinefungin has been one of the first nonselective HMT inhibitors identified. 13 Virtual screening and validation of PRMT1 inhibitors have been successfully applied using a PRMT1 homology model against the arginine binding site. 14 The first drug-like and selective HMT inhibitors were CARM1 inhibitors described by Allan et al., 15 but activity of these inhibitors in cell-based assays has yet to be shown.
BIX-01294, an inhibitor of the HMT G9a with an IC50 = 1.6 µM, has been found to bind to the protein substrate binding site of the target, explaining the noncompetitive behavior compared to SAM. 16 The compound has been identified in a high-throughput screening (HTS) campaign of 125 000 compounds and shows selectivity against other SET domain HMTs such as SETDB1 and SETD7. It has also been demonstrated that BIX-01294 reduces the H3K9me2 (histone H3 lysine 9 dimethylation) levels in mammalian cells. The quinazoline-based scaffold of BIX-01294 has been further optimized by structure–activity relationship (SAR) exploration with the support of X-ray co-crystal structures, leading to the discovery of UNC0224. 17 The more potent picomolar G9a inhibitor UNC0321, recently described by Liu et al., 18 resulted from the aim to generate tool compounds for further understanding of the biological function of G9a and its role in chromatin remodeling.
G9a (EHMT2; KMT1C) represents a well-characterized example for the HMT family of lysine methyltransferases.19,20 G9a is a SET-domain containing histone methyltransferase that specifically mono- and dimethylates histone 3 at lysine 9, H3K9,21,22 and other protein targets, 23 including a conserved methylation motif with marked sequence similarity to H3 in G9a itself. 24 Methylation at H3K9 marks important events in epigenetic signaling, which lead to transcriptional silencing. For G9a, co-repressing25-29 and co-activating 30 functions have been described.
A functional correlation of G9a activity and cancer progression has been postulated, and a correlation of G9a overexpression and lung cancer metastasis has been described. 31 Knockdown of G9a in PC3 cancer cells induces reduced growth, centrosome disruption, and chromosome instability. 32 Evidence for G9a-dependent epigenetic silencing of tumor suppressor genes in human breast cancer was published for MDA-MB-231 cells. 33
Virtual screening (VS)34-39 encompasses a wide range of computational methods for selecting compounds that are predicted to be active in hit-finding campaigns. The impact of VS in drug discovery projects and its benefit compared to, for example, random HTS has been the topic of controversial discussions.40-42 Nevertheless, there is clear evidence that VS has contributed to compounds that have reached the clinic and the market. 40 There is consensus that the success of VS is hard to predict and that it is difficult to gauge a priori which VS method is best suited for a particular project situation. 35 In general, it is believed that parallel use of various VS approaches promises higher success.
VS approaches can be classified into structure-based VS (SBVS) and ligand-based VS (LBVS) methods. SBVS typically uses docking algorithms to place compounds into the 3D structure of a protein binding site of interest, thereby generating 3D conformations (poses) predicting the bioactive protein-ligand complex. Subsequently, these poses are scored and subjected to postprocessing procedures, to identify the compounds that are most likely to be active (see the review by Klebe 43 for an in-depth overview and discussion of the state-of-the art and unresolved problems of SBVS).
The starting points for LBVS are the structures of known active compounds. LBVS includes a large portfolio of machine learning and chemoinformatics methods. 44 Despite their known limitations, fingerprint-based similarity searches are the most commonly applied LBVS methods, 45 along with 3D pharmacophore search methods. 46 Here, known active compounds are used as queries that are searched against compound databases. It has been argued that even if the target structure is available and suitable for SBVS, the application for LBVS methods can complement a SBVS campaign. 37 Given that, we have based our VS strategy on a selection of SBVS and LBVS approaches.
Several crystal structures of the catalytic domain of G9a have been solved,18,47 offering the opportunity to apply SBVS in G9a hit-finding campaigns. Starting points for LBVS for G9a include the nonselective SAM competitive inhibitor S-adenosyl-homocysteine (SAH) and selective substrate competitive inhibitors BIX-01294 (diazepinyl-quinazolinamine derivatives), UNC0224, and UNC0321.16-18
In this report, we describe a case study for finding new inhibitors of G9a, including assay development of two orthogonal assays, computational compound selection of a small screening deck tailored for G9a, followed by screening and follow-up characterization of the initial hits. Primary screening of the selected 2112 compounds in a radiometric FlashPlate assay and validation of hit compounds by both a G9a fluorescence lifetime (FLT) assay and the radioactive readout were employed. Hits were classified with respect to the different virtual screening methods for validating the selection approaches applied.
Materials and Methods
Biochemical Assays
FlashPlate assay
For the radiometric FlashPlate assay, full assay development was carried out, including determination of optimal enzyme and histone H3.1 concentrations, SAM KM,app, DMSO tolerance, reaction time, and sensitivity to reference inhibitors. The G9a reaction was performed in a 50-µL reaction volume in 384-well polypropylene plates (Greiner Bio-One, Monroe, NC). The assay buffer used was 50 mM Tris-HCl (pH 8.8), 5 mM MgCl2, 4 mM dithiothreitol (DTT), and 2% DMSO. Final assay conditions in the screen were 1.3 nM G9a (BPS Bioscience, San Diego, CA), 0.5 µM 3 H-SAM (PerkinElmer, Waltham, MA), 2.5 µM unlabeled SAM (Sigma, St. Louis, MO), and 50 nM full-length histone H3.1 (BPS Bioscience) incubated for 90 min at room temperature. The reaction was stopped by an excess of unlabeled SAM and then transferred to FlashPlates (PerkinElmer). Plates were incubated for >4 h at 4° C and washed once with 0.1% Tween-20 washing buffer, and scintillation of bound product was measured in a TopCount reader (PerkinElmer). The assay was validated with two SAM-competitive reference compounds: SAH (Sigma) and sinefungin (Sigma).
Fluorescence lifetime assay
For the FLT-based screen, a G9a-specific FLEXYTE assay, developed by Almac (East Lothian, UK), was used. This approach uses a site-specifically modified peptide substrate with the long-lifetime fluorophore 9-aminoacridine. 48 The HMT reaction is coupled to a proteolytic cleavage step by Endo-LysC, where lysine methylation is masking the endoproteolytic cleavage site. 49 The assay is configured such that methylation by G9a is reported through a decrease in the fluorescence lifetime, with a change in fluorescence lifetime of ~5 ns between substrate and product. The G9a reaction was carried out in a 25-µL reaction volume in 384-well black polystyrene plates (Greiner Bio-One) for 120 min at room temperature. The assay buffer consisted of 20 mM Tris-HCl (pH 8), 25 mM NaCl, 0.025% Tween-20, and 1 mM DTT. Final assay conditions in the screen were 7.9 nM G9a (BPS Bioscience), 5 µM unlabeled SAM, and 1 µM peptide substrate (Almac). Cleavage by Endo-LysC (2 nM final concentration) was performed for 20 min. FLT measurements were performed using a NanoTaurus plate reader (Edinburgh Instruments, Livingston, UK).
Computational Compound Selection
A total of 2112 compounds, corresponding to six assay plates containing 352 cherry-picked samples each, were selected using complementary VS approaches. The entire BioFocus compound collection comprising approximately 900 000 compounds was used as a pool for the selection. Various VS methods were applied in parallel, and the results were subsequently merged. The VS campaign comprised ligand-based virtual screening methods, including pharmacophore graphs, and an integrated toolkit of chemoinformatics methods for identification of compounds that are chemically similar or related to known actives. Furthermore, SBVS, by means of docking, followed by postprocessing of the docking poses, was performed. Thresholds and parameters have been selected such that the three groups of approaches (docking, pharmacophore graphs, chemoinformatics toolkit) produced roughly the same number of prioritized compounds. Details are given in the sections below.
Ligand-based VS: pharmacophore graphs
For all ligand-based VS approaches, the 2D structures of SAH and two quinazoline derivatives (BIX-01294, UNC0224) that bind to the substrate binding pocket16,17 were used as query structures for all searches. DiscNgine’s Chemistry Collection (version 1.0.3; DiscNgine, Romainville, France) features pharmacophore graph searching methods that resemble the concept of feature trees 50 but also incorporate newer extensions such as graph reduction methods. 51 Pharmacophore graphs are abstractions of 2D molecules that represent molecules as unrooted trees. Groups of atoms are condensed into molecular features such as donors, acceptors, aromatic moieties, and so on. These features or pharmacophores form the nodes of the trees; together with the edges, these graphs can be considered generic 2D pharmacophores. Graph-theoretical methods allow researchers to rapidly compare different trees and to perform similarity searches against a vast compound database. The Pipeline-Pilot implementation of this package was employed using default settings against the three query structures. All hits with a “best score” ≥ 0.5 (DiscNgine default scoring function) were kept and subjected to postfiltering.
Postfiltering has been implemented such that compounds with high similarity to any of the query structures were prioritized but not exclusively considered. Rather than taking only a predefined number of top-ranked compounds into consideration, compounds were chosen from three similarity ranges: ]70;100], ]60;70], and ]50;60] (similarity values s are given in %; the bracket annotation ]60;70] corresponds to 60 < s ≤ 70). The ]70;100] similarity range comprised 7 compounds, all of which were accepted. From 252 compounds in the ]60;70] range and 2915 compounds in the ]50;60] similarity range, only chemically diverse subsets of 200 and 300 compounds were selected, respectively. In this way, a total of 507 compounds were selected, representing a graded similarity selection.
Ligand-based VS: integrated chemoinformatics-based toolkit
The three query structures used in the pharmacophore graph searches were also used for various similarity searches that are also often used in the context of hit expansion. All methods have been seamlessly integrated in and executed from within PipelinePilot. Selection methods included the following:
Fingerprint-based similarity searches using multiple fingerprints (MACCS, FCFP_6, FCFC_4) and Tanimoto metrics
TurboSim two-step similarity searches 52 with various fingerprint sets as given above
Substructure searches using the Murcko scaffolds 53 of the query structures
Substructure searches using virtualized query structures generated from SMARTS-based ring generalization rules
Similarity searches as outlined above using virtualized query structures generated from SMIRKS-based ring assembly modification rules
Substructure and similarity searches as above using bioisosteric enumerations as query structures. Published transformation rules, 54 as implemented in PipelinePilot, were used.
The merged list of results comprised a total of 4275 compounds that were found by at least one of the search methods.
In a similar manner to the postprocessing of the pharmacophore graph results, the hits found with the chemoinformatics toolkit searches were postfiltered as follows: Four subsets were defined, and depending on the assumed relative importance, diverse subsets were selected from each of those subsets, resulting in a total of 736 compounds selected:
A total of 350 diverse compounds were selected from the set of all compounds exhibiting a Tanimoto similarity ≥0.9 (i.e., ]0.9;1.0] range) in any of the similarity searches (793 compounds).
A total of 250 compounds were selected from the 3152 compounds in the ]0.8;0.9] similarity range.
All remaining compounds that were found independently (i.e., in consensus) by three or more of the search methods were chosen, which corresponded to 36 compounds.
From all remaining 276 compounds, a diverse subset of 100 compounds was chosen.
Structure-based VS: docking and postprocessing
The cofactor (SAM) binding site was the target for the SBVS campaign. A number of X-ray crystal structures of G9a have been solved in recent years17,47 and deposited with the Protein Data Bank (PDB). 55 These include co-crystal structures with SAH, small-molecule inhibitors binding to the substrate binding site, and structures in complex with histone peptides. The structures with PDB codes 3nni, 3k5k, 2o8j, and 3dm1 were superimposed using molecular operating environment (MOE) and assessed for conformational conservation in the SAM binding site. It was concluded that conformational differences were minimal, and the SAM binding site was considered to be relatively rigid. Also, the crystal environment around the SAM binding site was analyzed for crystal packing effects 56 that could potentially impede the docking. It was found that there were no crystal mates within an 8-Å radius around SAH, and hence crystal packing effects were not considered. The structure was also analyzed with respect to its solvent structure. It was found that SAH binds to a few water molecules, some of which are even conserved across the superimposed G9a structures. However, all of these water molecules form contact with the SAH ligand only and not with the protein, and no water-mediated protein–ligand contacts were observed. For docking, the G9a X-ray crystal structure 3nni was taken from the PDB. The Maestro “Protein Preparation Wizard” was employed for preparing the structure for docking. All ligands and solvent molecules, particularly SAH, were removed from the structure. The receptor grid was generated using the recommended standard procedure, and default input parameters were used in all calculations. A brief validation of the docking protocol included redocking of a random 3D conformation of SAH, and the binding mode found in the X-ray crystal structure could be reproduced well.
Before docking, a prefilter step was applied to the entire BioFocus compound collection, and compounds not matching the following acceptance criteria were omitted: 150 < molecular weight < 800; AlogP < 8; LogS > −8. All compounds were prepared for docking with LigPrep, using default settings. Docking calculations were performed using Glide SP57,58 on a 32-processor cluster running Linux.
Three output poses per input molecule were requested; however, postprocessing was performed on the 25 000 highest ranked poses, based on the GlideScore scoring function. All other poses were omitted from further processing. Two postprocessing modules were employed for triaging the 25 000 poses. The first module was implemented in PipelinePilot and aimed to capture all poses featuring the same important hydrogen bond anchors as for SAH in the adenine subpocket of the SAM binding site while exhibiting high scores for a number of scoring functions (i.e., having a high consensus score [CS]).
The PipelinePilot “Pose Analysis” component was used for annotating all hydrogen bonds between the G9a structure and the poses, and residue-based scoping was used. PilotScript was employed for flagging all poses featuring the same two essential hydrogen bonds as the G9a–SAH complex in the adenine subpocket.
For all poses, the 15% and 30% percentile consensus scores (CS30, CS15) were calculated, using the value of GlideScore associated with the poses, and the rescored values calculated with LigScore1, LigScore2, PLP1, PLP2, Jain, PMF, and PMF04 scoring functions.59–62
A total of 114 poses with CS30 ≥5 were included in the selection, and this was referred to as the high consensus set.
A total of 271 poses featuring the two essential H-bonds and showing a less stringent CS15 ≥3 were added to the selection, and this was referred to as the subpocket anchor set.
The two merged sets compiled in this process corresponded to 255 compounds that were added to the compound selection. All poses not fulfilling these criteria but exhibiting at least a weak consensus of CS30 ≥3 were subjected to the second postprocessing module using the BioFocus Virtual Screening Toolkit. This toolkit is proprietary to BioFocus and was developed in collaboration with Chemical Computing Group. A total of 3104 poses were processed in this way. All other poses were omitted at this stage.
Using the toolkit, two terms were calculated. The first measured a snugness of fit (D50) of the ligand pose in the receptor site and the second a volume overlap (VO) between the G9a-bound SAH conformation and each pose. D50 gives an indication of the cumulative distance between ligand and receptor, and a low value implies tight binding.
High-priority and low-priority sets of poses were defined using a D50/VO scatterplot with selection criteria being validated by visual inspection of the poses. A total of 397 poses exhibiting very low D50 values and very high VO were selected. The low-priority set comprised 883 poses with relatively low D50 and relatively high VO values. From these, a chemically diverse subset was selected. The number of compounds to be selected was adjusted such that the intended number of compounds (2112) to be tested was reached. In total, 624 compounds were selected using the toolkit and added to the compound selection.
The chemical diversity of the compounds selected by VS was estimated using Murcko scaffolds and MACCS keys-based clustering. For the latter, a Tanimoto threshold of 0.75 was used. The 2112-compound pool represents a total of 1678 Murcko scaffolds and 1236 clusters. This demonstrates that the chemical diversity of the selected compounds is high. A detailed breakdown of cluster numbers in the various VS subsets is given in Table 1 .
Number of Compounds Selected (#Selected) Using Various VS Methods, Number of Hits after Verification (#Hits) with Associated Hit Rate (Hitrate), and Number of Finally Validated Hits (#Fhits) (i.e., compounds with fitted IC50 value)
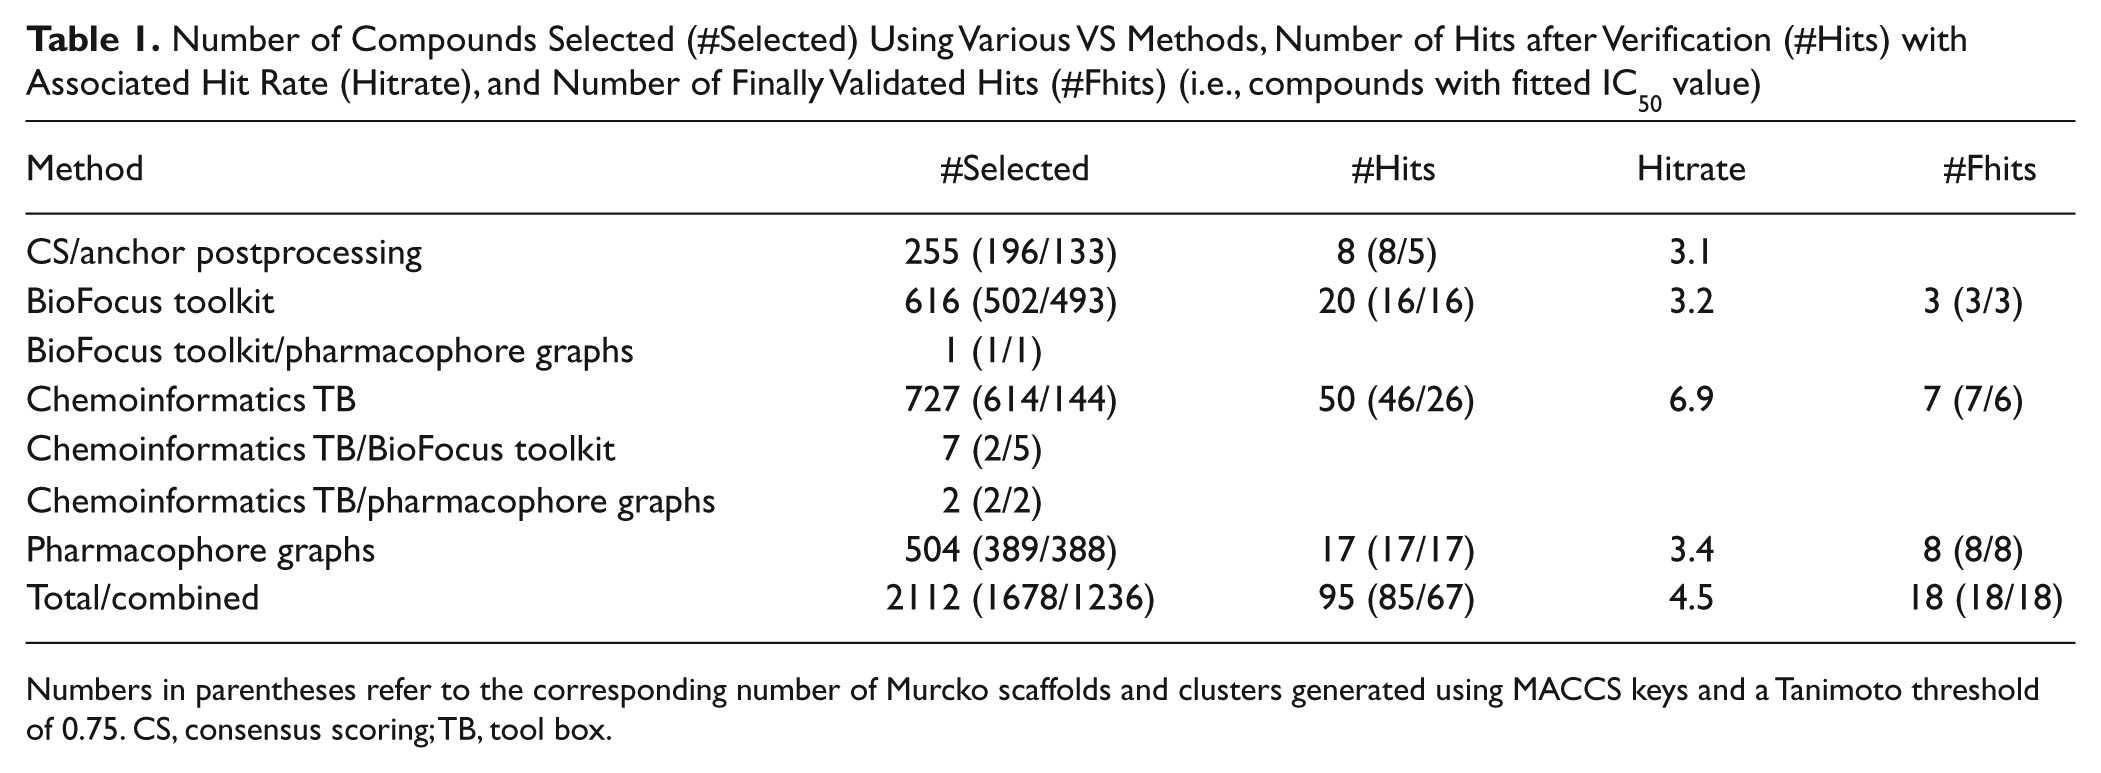
Numbers in parentheses refer to the corresponding number of Murcko scaffolds and clusters generated using MACCS keys and a Tanimoto threshold of 0.75. CS, consensus scoring; TB, tool box.
Results
G9a Assay Development
Full G9a assay development, including testing of reaction linearity, substrate titrations, SAM KM,app determination, DMSO tolerance, and reference compound efficacy in dose–response experiments, was performed. G9a was titrated, and incorporation of labeled 3 H was stopped at indicated time points by addition of an excess of unlabeled SAM (10 mM). The reactions were performed at nonlimiting concentrations of full-length histone H3.1 and SAM. For all G9a concentrations, the velocity decreased after 90 min ( Fig. 1a ). The following experiments were performed with 1.3 nM G9a and a reaction time of 90 min.
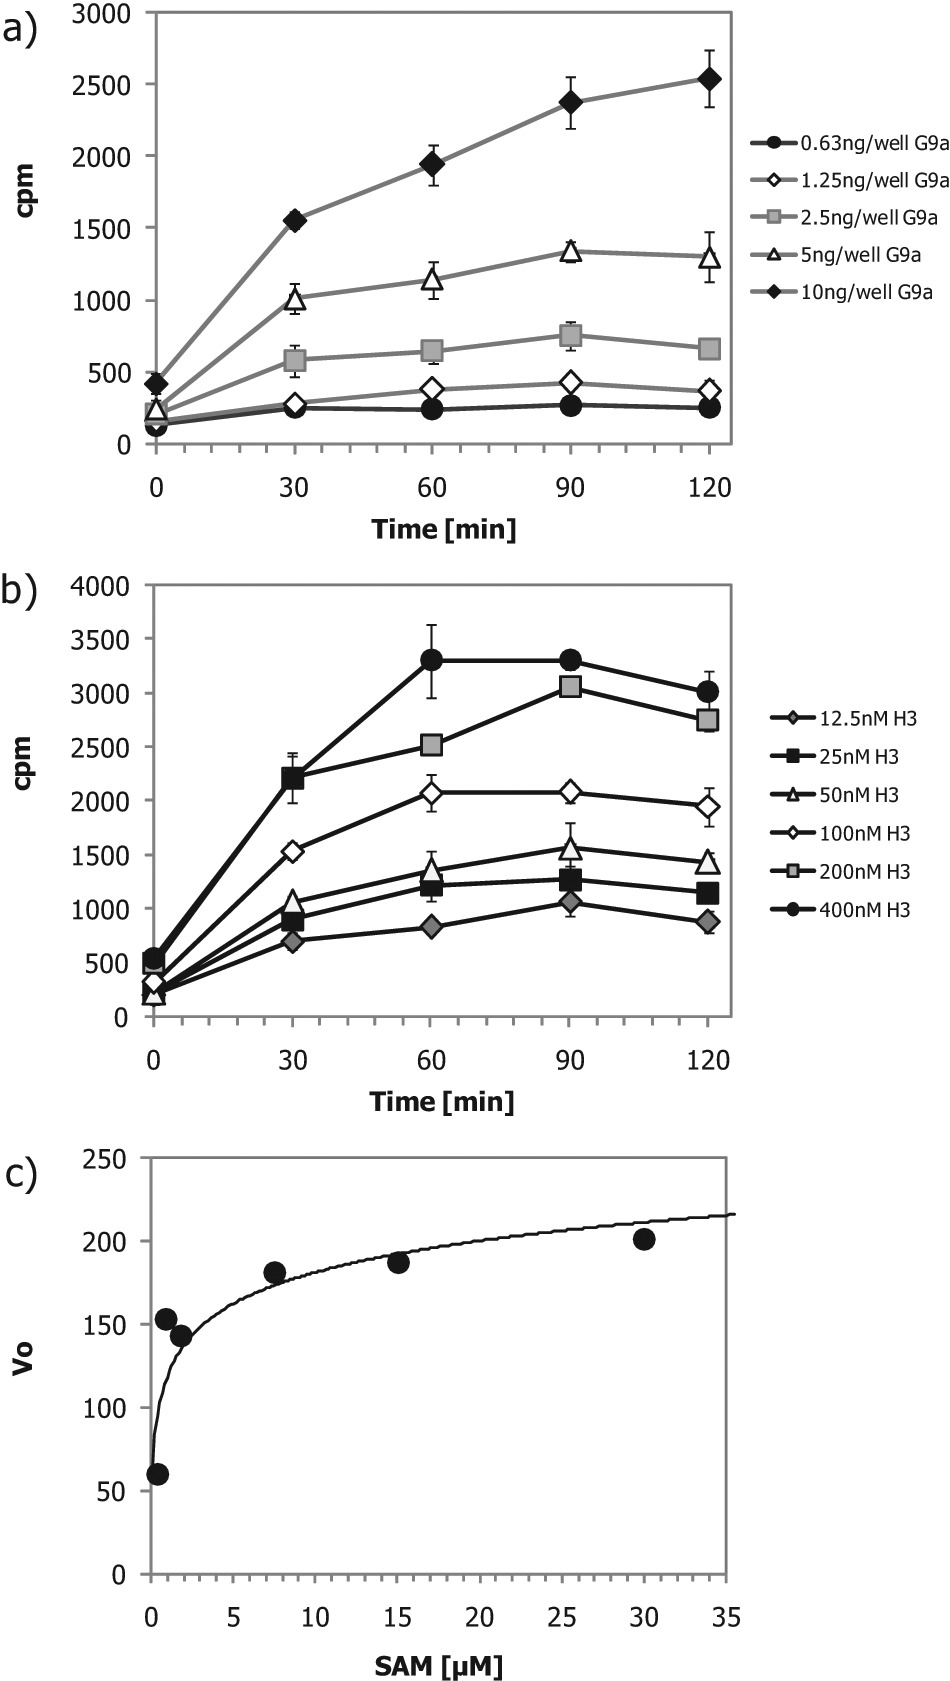
(a) Reaction linearity at different G9a concentrations. Reactions were stopped by an excess of unlabeled S-adenosyl-L-methionine (SAM) at the time points shown. Mean cpm of four wells is shown. (b) Histone H3.1 titration. Mean cpm of three wells ±1 SD is shown. (c) SAM KM,app determination.
Full-length histone H3.1 was titrated in a time course experiment (
Fig. 1b
). The G9a HMT reaction velocity dropped at all histone concentrations after 60 to 70 min. Together with the G9a titration in
Fig. 1a
, these data indicate a loss of enzyme activity/stability after 90 min. A full-length histone H3.1 concentration of 50 nM was used for the rest of the study because the reaction linearity was maintained over a period of 90 min. G9a reaction velocities were determined for different SAM concentrations, and velocities were plotted versus SAM concentration. Data were fitted using the Michaelis-Menten equation for determination of the SAM KM,app value (
Fig. 1c
). A SAM KM,app value of 1.2 µM was determined for G9a, and a SAM concentration of 3 µM was used for the final validation of the assay in dose–response experiments using product inhibition by SAH and the reference inhibitor sinefungin, which binds to the SAM binding site of G9a (
Fig. 2a
). Both compounds (structures and published IC50 values are shown in
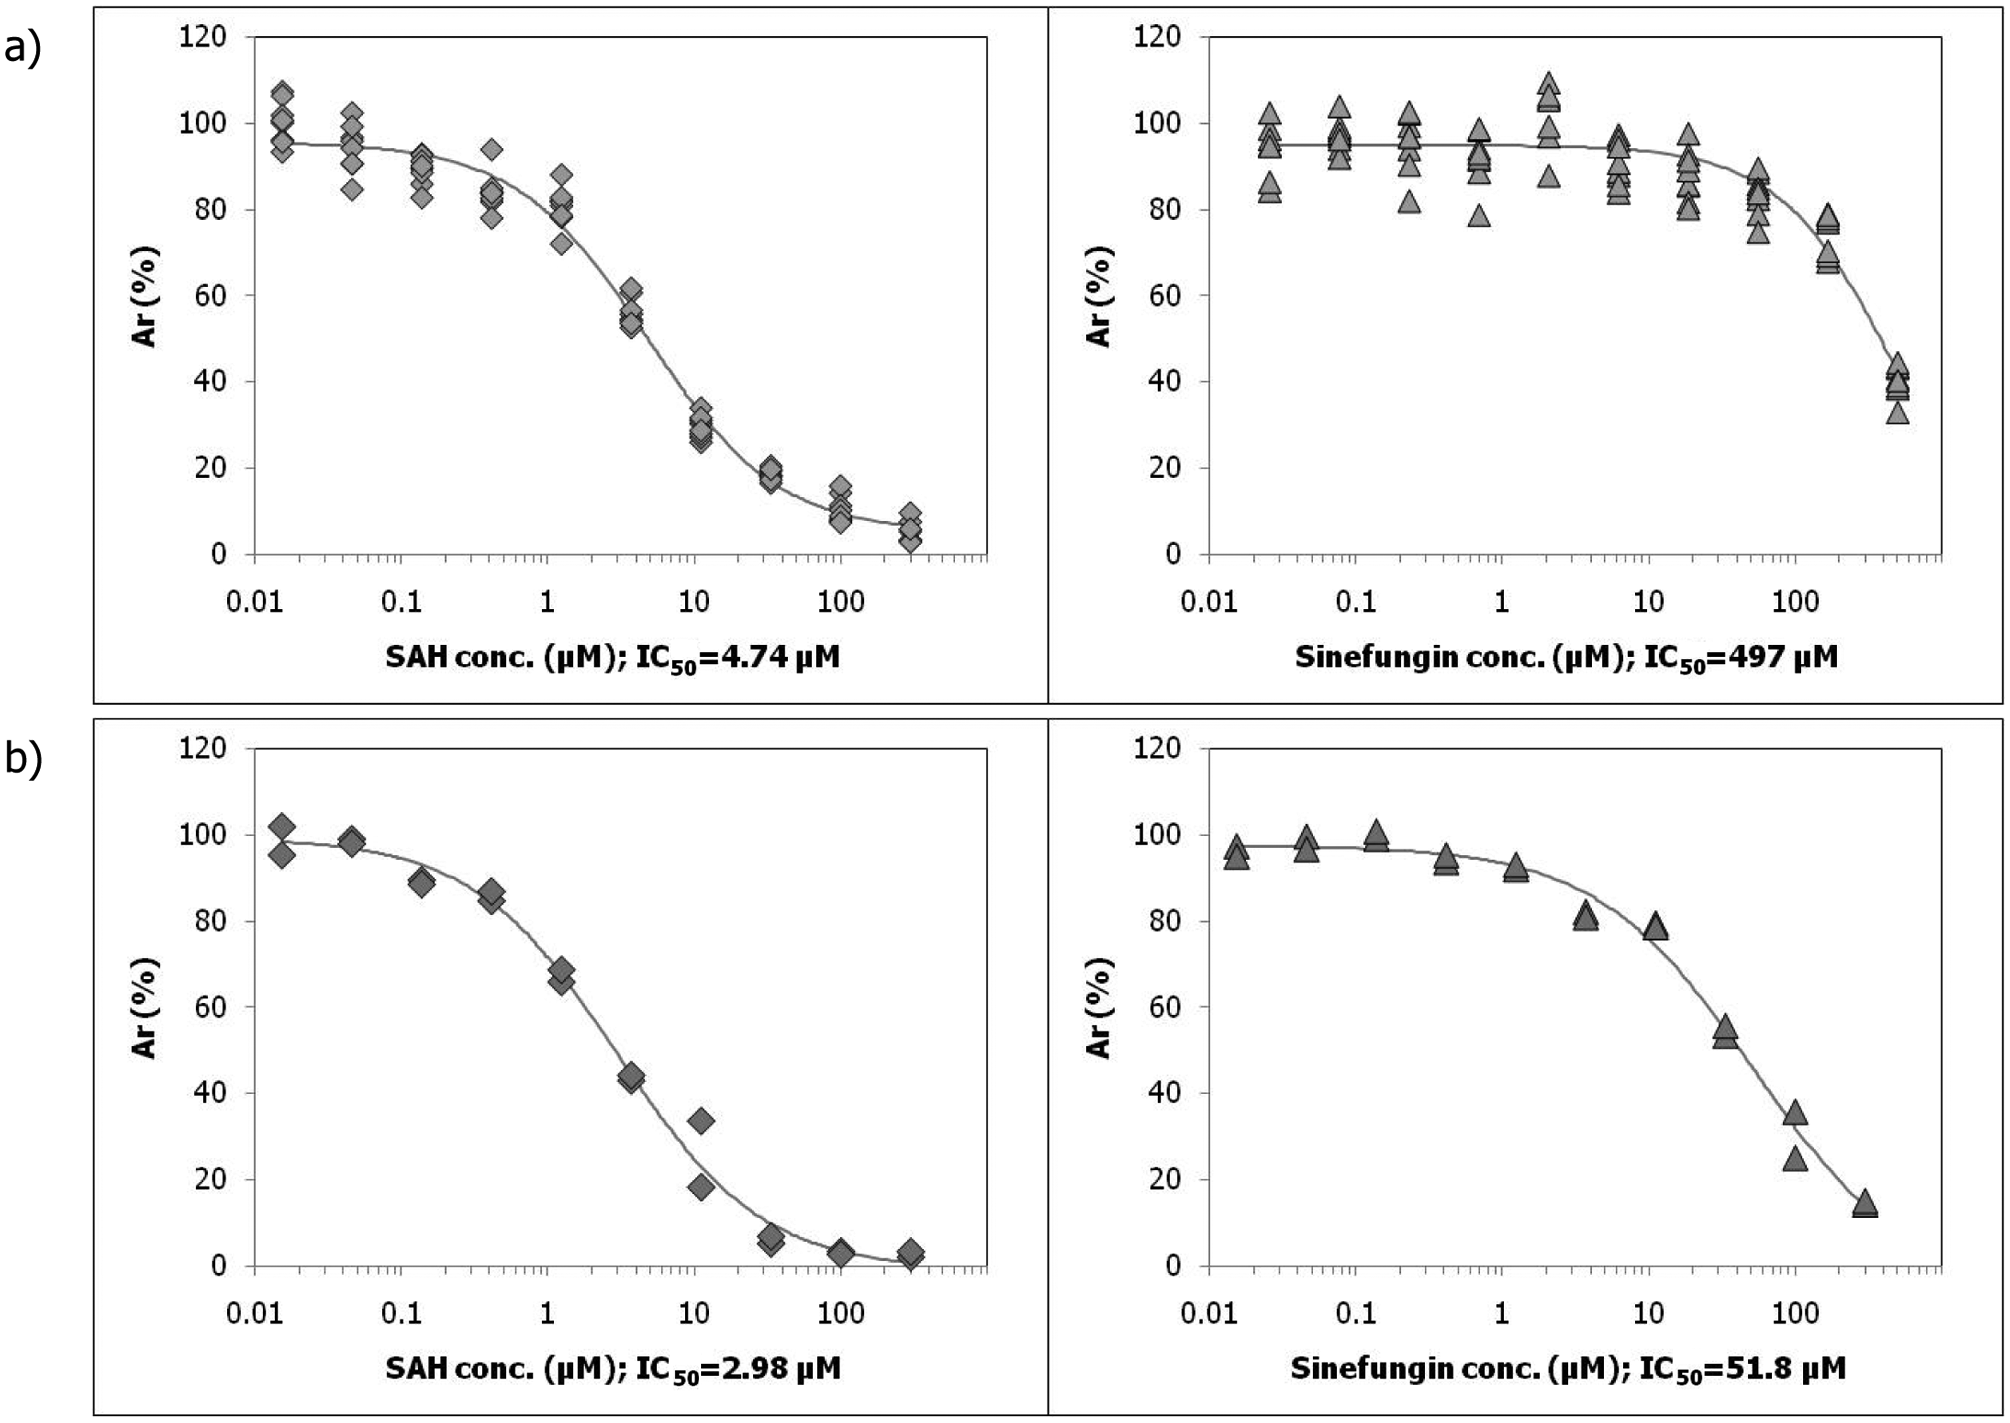
(a) IC50 determination of S-adenosyl-homocysteine (SAH) and sinefungin against G9a in the radiometric FlashPlate assay. (b) IC50 determination of SAH and sinefungin against G9a in the G9a fluorescence lifetime (FLT) assay.
To compare the sensitivity of the radiometric FlashPlate and the G9a FLT assays, the predeveloped G9a FLEXYTE FLT assay (Almac) was validated in a dose–response experiment also using SAH and sinefungin (Fig. 2b). IC50 values determined for SAH and sinefungin against G9a in the FLT assay were 3 µM and 52 µM, respectively. Assay sensitivities of both assays were comparable, with the FLT assay being slightly more sensitive for both inhibitors.
Virtual Screening Approach and Results
As described in detail in the Materials and Methods section, a total of 2112 compounds were selected by various VS methods; 872 compounds were selected using structure-based VS, 736 using the chemoinformatics toolkit, and 506 with DiscNgine’s pharmacophore trees. Chemical diversity of the subsets was monitored by counting the number of chemical clusters per group. Both Murcko scaffolds and fingerprint-based clusters (MACCS keys, T = 0.75) were used. An overview of the VS workflow is shown in Figure 3 . The overlap between the methods both in terms of individual compounds and compound classes was remarkably small (see Table 1 ). Nevertheless, all three groups of VS approaches (docking, pharmacophore trees, chemoinformatics toolkit) have identified compounds that lead to validated hits and then finally confirmed hits with associated IC50 value.
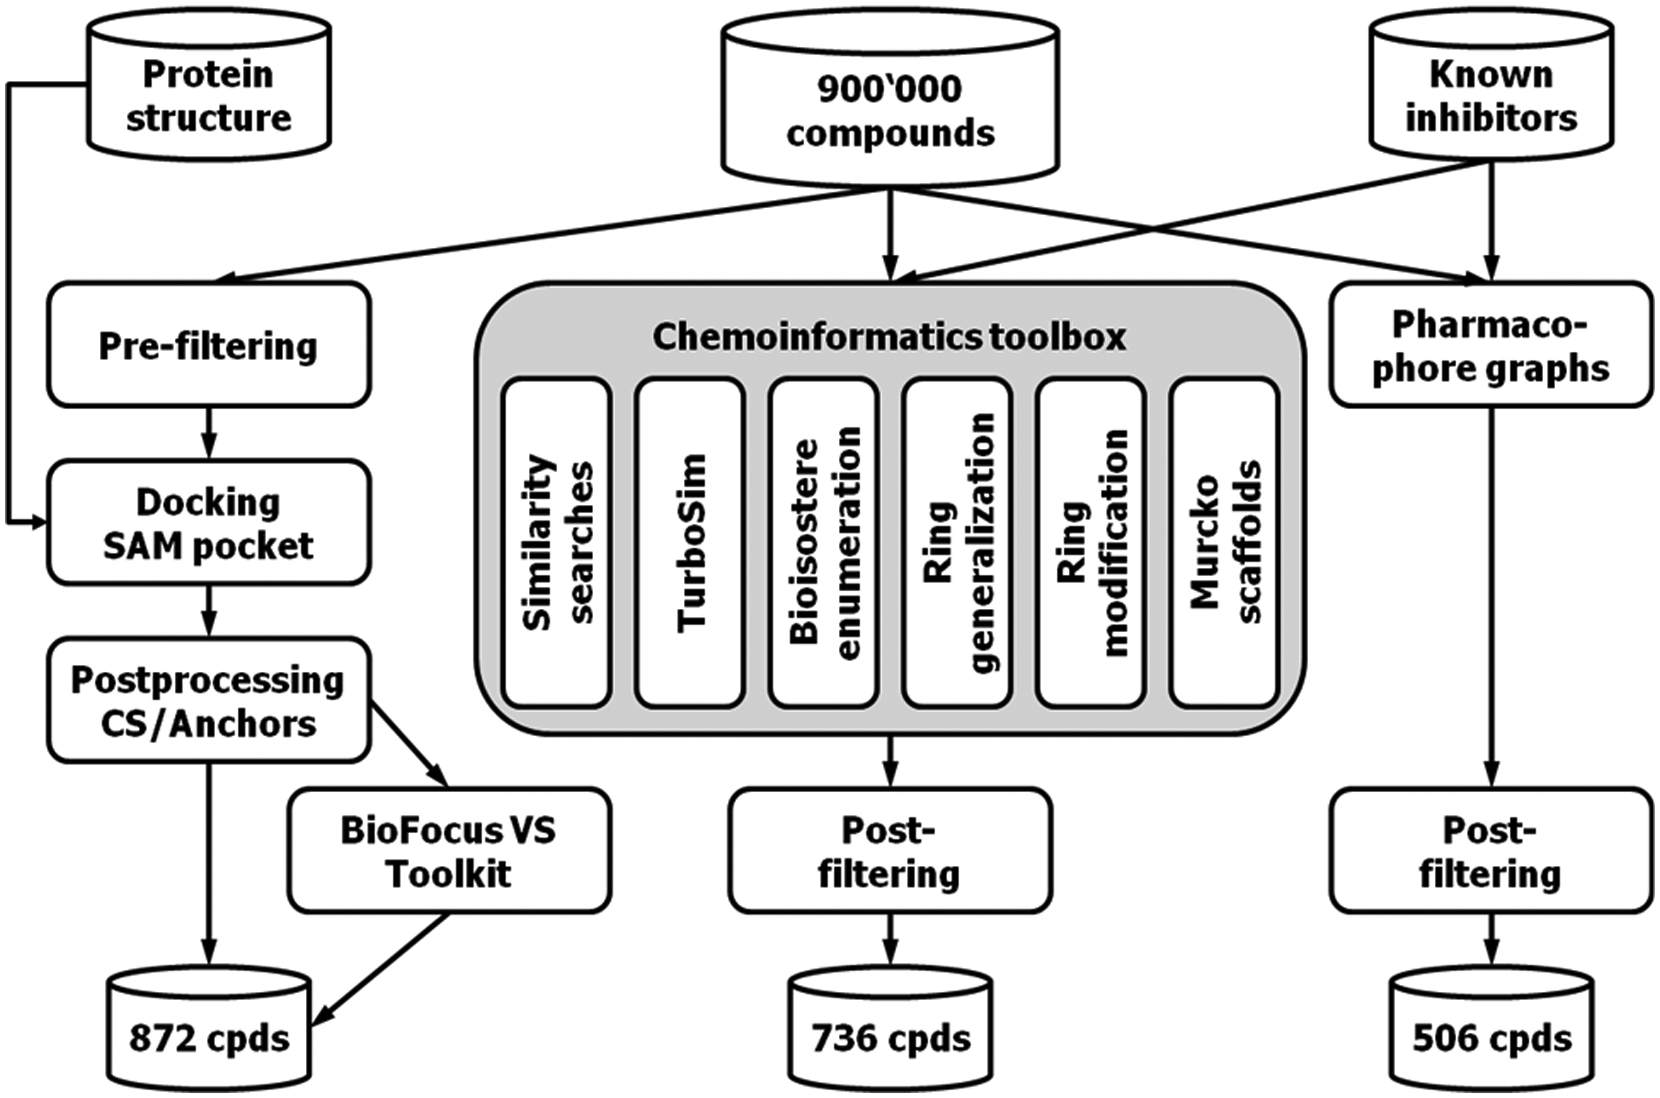
Virtual screening (VS) workflow and number of compounds selected by the different VS methods. Structure-based VS included prefiltering and docking with Glide in the S-adenosyl-L-methionine (SAM) binding site of G9a, followed by postprocessing of the poses. Postprocessing included consensus scoring (CS) and subpocket anchor analysis, as well as use of the BioFocus Virtual Screening Toolkit. Ligand-based VS was performed using a PipelinePilot implementation of various chemoinformatics search methods (chemoinformatics toolkit) and pharmacophore graphs. For both result sets, a graded postfiltering scheme was applied.
Radiometric G9a Screen
In total, 2112 compounds on six assay plates were screened against G9a in the radiometric FlashPlate assay. Compounds were screened in single determinations at 10 µM final concentration. Plate performance is given in
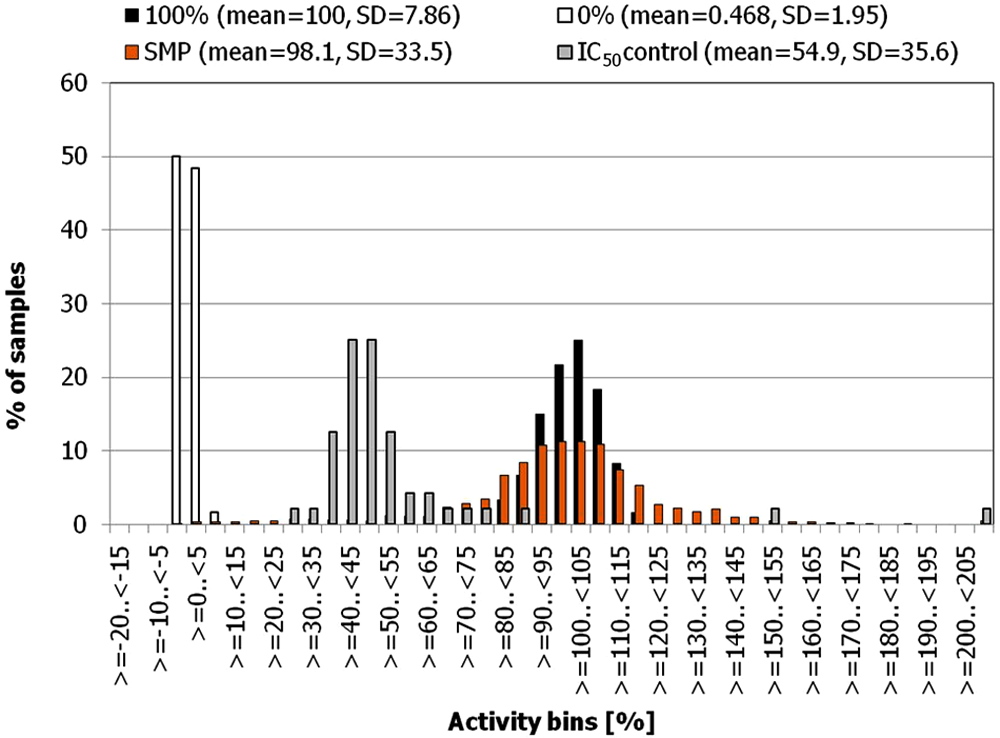
Activity distributions of sample and control wells in the G9a screen. Relative activities (Ar%) are binned in 5% steps.
Hit rates in the primary screen for different cutoff values are shown in Table 2 . One hundred five compounds (5% hit rate) showed more than 50% inhibition in the primary screen, which supports the validity and success of the compound selection process. All compounds showing >30% inhibition in the primary screen were cherry picked and retested in duplicates at a 10-µM compound concentration. Mean inhibition values from the verification run were used to determine the confirmation rates, which are shown in Table 2 .
Hit and Confirmation Rates of G9a Screen
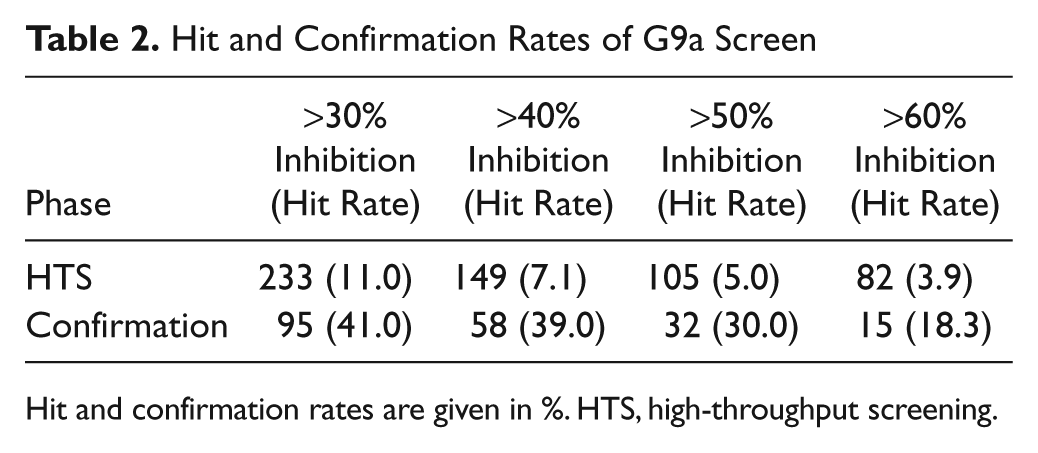
Hit and confirmation rates are given in %. HTS, high-throughput screening.
Compound Selection for Dose–Response Experiments
From the 95 confirmed hits, 32 compounds were selected for IC50 determination against G9a and purity analysis by liquid chromatography/mass spectrometry (LC/MS). These 32 compounds correspond to a hit rate of 1.5% with regard to the starting screening deck of 2112 compounds. Again, a graded selection approach has been chosen (see
Dose–response experiments were performed in duplicate with a maximal compound concentration of 100 µM and a 10-step 1:3 dilution series. Twenty-three compounds (1% of entire G9a screening deck) were finally validated as G9a inhibitors with IC50 values between 0.6 and 55 µM. Eighteen of these compounds showed purity values >75% ( Fig. 5 ), corresponding to a hit rate of 0.9% for fully validated hits with respect to the primary screening deck. Of these compounds, 13 have been identified by the LBVS methods via query molecules that bind to the substrate binding site, suggesting that these compounds could bind at this site. Five compounds were found by docking and LBVS with SAH as a query molecule; hence, these compounds are more likely to target the SAM binding pocket.
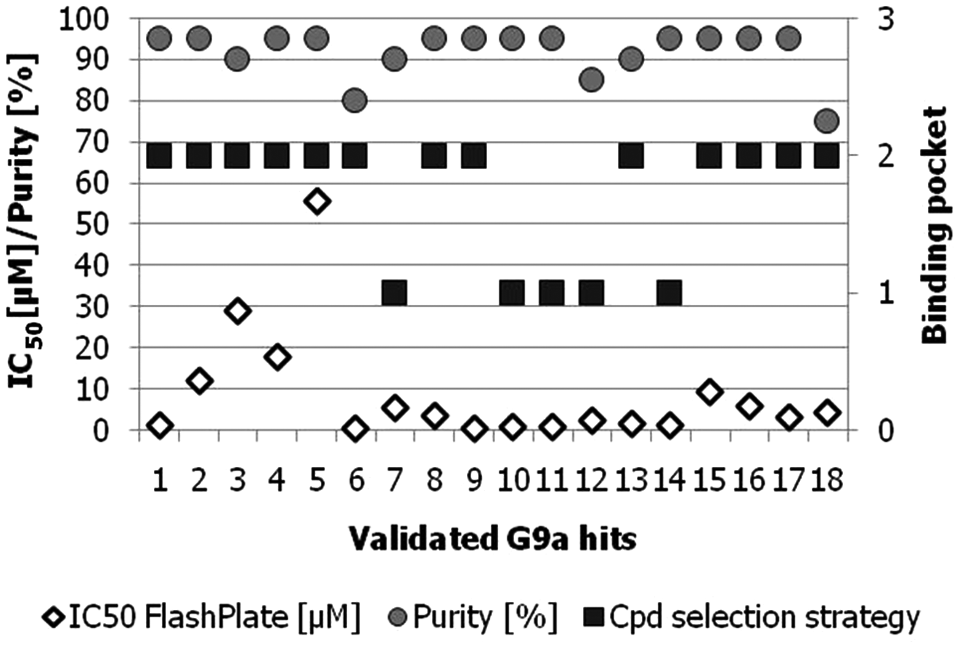
Validated G9a inhibitors with IC50 values <55 µM and compound purity >75%. Based on the virtual screening (VS) selection method and the ligand-based VS (LBVS) query molecules used for each of the compounds, the putative G9a binding pocket is shown (1 = S-adenosyl-L-methionine [SAM] binding site; 2 = histone H3.1 binding site).
The compounds that were progressed to IC50 experiments were tested in parallel in the orthogonal G9a FLT assay ( Fig. 6 ). The confirmation rate in the FLT assay was low, and only two compounds showed modest inhibitory activity in this assay. For compound A ( Fig. 6 , left graph), an IC50 value of 1 µM was obtained in the FlashPlate assay, whereas in the FLT assay a value of 65 µM was observed. Compound B ( Fig. 6 , right graph) was confirmed in the FlashPlate assay with an IC50 value of 5.5 µM, and in the FLT assay an IC50 value of >90 µM was determined. Although sensitivity of the G9a FLT assay was proven to be similar to the FlashPlate assay for reference compounds SAH and sinefungin (see Fig. 2 ), differences in both assay protocols with regard to substrate and enzyme concentrations might partly explain the results. Interestingly, both compounds shown in Figure 6 were originally selected by VS as potentially targeting the SAM binding site.
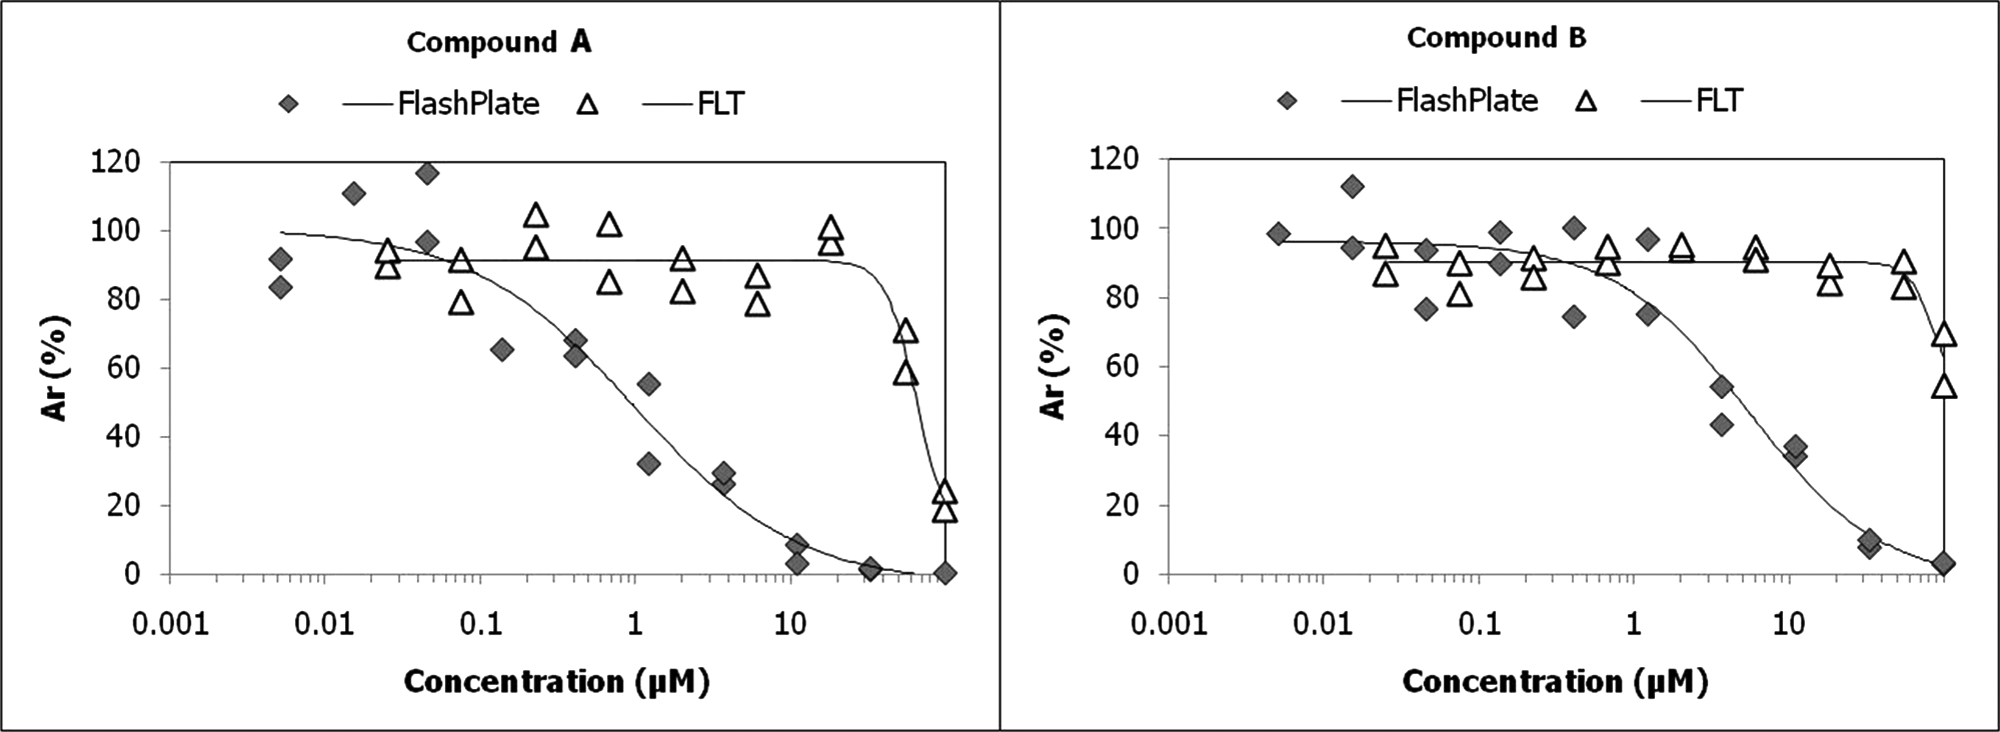
IC50 curves for two compounds that were confirmed in the primary assay and fluorescence lifetime (FLT).
The set of 18 G9a inhibitors was subjected to a fast-track version of the chemoinformatics toolkit for hit expansion mining the entire BioFocus compound inventory. Preliminary analysis of this hit expansion list identified more than 3000 compounds for additional testing. Assuming that the hit and confirmation rates would be similar to the figures presented in this article, such a comparably small effort is likely to further increase the number of active compounds against G9a. Initial SAR information and potential starting points for medicinal chemistry hit-to-lead optimization may therefore become available.
Discussion
HMT Targets in Drug Discovery
Since the discovery of the first mammalian HMT in 2000, 66 HMTs now represent an important target class for drug discovery in human disease.6,7,67 Due to the common small-molecule co-factor SAM that is involved in the catalytic mechanism, HMTs are considered druggable by small-molecule compounds. Moreover, small molecules that bind to the substrate binding cavity have also been characterized, offering a second binding site for drug discovery programs. The huge potential for therapeutic intervention by targeting HMTs has been topic of several recent reviews,12,68 and especially the association of certain HMTs with human cancers has received much attention.8,69
G9a is one of the best characterized HMTs and physiological functions, cellular substrates, structural information, and involvement in diseases and development of potent small-molecule inhibitors of the enzyme have been described.18,22,47 We used G9a as a model HMT for a knowledge-based selection from the BioFocus compound library that comprises 900 000 compounds. A computational approach using a combination of virtual screening methods was implemented to select 2112 compounds that were subsequently screened against G9a. Known structural information on the SAM binding pocket of G9a was used in parallel to similarity searching of the chemical space around known G9a inhibitors. This compound selection strategy turned out to significantly increase the number of primary, confirmed, and validated hits in the FlashPlate-based screen when compared to screening campaigns that are, for example, based on a maximal diverse compound screening deck only. The different virtual screening methods complemented each other, providing minimal overlap in the selection subsets ( Table 1 ), and these subsets were also equally represented in the hit lists. The results strengthen the rationale of the chosen strategy and demonstrate the power of combined VS approaches for new epigenetics targets.
Value of Orthogonal Assay/New Developments/Assay Technologies
Drug screening against HMTs has been facilitated by several new or adapted assay technologies. In addition to the standard radiometric assay using tritiated SAM as substrate, nonradioactive, homogeneous assay formats have recently been added to the repertoire of HMT assays. Among these, the AlphaLISA detection system from PerkinElmer and time-resolved fluorescence resonance energy transfer (TR-FRET)–based assays that were introduced by PerkinElmer and Cisbio (Bedford, MA) are dependent on methylation-specific antibodies that are available for many histone methylation sites. In addition, generic readouts of HMT activity using SAH-converting enzymes have been introduced (Transcreener EPIGEN Methyltransferase Kit from BellBrook Labs, Madison, WI). Also, label-free HMT assays have been introduced, and the RapidFire technology from Biocius (now Agilent Technologies, Santa Clara, CA) uses µSPE-MS technology for the analysis of HMT activity. A homogeneous mobility shift assay using the Caliper LabChip technology (Caliper Life Sciences, Hopkinton, MA) allowing accurate kinetic studies was recently described for the identification of small-molecule inhibitors of HMTs as well as histone demethylases (HDMs). 49 The modification of peptide substrates by G9a or the HDM LSD1 does not influence the net charge of the peptides, so activity was detected by masking/demasking of a proteolytic cleavage site that was required for a coupled Endo-LysC reaction. This novel assay technology has been a successful approach to identify and further optimize G9a inhibitors.
Although a small number of homogeneous assay technologies are currently available for HMT screening and profiling, we have decided to perform the primary screen employing the FlashPlate assay technology. The technology is the gold standard and the most sensitive method for testing the activity of HMTs. The assay interference is low, and most important, the method allows the use of complex enzyme substrates. Nucleosome extracts, full-length proteins, or peptide substrates can be used equally well. For our study, we decided to use full-length histone H3.1 protein in the primary radiometric assay and a peptide-based orthogonal secondary assay technology.
The secondary assay is based on the modulation of the fluorescence lifetime of a labeled peptide. The FLEXYTE FLT assay used in the current study is a peptide-based, homogeneous assay format that does not require antibodies. FLT is considered an attractive assay technology in comparison to other approaches because assay interferences, caused by compounds or assay reagents, are minimized. 70 Recent improvements in the field—namely, the introduction of fluorophores with appropriate long lifetimes, the development of new approaches for reporting enzyme activity through changes in fluorescence lifetime, and the availability of new FLT readers—have provided the setting for kinase, phosphatase, protease, and most recently HMT FLEXYTE FLT assays.
In this study, reference compounds that are known to bind to the SAM binding site showed IC50 values comparable to the radiometric FlashPlate assay. However, the primary hit compounds showed an increased IC50 in the FLT assay, showing that the sensitivity to FlashPlate hit compounds was reduced. Different molar concentrations of enzyme and different substrates used in the assays might partly explain the differences in the observed IC50 values. Although the full-length histone H3.1 has been used in the radiometric assay, a histone H3.1 peptide substrate has been used in the FLT assay. To further elucidate the differences in the IC50 results of the hit compounds, several studies will be performed. Alteration of the peptide substrate used in the FLT assay and competition studies with SAM as well as substrate will be employed. It can be postulated that binding of the hit compounds is dependent on the substrate, and IC50 values are therefore modulated by the use of a specific substrate. Similar differences have been described by Liu et al. 17 for the assumed selectivity of UNC0224. When assay conditions were adapted and identical assay conditions were used, a shift of IC50 has been monitored. Our results support the practice that the development of orthogonal and complementary biochemical assays should be included from the start of a hit-finding campaign to rule out false positives and artifacts that can arise from using only one assay technology. BioFocus is currently expanding the panel of epigenetics assay formats; for example, MSA assays for HMTs and HDMs are in development.
Selectivity Panel
Selectivity and specificity of HMT inhibitors are key requirements for future therapeutic use. Nonselective inhibition of HMTs by sinefungin and product inhibition by SAH are well documented. Selectivity for G9a has been described for BIX-01294 and UNC0321.16,17 Drug-like and highly selective HMT inhibitors were recently described for the PRMT CARM1. 15 Selectivity panels reflecting the structural diversity of substrate and SAM-binding pockets and the therapeutically relevant selectivity profile are of key importance for drug discovery efforts. Compound profiling against structural similar and nonrelated members of an HMT target provides important additional information on target selectivity, and efforts are ongoing at BioFocus to set up an HMT compound profiling assay panel. Target class– specific consensus binding site models, referred to as roadmaps,71,72 have been instrumental chemogenomics-driven approaches to address these challenges for protein kinases, G-protein-coupled receptors (GPCRs), phosphodiesterases (PDEs), and ion channels. We have recently extended this concept to HMTs, along with the development of a new computational tool referred to as EpiRoadmap. Such developments allow us to substantially improve the design of selectivity panels and support medicinal chemistry efforts in hit-to-lead programs. 73
Cellular Epigenetic Assays for Compound Profiling
Clearly, there is a demand for cellular readouts analyzing the methylation status of histones and target proteins of HMTs as well as transcriptional regulation of downstream targets. The cellular activity of G9a inhibitors has been shown to result in reduction of H3K9 and p53 K373 methylation. Chaetocin displayed depletion of cellular H3K9me2/3 levels but at the same time caused relatively high cell-based toxicity independent from its methyltransferase inhibitory activity. BIX-01294, as a non-SAM-competitive inhibitor of G9a with an IC50 of 1.6 µM, has been shown to reduce H3K9me2 levels in mammalian cells. No cellular activity has been reported for the most potent G9a inhibitor, UNC0321, so far.
Cell-based activity of the primary screening hits within the described work has not yet been demonstrated. It is planned to evaluate the methylation events on both histone H3.1 as well as p53. The methylation of p53 and H3.1 will be monitored in parallel to overall p53 and H3.1 levels using specific antibodies. The analysis of the methylation levels of lysine 373 of p53 is of specific interest because the dimethylation of p53 K373 results in inactivation of p53, which is implicated in more than 50% of all cancers. 74
In the current case study with G9a, it has been demonstrated that the use of a combination of virtual screening methods can efficiently enrich the hit rate even in a small screening set. Each individual VS method has been proven to generate value given that all complementary methods applied have led to validated hits. The small overlap between the VS hit subsets and hit subset clusters underpins the previously mentioned notion that parallel application of various VS methods increases the likelihood of finding more potent hits. To us, this suggests that as many VS methods as possible should be combined for a VS campaign, provided that each individual method appears to be appropriate in the context of data and structures available for a particular project. For the screening of the compounds, a FlashPlate assay has been used, and a number of hit compounds have been verified in dose–response experiments. FLT has been employed for the first time as a novel orthogonal assay technology for HMTs. Although we were able to demonstrate highly similar IC50 values for SAM-binding site inhibitors using both assay technologies, a larger difference in potency was measured for the remaining hit compounds, giving rise to speculation about the mechanism of G9a inhibition for this group and the binding site involved. Overall, the study demonstrates that complementary virtual screening methods can be successfully applied to epigenetics targets, and novel hit compounds can be identified from a small screening deck that is highly enriched with active compounds.
Footnotes
Acknowledgements
The authors acknowledge the valuable contributions of Kate Hilyard and Stephan Fasler (for helpful suggestions and reviewing of the manuscript); Virginie Voegtlin, Jasmin Grählert, and Céline Klein (excellent technical assistance); Vivienne Allen for support with docking calculations; Alexei Ouspenski for LC/MS; and Almac for providing the FLEXYTE peptides and support for FLT assay development.
The author(s) declared no potential conflicts of interest with respect to the research, authorship, and/or publication of this article.
The author(s) received no financial support for the research, authorship, and/or publication of this article.
References
Supplementary Material
Please find the following supplemental material available below.
For Open Access articles published under a Creative Commons License, all supplemental material carries the same license as the article it is associated with.
For non-Open Access articles published, all supplemental material carries a non-exclusive license, and permission requests for re-use of supplemental material or any part of supplemental material shall be sent directly to the copyright owner as specified in the copyright notice associated with the article.