
Abstract
Low molecular weight compounds have been shown to be useful for controlling stem cells, and various high-throughput screening systems have been developed for identifying compounds that regulate the differentiation of stem cells. However, the effects of such compounds on stem cell differentiation are usually evaluated by assessing a single parameter, which is insufficient for proper monitoring of the cellular status. In this study, to classify a number of compounds, the authors established a gene expression–based screening system using mouse embryonic stem (ES) cells that monitored multiple parameters. ES cells were differentiated into three germ layers by embryoid body formation and then treated with the test compounds. Next, cellular changes were assessed by analyzing the expression of multiple genes with the multiplex quantitative reverse transcriptase polymerase chain reaction. By screening a library of pharmacologically active compounds with this system, the authors were able to classify 52 compounds that influenced the gene expression profile of ES cells. They also found that some compounds identified by screening could enhance osteogenic or adipogenic differentiation of human mesenchymal stem cells. These results indicate that the screening system is effective for identifying compounds involved in regulating the differentiation of both ES cells and adult stem cells.
Introduction
Low molecular weight compounds have been recognized as useful tools for investigation of stem cell biology. Indeed, recent studies have identified a variety of compounds that regulate the fate of stem cells, including compounds that induce differentiation of stem cells into specific lineages, maintain self-renewal, and dedifferentiate lineage-committed cells into more primitive precursor cells.1–3 In addition, compounds have been identified that improve the efficiency of reprogramming fibroblasts into induced pluripotent stem (iPS) cells.4–6 Moreover, several compounds have been found that regulate cellular fate in vivo and improve various pathological conditions.7–9 The discovery of compounds that regulate stem cell differentiation has the potential to lead to the development of novel drugs for the promotion of wound healing and the treatment of degenerative diseases.
Embryonic stem (ES) cells are derived from the inner cell mass of the embryo at the blastocyst stage, and these cells proliferate indefinitely and differentiate into many cell types in vitro. ES cells have been recognized not only as useful for studying the early stages of mammalian development in vitro but also as tools for drug discovery. In fact, various phenotypic screening methods employing mouse or human ES cells have been used for the identification of compounds that regulate ES cells.10–14
With most cell-based screening systems, the effects of compounds are initially evaluated by assessment of a single readout using conventional techniques, such as reporter assays, enzyme-linked immunosorbent assay (ELISA), and immunocytochemistry. These methods are useful for identifying compounds that have specific cellular effects by high-throughput screening (HTS). For example, compounds that maintain self-renewal 11 and those that induce cardiac differentiation of ES cells 12 have been identified through such screening processes. However, the effects of compounds on ES cells can be complex because differentiation into various lineages is possible, and a single marker seems to be insufficient to monitor the cellular status. To classify a wide range of compounds, a new information-rich screening method is required. In recent studies, gene expression–based screening has been employed for the identification of compounds that produce the desired changes in various cell lines.15,16 In these studies, the expression of multiple genes was analyzed to monitor complex changes of the cellular status. We expected that analysis of multiple genes might also be useful for evaluating the complex effects of compounds on ES cell differentiation.
Therefore, we developed a gene expression screening system to classify a wide range of compounds influencing the differentiation of mouse ES cells. By screening 1280 compounds in a library of pharmacologically active compounds (LOPAC, Sigma-Aldrich, St Louis, MO) with this system, we identified compounds that altered the gene expression profile of mouse ES cells. We also found that several of these compounds induced the osteogenic or adipogenic differentiation of human mesenchymal stem cells (hMSCs).
Materials and Methods
Compounds
N-[N-(3, 5-difluorophenacetyl)-L-alanyl]-(S)-phenylglycine t-butyl ester (DAPT), 6-bromoindirubin-3′oxime (BIO), myoseverin, purmorphamine, neuropathiazol, Y-27632, and PD169316 were purchased from Merck Biosciences (La Jolla, CA). Forskolin, dexamethasone, cyclopamine, and PD098059 were obtained from Wako Pure Chemicals (Osaka, Japan). Retinoic acid, SB431542, capsazepine, HA-100, 5-bromo-2′-deoxyuridine (BrdU), and the LOPAC (containing 1280 compounds) were from Sigma-Aldrich (St. Louis, MO). BIX-01294 and suberoylanilide hydroxamic acid (SAHA) were purchased from Alexis Biochemicals (San Diego, CA). HA-100 was sourced from Tocris Bioscience (Bristol, UK), and troglitazone was from Biomol International (Plymouth Meeting, PA).
Culture of mouse ES cells
The D3 mouse ES cell line (CRL-1934; American Type Culture Collection, Manassas, VA) was maintained on mitomycin C–treated mouse embryo fibroblasts (MEFs) in high-glucose Dulbecco’s modified Eagle’s medium (DMEM; Invitrogen, Carlsbad, CA) supplemented with 20% fetal bovine serum (FBS; ES cell qualified; Invitrogen), 100 µM 2-mercaptoethanol (Invitrogen), 1% minimum essential medium (MEM) nonessential amino acids (Invitrogen), 1% antibiotic–antimycotic (Invitrogen), and 1000 U mL−1 leukemia inhibitory factor (LIF; Chemicon, Temecula, CA). Culture medium was replaced every day, and the cells were passaged by using 0.25% trypsin-1 mM EDTA (Invitrogen) every three days.
ES cell differentiation
ES cells maintained on feeder cells were dissociated with trypsin–EDTA and plated onto gelatin-coated dishes (AGC Techno Glass, Tokyo, Japan) for 90 min. Then nonadherent cells were replated onto gelatin-coated dishes and cultured for three days. These feeder-free ES cells were dissociated with trypsin–EDTA, plated onto gelatin-coated dishes at a density of 1 × 10⁵ cells per cm2 and cultured for 24 h. Then the cells were harvested with trypsin–EDTA and frozen at 2 × 10⁶ cells mL−1 using Cellbanker (Nippon Zenyaku, Tokyo, Japan) at −80 °C for use in further experiments. For embryoid body (EB) formation, frozen cells were thawed at 37 °C and dispensed into 96-well spheroid culture plates (MS-0096S; Sumitomo Bakelite, Tokyo, Japan) at a density of 1000 cells per well in high-glucose DMEM supplemented with 10% FBS, 2 mM GlutaMAX-I (Invitrogen), 3 × 10⁻⁴ M monothioglycerol (Sigma), 1% MEM nonessential amino acids, and 1% penicillin–streptomycin (Sigma). Suspension culture was continued for four days. Then the EBs were dissociated with trypsin–EDTA on day 4 and replated into 96-well gelatin-coated plates (4860-020; AGC Techno Glass) at a density of 1000 cells per well with culture medium containing test compounds. Thereafter, the cells were cultured for four days without medium change. On day 8, the cells were dissolved in RLT buffer (Qiagen, Valencia, CA), and the lysate was stored at −80 °C until extraction of RNA.
Analysis of gene expression
Total RNA was isolated from the cells with an RNeasy 96 kit or RNeasy mini kit (Qiagen). Then cDNA was prepared with a PrimeScript RT reagent kit (Takara Bio, Shiga, Japan) according to the manufacturer’s instructions. Quantitative reverse transcriptase polymerase chain reaction (RT-PCR) was performed with the TaqMan system on either a 7300 or a 7900HT Fast Real-Time PCR system (Applied Biosystems, Foster City, CA) under the following cycling conditions: 50 °C for 2 min and 95 °C for 2 min, followed by 40 cycles of 95 °C for 15 s and 60 °C for 1 min. The primers and fluorogenic probes that were used for single or multiplex RT-PCR are listed in
Compound library and screening
For screening the LOPAC (which contained 1280 compounds), cells were treated with the test compounds in a volume of 200 µL per well at a final concentration of 3 µM in 0.15% DMSO as the vehicle. After four days, the expression of eight target genes was analyzed by quantitative RT-PCR. Clustering of compounds was performed with Spotfire software (Spotfire, Somerville, MA).
Viability assay
Viability experiments were performed in 96-well plates using a CellTiter-Glo luminescent cell viability assay kit (Promega, Madison, WI) according to the manufacturer’s instructions. In brief, cells in 96-well plates were treated with compounds on day 4 and incubated for 24 h or four days. After incubation, medium was replaced with 100 µL of phosphate-buffered saline (PBS), and then 100 µL of CellTiter-Glo reagent was added to each well. Plates were shaken for 2 min on a plate shaker and incubated at room temperature for 10 min. Luminescence was then quantified with a microplate reader (ARVO SX; PerkinElmer, Boston, MA).
Culture of hMSCs
hMSCs were purchased from Lonza (Walkersville, MD) at passage number 2 and then were expanded to passage number 4 in growth medium, which was low-glucose DMEM (Invitrogen) supplemented with 10% FBS (StemCell Technologies, Vancouver, Canada), 2 mM GlutaMAX-I, and 1% penicillin–streptomycin. For adipogenic differentiation, hMSCs were plated into 96-well plates (353075; BD Biosciences, San Diego, CA) at a concentration of 3000 cells per well in growth medium. Following overnight incubation, the medium was replaced with adipogenic differentiation medium, which was high-glucose DMEM supplemented with 10% FBS, 2 mM GlutaMAX-I, 0.5 mM 3-isobutyl-1-methylxanthine (IBMX; Wako), 10 µg mL−1 insulin (Wako), 1 µM dexamethasone (Wako), 200 µM indomethacin (Wako), and 1× penicillin–streptomycin. Cells were cultured in the presence of the test compounds for the indicated periods. For osteogenic differentiation, hMSCs were plated into 96-well plates (353075; BD Biosciences) at a concentration of 1000 cells per well in growth medium. Following overnight incubation, the growth medium was replaced with osteogenic differentiation medium, which was low-glucose DMEM supplemented with 10% FBS, 2 mM GlutaMAX-I, 10 mM β-glycerophosphate (Wako), 0.05 mM ascorbic acid-2-phosphate (Wako), 0.1 µM dexamethasone, and 1× penicillin–streptomycin. Then cells were cultured in the presence of the test compounds for the indicated periods. Approval for the use of hMSCs was granted by the ethical review committee of Takeda Pharmaceutical Company Limited.
Oil Red O staining and measurement of adiponectin
For lipid staining, cells were fixed in 4% paraformaldehyde (Wako) for 30 min and washed three times with PBS. Then the cells were stained with 0.36% Oil Red O solution in 60% isopropanol (Chemicon) for 50 min at room temperature and were washed three times with distilled water. Adiponectin in the culture medium was determined with a human adiponectin ELISA kit (R&D Systems, Minneapolis, MN) according to the manufacturer’s instructions. Absorbance was measured at 450 nm using a microplate reader (Varioskan Flash, Thermo Electron, Finland).
Alkaline phosphatase staining
Cells were fixed with 4% paraformaldehyde for 30 min and washed three times with PBS. Then staining for alkaline phosphatase was performed with an alkaline phosphatase substrate kit III (Vector Laboratories, Burlingame, CA) according to the manufacturer’s instructions.
Calcium assay
Cells were washed twice with PBS and then lysed with saline containing 10 mM Tris-HCl and 0.2% Triton X-100. Aliquots of the lysate were subjected to assay with a BCA protein assay kit (Pierce Biotechnology, Rockford, IL) according to the manufacturer’s instructions. Absorbance of the resultant solution was measured at 562 nm using a microplate reader (Varioskan Flash). HCl was added to the remaining lysate at a final concentration of 0.5 N, after which dissolved calcium was measured with a Calcium E-Test Kit Wako (Wako). Absorbance of the resultant solution was measured at 610 nm using a microplate reader (Varioskan Flash), and the results were normalized by the protein concentration.
Results
Development of an assay system using mouse ES cells
First, we generated EBs from mouse ES cells to allow differentiation into various types of cells. For the generation of EBs, feeder-free ES cells were dispensed into nonadherent round-bottomed 96-well plates and cultured in suspension. To determine the optimal duration of culture, we examined the expression of early differentiation markers by quantitative RT-PCR. Expression of the primitive streak marker Brachyury, the mesoderm marker Flk1, and the endoderm marker Sox 17 increased rapidly between day 4 and day 5, whereas expression of the ectoderm marker Sox1 increased gradually ( Fig. 1 ). On the other hand, expression of the pluripotent markers Oct3/4 and Nanog gradually declined over the culture period ( Fig. 1 ). These results suggest that ES cells differentiated into all three germ layers when EBs underwent suspension culture for four or more days.
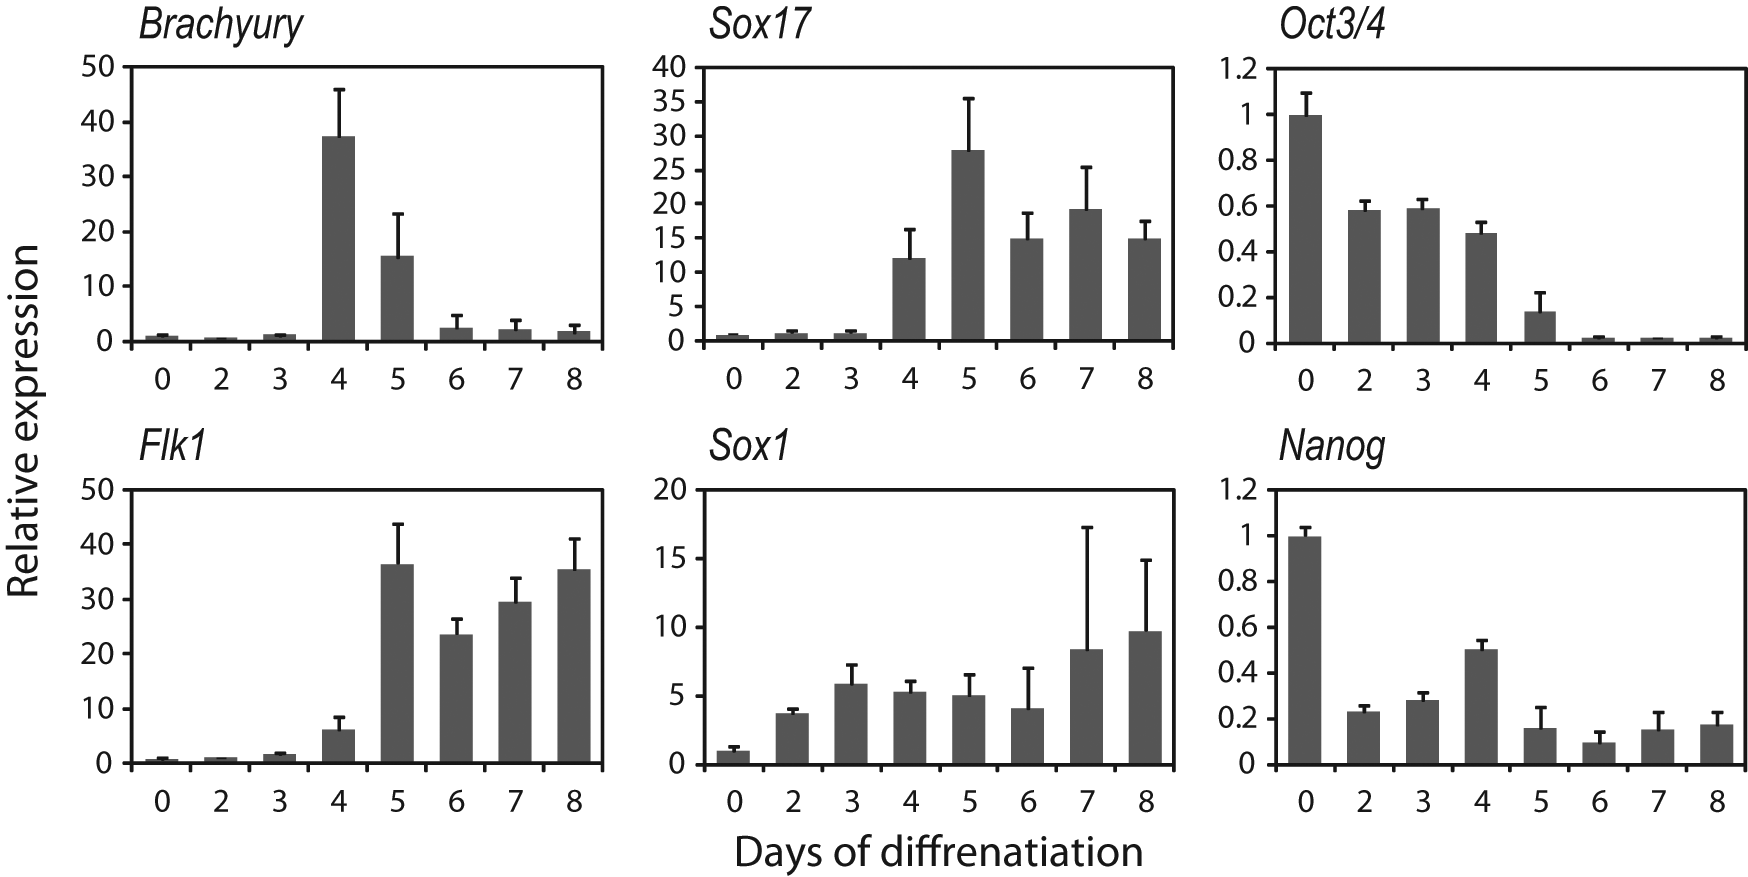
Expression of early differentiation markers during embryoid body (EB) formation. Embryonic stem (ES) cells were cultured in suspension for the indicated time periods, and gene expression was analyzed by quantitative RT-PCR. Results were normalized for the Gapdh mRNA level. The y-axis indicates the relative change of mRNA expression compared with that in undifferentiated ES cells. Data are the mean ± SD (n = 5).
Cellular aggregates such as EBs are not suitable for high-throughput assays because it is difficult to obtain uniform size and quality on a large scale. Therefore, to obtain reproducible data in a 96-well plate format, after suspension culture for four days, we dissociated the EBs with trypsin–EDTA and created monolayer cultures ( Fig. 2C ). The cells in monolayer culture showed elevation of the expression of mesodermal genes, such as Flk1 and Brachyury, over time as culture was continued ( Fig. 2A ). Expression of the neural progenitor marker Nestin also increased in a similar manner, whereas Sox1 expression decreased slightly ( Fig. 2A ). Expression of the endoderm marker Foxa2 decreased after the change to monolayer culture ( Fig. 2A ). Expression of the other endoderm markers goosecoid and Sox17 was also low in monolayer culture, whereas expression of these genes increased during EB formation ( Fig. 1 , data not shown), suggesting that the monolayer culture was not suitable for endodermal differentiation. Expression of Oct3/4 and Nanog decreased gradually but remained detectable throughout the culture period ( Fig. 2A ). Expression of the trophectoderm marker caudal-related homeobox gene 2 (Cdx2) was also upregulated ( Fig. 2A ). These results suggest that ES cells differentiated into the mesodermal, ectodermal, and trophectodermal lineages under these culture conditions.
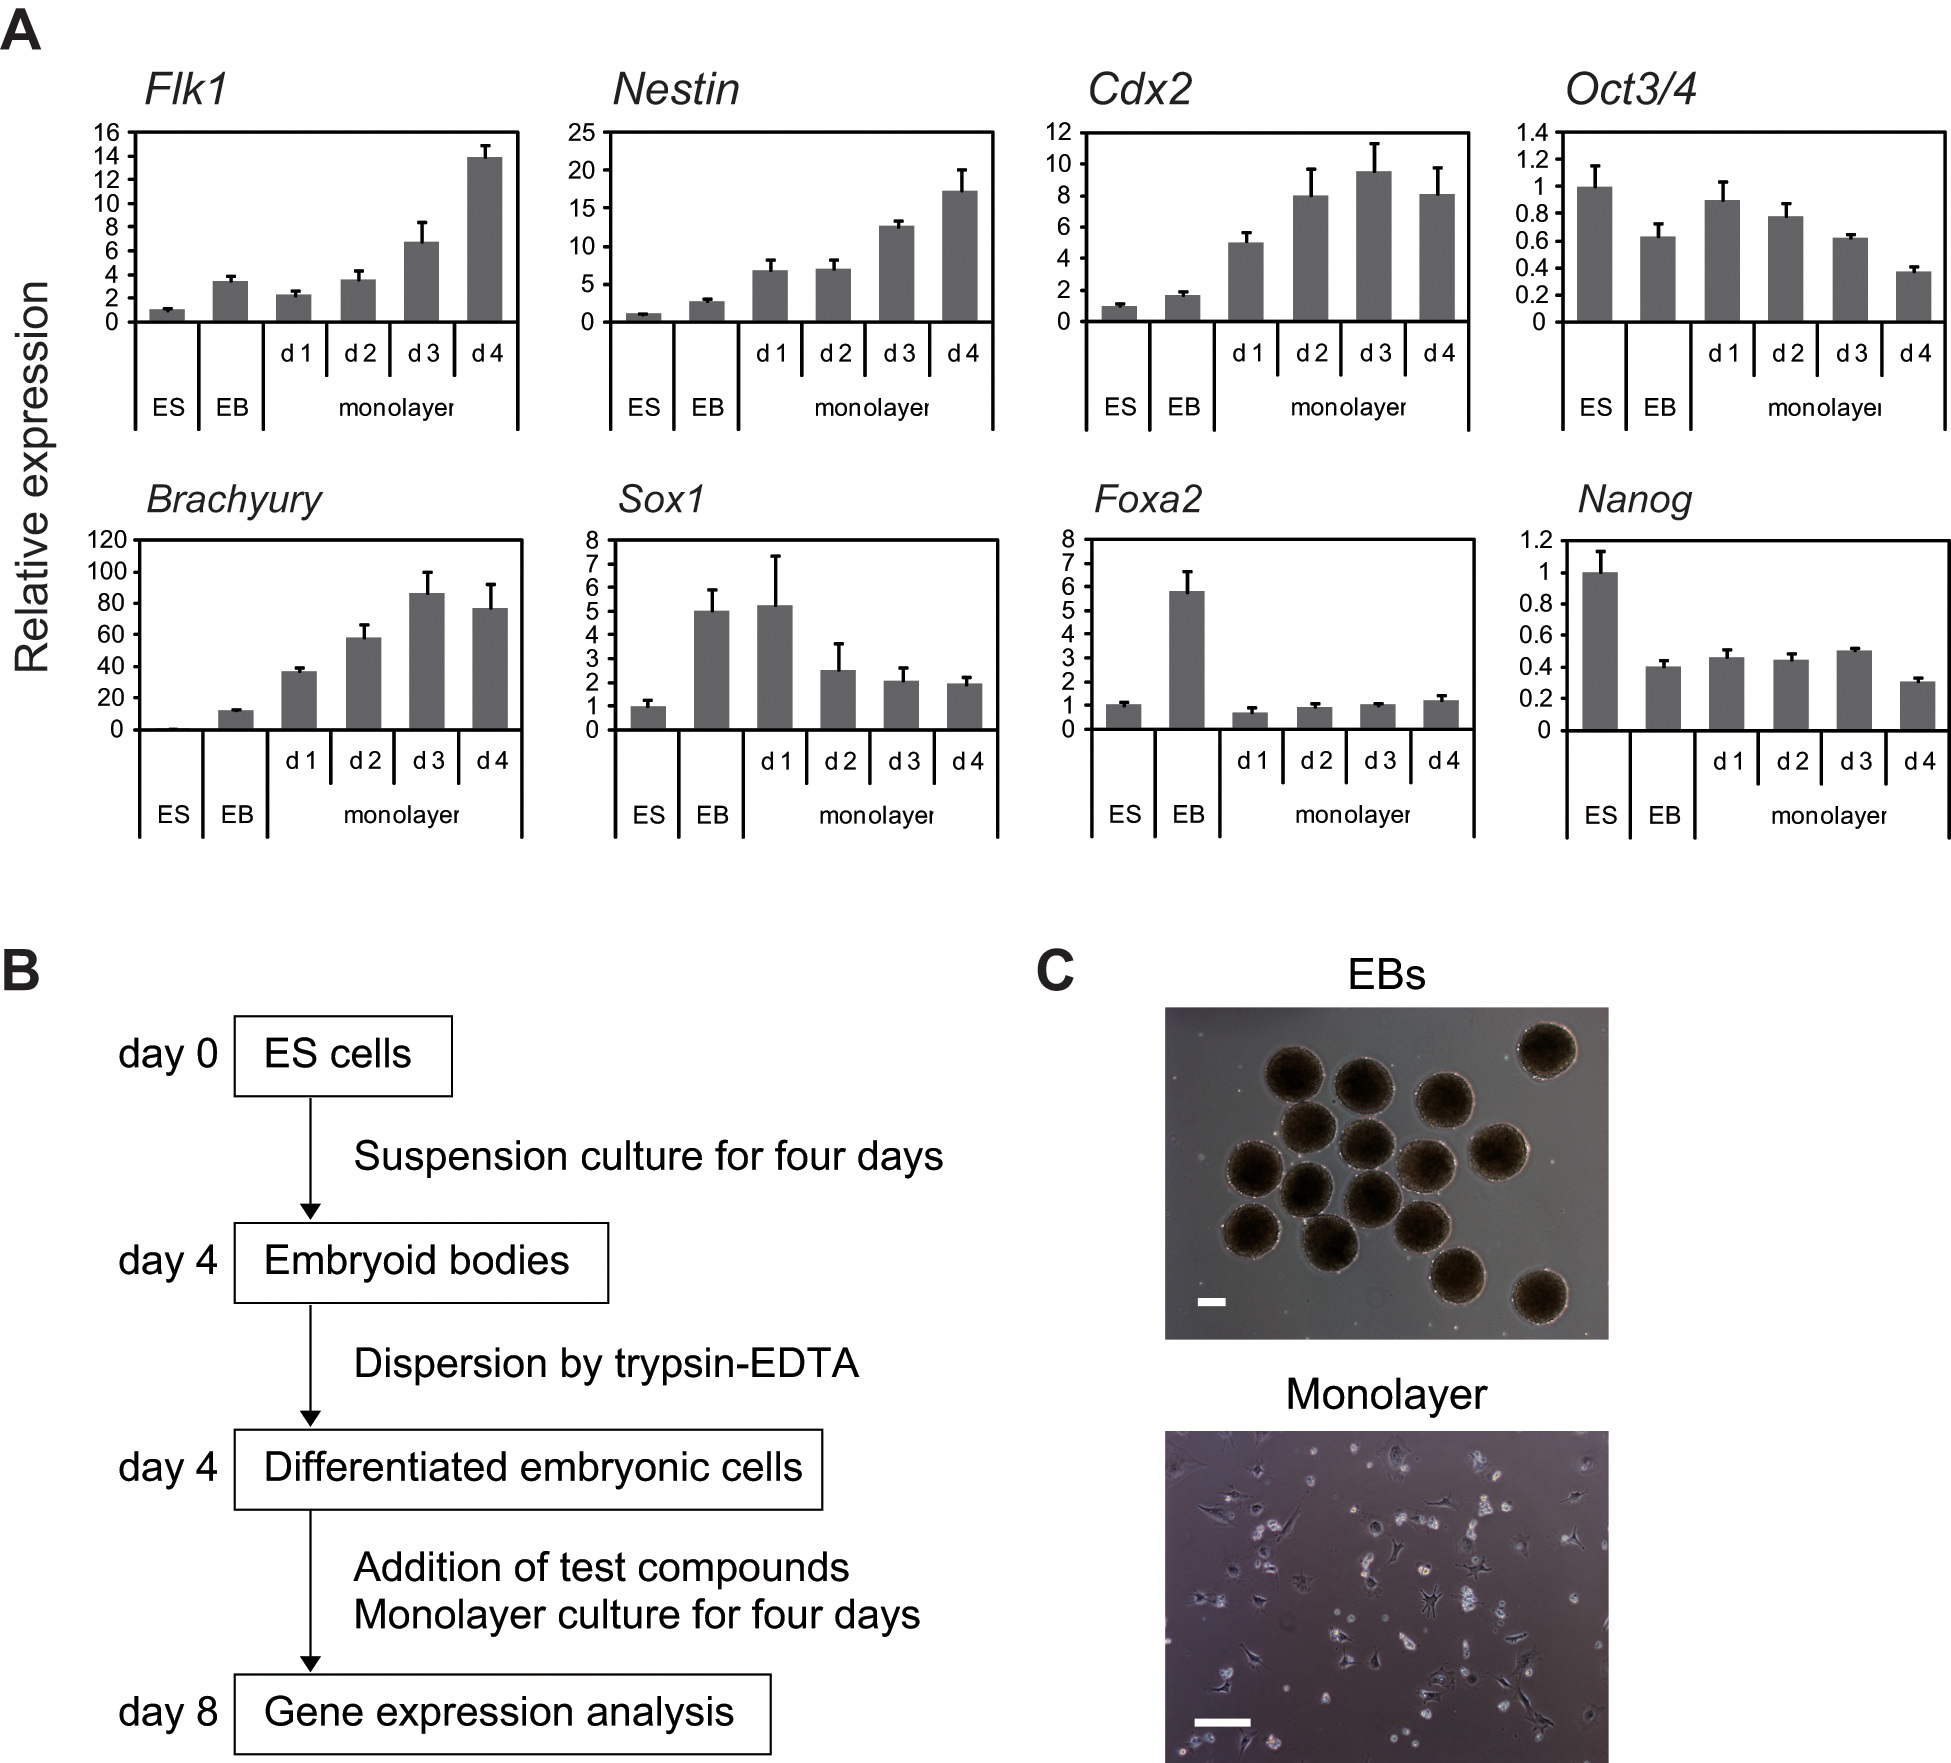
Development of an assay system using mouse embryonic stem (ES) cells. (
For evaluation of the effects of compounds on stem cell differentiation, cells were exposed to the test compounds for four days of monolayer culture, after which gene expression profiles were examined by quantitative RT-PCR. A diagram illustrating the entire procedure is shown in
Figure 2B
. As differentiation markers, we selected the following seven genes: Flk1 as a mesoderm marker, Actc1 as a cardiomyocyte marker, Acta2 as a smooth muscle marker, Tie2 as an endothelial cell marker, neurofilament heavy chain (Nefh) and βIII tubulin (Tubb3) as neuronal markers, and Nanog as a pluripotent marker. Expression of these genes was confirmed to be high and reproducible in pilot studies. We did not select endodermal markers for primary screening because of the low expression of those genes. Gapdh expression was also examined as an internal control. Because expression of Gapdh was well correlated with cell numbers as measured by an adenosine triphosphate (ATP)–based assay (
We investigated whether compounds that had previously been reported to have a regulatory role in the differentiation of stem cells could alter the gene expression profile in our assay system. Cells derived from EBs were treated with various compounds, as indicated in
Figure 2B
, and expression of the eight selected genes was examined by quantitative RT-PCR. As a result, expression of at least one gene among the eight selected genes was significantly altered by more than twofold by the compounds, including BIO (a glycogen synthase kinase-3-beta [GSK3β] inhibitor), PD169316 (a p38 MAPK inhibitor), retinoic acid, dexamethasone, BIX-01294 (a G9a histone methyltransferase inhibitor), SB431542 (an activin receptor-like kinase 5 inhibitor), and SAHA (a histone deacetylase inhibitor) (
Screening of LOPAC
Using this assay system, we also screened 1280 compounds in LOPAC, a commercially available compound library. The library was screened at a concentration of 3 µM in accordance with a previous report. 17 Cells were treated with each test compound at a concentration of 3 µM and cultured for four days. Expression of the eight selected genes, described above, was examined by three sets of multiplex quantitative RT-PCR assays (set 1, Gapdh, Acta2; set 2, Tubb3, Actc1, and Nanog; set 3, Tie2, Nefh, and Flk1). We found that 56 compounds decreased Gapdh expression below 5% of that with the DMSO control, suggesting that these compounds caused a marked decrease of cell numbers. Therefore, these cytotoxic compounds were excluded from further analysis. Compounds that increased the expression of at least one gene by more than twofold were selected and retested at the same concentration to verify their activity. As a result, 52 compounds (4.1% of the total) that showed reproducible results were selected ( Table 1 ). The hit rate of each gene was 2.7% (Flk1), 0.2% (Actc1), 1.6% (Acta2), 0.6% (Tie2), 0.5% (Nefh), 0.4% (Tubb3), 0.0% (Nanog), and 1.1% (Gapdh) (there was overlap among the hits for each gene). These results show that we were able to identify more compounds regulating the differentiation of ES cells by examining the expression of multiple genes than with any single gene. The compounds included BIO, PD169316, and retinoic acid, which have previously been reported to regulate the differentiation of ES cells, indicating that regulatory compounds for stem cells were reliably identified by screening.
Effect of Hit Compounds on the Expression of Eight Genes
The value indicates relative change in mRNA expression compared to DMSO control. The results are color-coded. Blue is greater than twofold increase and red is greater than twofold decrease.
Fourteen compounds, including the ROCK inhibitor Y-27632, the CDK2 inhibitor SU9516, and forskolin, were found to increase Gapdh expression by more than twofold (
Table 1
), suggesting an increase of cell numbers under these culture conditions. To confirm this, we examined cell numbers by monitoring ATP levels in the wells. All 14 compounds increased the ATP content (
We were unable to identify compounds that induce Nanog expression ( Table 1 ). On the other hand, when the cells were treated with LIF, expression of Nanog increased significantly (data not shown), showing that this assay system has the potential to identify the compounds that maintain the pluripotency of mouse ES cells. Screening of larger libraries might be required for the identification of compounds that maintain the pluripotency of mouse ES cells.
Gene expression profiles of the compounds
To further analyze the effects of these compounds on the differentiation of ES cells, we also examined the expression of 20 other markers: Oct3/4, Sox2, Klf4, and Akp2 (pluripotential markers); Fgf5 (a primitive ectodermal marker); Brachyury and Snail (primitive streak markers); Cdx2 and Bmp4 (trophectodermal markers); Cxcr4 (a mesodermal and endodermal marker); Gata4 and Laminin B1 (extraembryonic endodermal markers); Nestin and p75NTR (neural markers); Acta1 and Tpm1 (skeletal muscle cell markers); Cnn1 (smooth muscle cell markers); Opn (an osteoblast marker); c-kit (a hematopoietic stem cell marker); and Sox9 (a chondrocyte marker). The expression of all 28 genes, including the 8 genes used for screening, was examined by quantitative RT-PCR. Among the 52 compounds, 32 increased the expression of multiple genes by more than twofold. To compare each of the gene expression profiles, we performed hierarchical clustering of expression data on the 28 genes for these 32 compounds (
Fig. 3
). As a result, we found that the compounds with similar structures and pharmacological actions had similar gene expression profiles. For example, thiothixene hydrochloride, perphenazine, and cis-(Z)-flupentixol dihydrochloride (
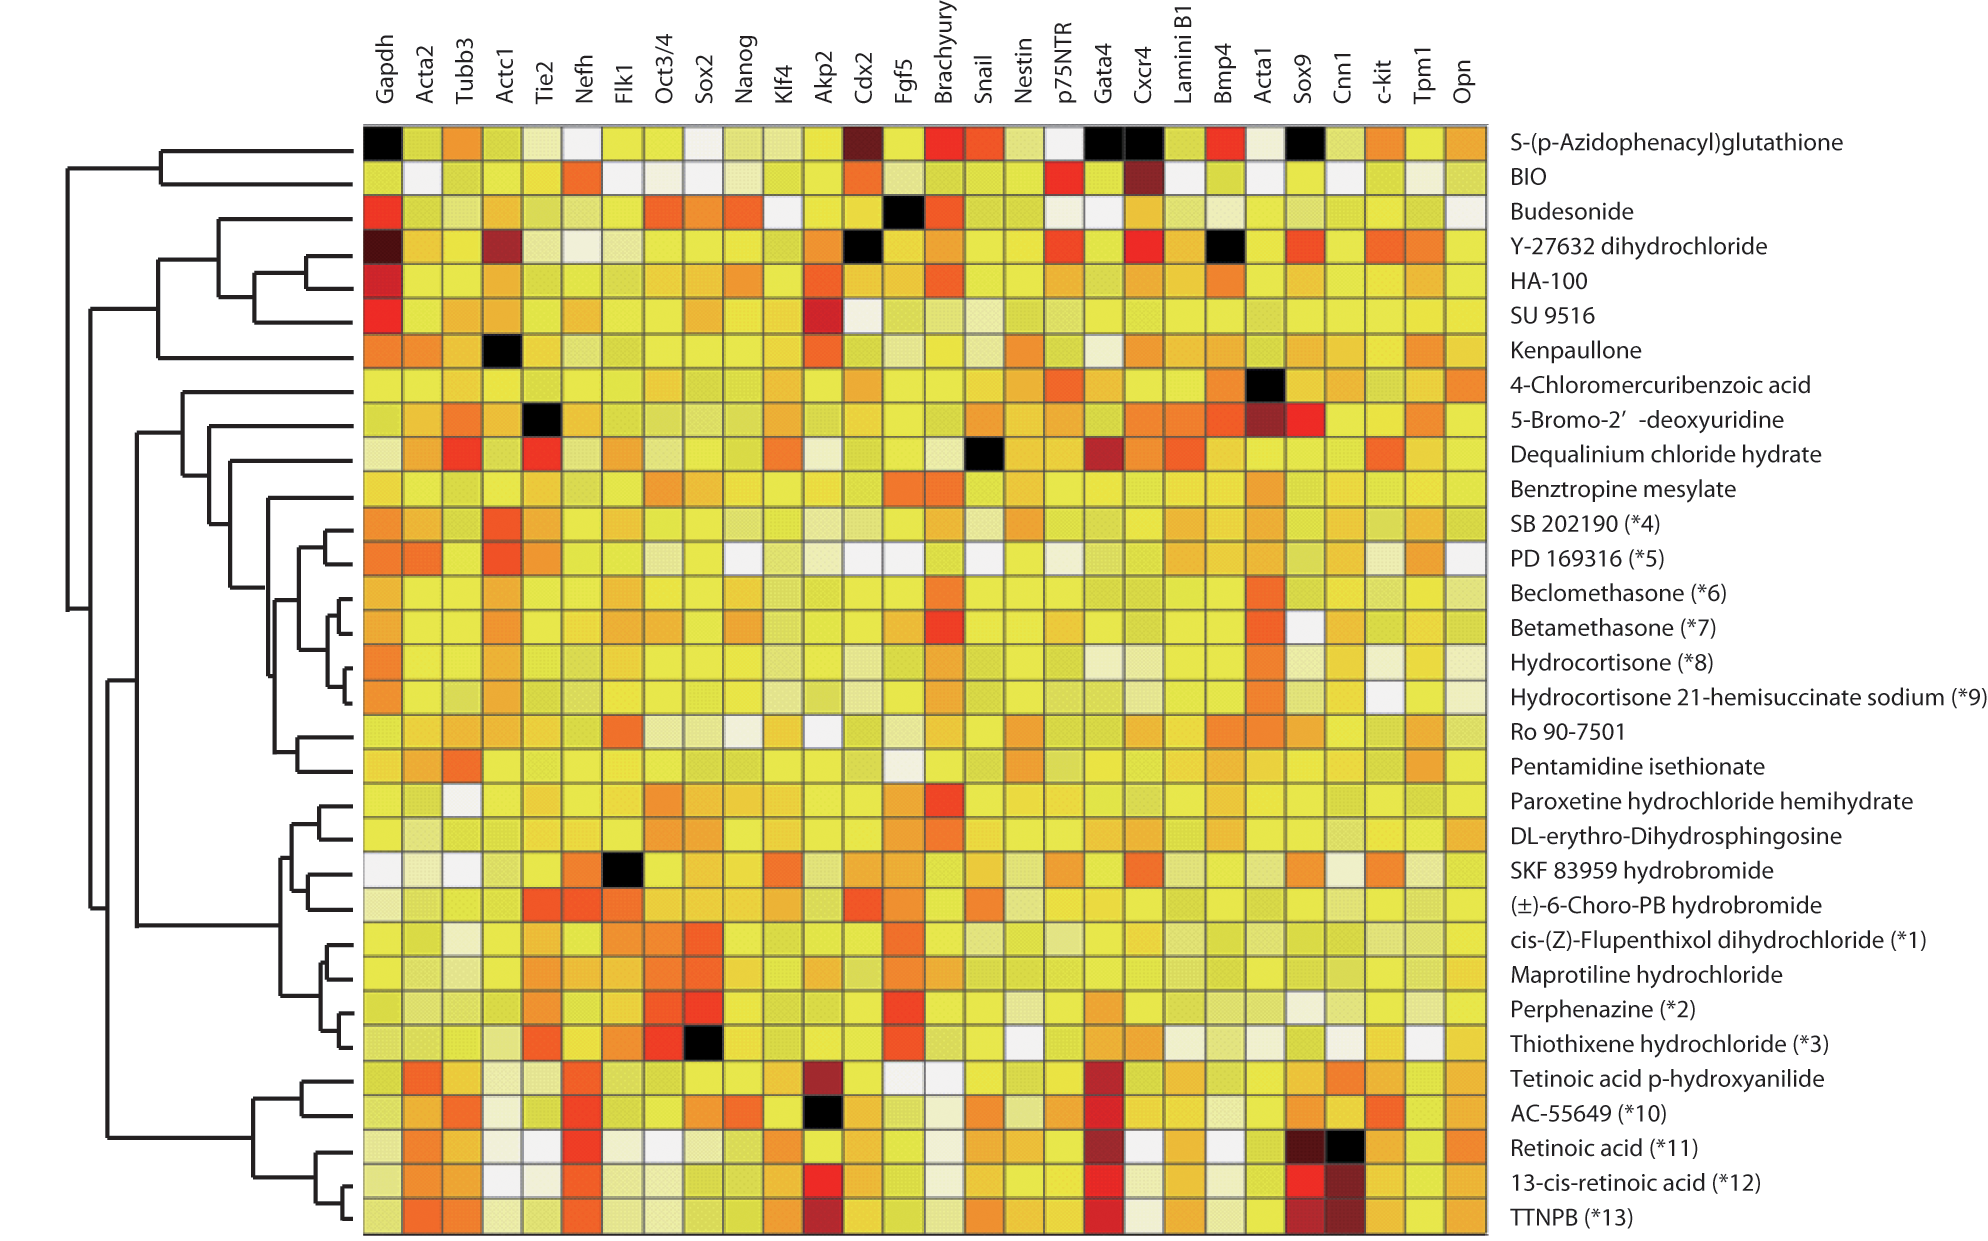
Gene expression profiles of the compounds. Cells were treated with compounds for four days (days 4–8), and the expression of 27 differentiation marker genes and Gapdh was analyzed by quantitative RT-PCR. Results were normalized for the Gapdh mRNA level (except for Gapdh itself). Hierarchical clustering of the relative expression data for each of the 32 compounds was performed with Spotfire software using the weighted pair group method with arithmetic average. The compounds included dopamine antagonists (*1–3), p38 MAPK inhibitors (*4 and *5), corticosteroids (*6–9), and retinoic acid receptor agonists (*10–13).
Effect of the compounds on hMSCs
We expected that compounds altering the gene expression profile of ES cells might also influence the differentiation of adult stem cells. To test this hypothesis, we examined the effects of the 52 compounds identified by screening the LOPAC library on adipogenic or osteogenic differentiation of hMSCs. First, adipogenic differentiation of hMSCs was induced in the presence of each compound at 3 µM. After five days, expression of the adipocyte marker Adiponectin was examined by quantitative RT-PCR. Among the 52 compounds, the ROCK inhibitor Y-27632, the protein kinase inhibitor HA-100, and the vanilloid receptor antagonist capsazepine significantly increased Adiponectin expression compared with the DMSO control (
Fig. 4A
and
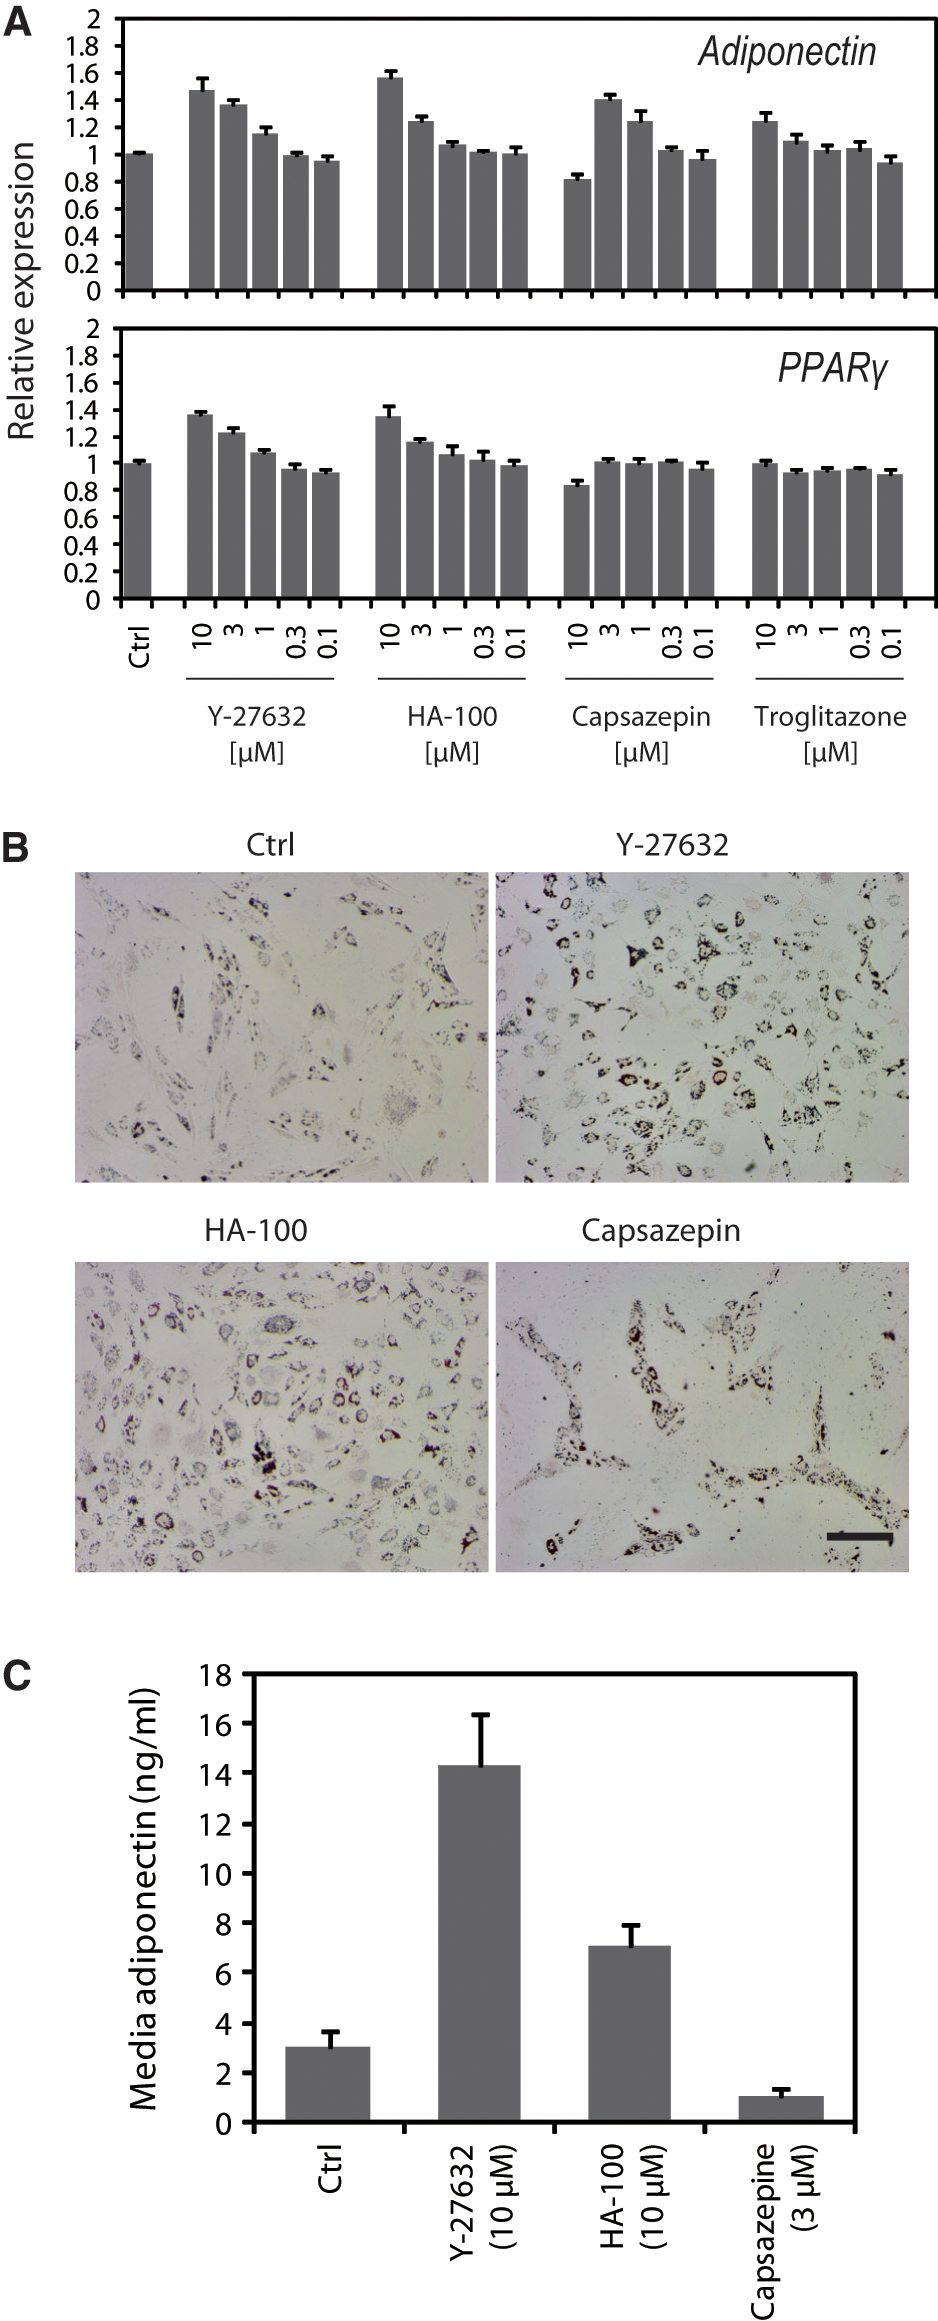
Effect of the compounds on adipogenic differentiation of human mesenchymal stem cells (hMSCs). (
Next, we investigated the effects of the compounds (at 3 µM) on the osteogenic differentiation of hMSCs. After eight days, expression of the early osteoblast marker alkaline phosphatase (Alpl) was examined by quantitative RT-PCR. Among the 52 compounds, the GSK3β inhibitor BIO and the thymidine analogue 5-bromo-2′-deoxyuridine (BrdU) caused a significant increase of Alpl expression compared with the DMSO control (
Fig. 5A
and
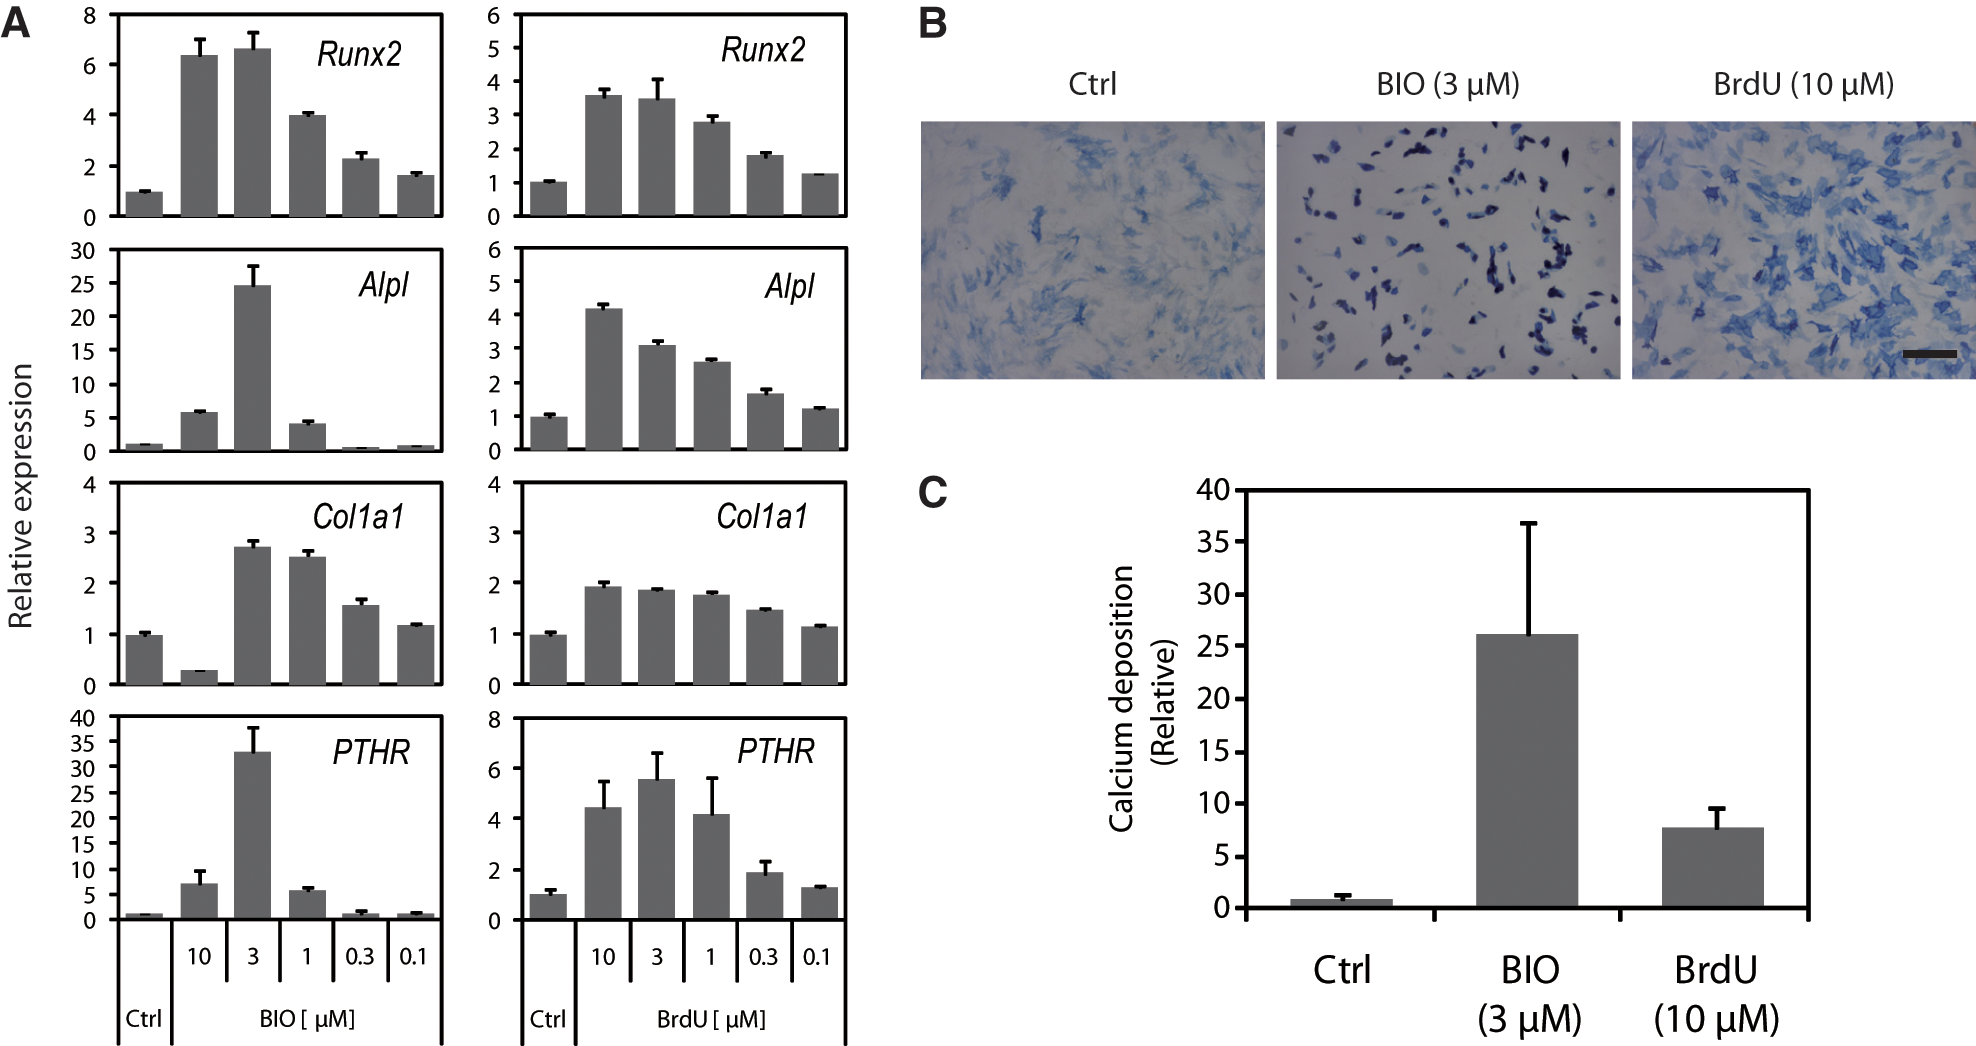
Effect of the compounds on osteogenic differentiation of human mesenchymal stem cells (hMSCs). (
Discussion
To identify compounds that regulate stem cells, we developed a gene expression–based screening system using mouse ES cells. By examining the expression of multiple genes, we were able to identify a broad range of compounds that altered the gene expression profile of mouse ES cells. In addition, by comparison of the gene expression data, we were able to further classify the compounds detected by screening. Gene expression–based screening has already been carried out with various cell lines.15,16 In several cases, this strategy has been used for the identification of compounds that induce differentiation of cancer cells.15,16 Our present results show that gene expression–based methods can also be used for identification of compounds regulating the differentiation of mouse ES cells.
With the present system, we differentiated ES cells into the three primary germ layers by generating EBs. We confirmed that endodermal, ectodermal, and mesodermal differentiation of EBs was induced. After switching to monolayer culture, the cells differentiated into mesoderm, ectoderm, and trophectoderm, with few definitive endodermal cells being generated as shown by the low expression of endodermal markers. Therefore, we did not use the endodermal markers for screening. Although a wide range of compounds were identified as hit compounds, we could not necessarily detect compounds that regulate endodermal differentiation. Many organs derived from the endoderm are of great interest, so compounds controlling endoderm differentiation are also needed. Recently, the culture conditions for differentiating mouse and human ES cells into definitive endoderm were reported,19,20 and such conditions may be helpful for identifying compounds that regulate definitive endodermal differentiation.
We treated the cells with test compounds for four days in monolayer culture and then examined the expression of selected marker genes on day 8. In our preliminary experiments, treatment for one or two days did not significantly alter expression of the marker genes. To detect effects of the compounds in our system, treatment for a longer period was needed. Treatment for four days is the suitable period for evaluating compounds in the primary screening using the selected markers, but we were not able to analyze early effects of hit compounds. To examine more direct effects of compounds, microarray expression analysis at earlier times, which could reveal the early gene expression patterns leading to the gene expression changes on day 8, might be effective.
By screening a commercially available compound library (LOPAC) with our system, we identified a variety of compounds, including many kinase inhibitors. These results are consistent with the reports that various kinase inhibitors have been shown to regulate the differentiation of stem cells.21–23 Many corticosteroids were also included. The gene expression profiles for these compounds were similar to that of dexamethasone, a glucocorticoid receptor agonist (data not shown), indicating that these compounds had similar effects on the differentiation of mES cells. Dexamethasone has been reported to induce the osteogenic differentiation of mesenchymal stem cells and the differentiation of mouse ES cells into chondrocytes, hepatocyte-like cells, or hematopoietic cells.24–27 In a similar way, the corticosteroid compounds identified by this screening method may be useful for regulating the differentiation of various types of cells.
Kenpaullone was identified as a strong inducer of the cardiac lineage marker Actc1. Although kenpaullone was a potent inhibitor of GSK3β and CDK, other CDK inhibitors and the specific GSK3β inhibitor CHIR99021 did not increase Actc1 expression ( Table 1 , data not shown). A previous study has demonstrated that kenpaullone can replace the reprogramming factor Klf4 during the reprogramming of murine fibroblasts through a mechanism other than inhibition of GSK3β and CDK. 6 Thus, kenpaullone may modulate another cellular process common to reprogramming toward the pluripotent state and differentiation into cardiogenic mesoderm.
Unexpectedly, the thymidine analogue BrdU was identified, suggesting that BrdU may alter cellular differentiation. A recent investigation has also shown that BrdU decreases the proliferation and perturbs the differentiation of neural stem cells and progenitor cells. 28 BrdU is commonly used to examine the proliferation of various cell populations. These results suggest that the effect of BrdU on cellular differentiation should be carefully assessed in each experiment.
The ROCK inhibitor Y-27632 was found to increase Gapdh expression, indicating that it increased cell numbers in our system. In a recent study, Y-27632 was shown to inhibit apoptosis and increase the survival of dissociated human ES cells. 29 Because we dissociated EBs with typsin-EDTA before exposure to the test compounds, inhibition of apoptosis may be a possible mechanism by which Y-27632 increased cell numbers. We also identified other compounds that increased cell numbers, and these compounds may be useful for inhibiting the apoptosis of stem cells as Y-27632 inhibits the apoptosis of human ES cells.
Multiple phenothiazine analogues were identified by screening. These compounds decreased Gapdh expression during culture, suggesting that cell numbers may have decreased. Toxicity of the test compounds is one of the concerns with this assay system. It was possible that phenothiazine analogues might cause early toxicity, and recovery from such toxicity might then affect the gene expression profile. To investigate this possibility, we examined cell numbers by an ATP-based assay after 24 h of treatment with the compounds. As a result, the compounds reduced cell numbers, but many of the cells were still viable after 24 h (data not shown). These results suggest that these phenothiazine analogues did not have severe early toxicity under our culture conditions, but further studies would be needed to determine how the phenothiazine analogues changed the cellular status.
It was noteworthy that several compounds affected not only the differentiation of mouse ES cells but also that of human MSCs. A recent study showed that a molecule that induced the differentiation of preadipocytes also improved glucose metabolism in diabetic animals, 7 whereas other molecules that induced osteogenic differentiation of undifferentiated mesenchymal cells also improved bone loss in a mouse model of osteoporosis.8,9 These results suggest that the compounds enhancing adipogenesis or osteogenesis by hMSCs may be candidates for metabolic drugs or bone anabolic agents.
Because most adult stem cells exist as minor populations in vivo and have limited capacity to proliferate in culture, it is difficult to obtain adequate amounts of these cells for large-scale screening. Our screening method based on mouse ES cells has the potential to identify candidate compounds that control the differentiation of adult stem cells. In the present study, only hMSCs were used as adult stem cells. Further studies using other types of adult stem cells, such as neural stem cells, may lead to the detection of novel effects of various compounds on stem cell differentiation.
In conclusion, we established a gene expression–based screening system with mouse ES cells and identified various compounds that regulated stem cells. This screening method was effective for identifying and classifying a wide range of compounds that regulate the differentiation of both ES cells and adult stem cells.
Footnotes
Acknowledgements
We thank Drs. Nobuhiro Suzuki and Atushi Nakanishi for their helpful suggestions and comments, as well as Drs. Koji Yamamoto and Nobuyuki Miyajima for technical advice. We also thank our many colleagues at the Biology Research Laboratories for their support and encouragement.
References
Supplementary Material
Please find the following supplemental material available below.
For Open Access articles published under a Creative Commons License, all supplemental material carries the same license as the article it is associated with.
For non-Open Access articles published, all supplemental material carries a non-exclusive license, and permission requests for re-use of supplemental material or any part of supplemental material shall be sent directly to the copyright owner as specified in the copyright notice associated with the article.