
Abstract
Strict quality control of cells is required for the standardization and interpretation of results in all areas of cell-based research, especially in drug discovery. Real-time cellular analysis using electrical impedance as a readout offers a rapid and highly reproducible method for quality control as it provides a quantitative measure of overall cell morphology and growth. In a case study, the authors demonstrate that samples of a single cell line obtained from several different labs show clear differences in their impedance profiles when compared with the corresponding standard cell line. A number of kinetic parameters were derived from the impedance profiles and used to quantify the differences among these cell lines. Our findings indicate that this methodology can detect cell line differences including mix-ups or contaminations, genetic alterations, and potential epigenetic changes occurring during passaging, all of which can occur in the time scale of a screening campaign. Finally, we provide evidence that these impedance profile differences can be predictive of different outcomes in cell-based functional assays for the effects of small molecules on otherwise seemingly identical cell lines.
Introduction
G
Unfortunately, even for validated cell lines obtained directly from a reputable source (such as a biological resource center), an independent lab can be absolutely certain of cell identity and quality only of a line that has been recently subjected to testing because practitioners of the most careful tissue culture techniques are not infallible and it is common practice to pass cell lines from researcher to researcher. 10 In addition, continuous cell lines often show high levels of genomic instability and thus could drift genetically during passaging or in response to the artificial selection of subtle differences in culture conditions. 6,11 Finally, nongenetic mechanisms can induce changes in cell behavior in a significant way in response to variations in tissue culture conditions and techniques as well as from the total number of passages in culture; this is especially true in primary cells. 12–14 These changes may occur in a relatively short time period and thus can be a confounding issue during cell-based drug-screening campaigns in which large quantities of cells must be grown, prepared, and plated. Thus, it is crucial that researchers frequently verify the identity and quality of their cells, ideally before every critical experiment and during screening.
Here we introduce an approach to rapidly and routinely monitor cell line quality using an impedance-based readout to measure general cell morphology and growth rates. Cells are seeded onto plates containing microelectrodes (E-Plates), allowing for precise measurement of changes in electrical impedance under normal tissue culture conditions. 15 These impedance measurements are expressed as a cell index value, which corresponds to cell number, shape, and degree of substrate attachment. By plotting cell index (CI) values over time, a signature real-time cellular analysis (RTCA) profile can be generated that could potentially be used to monitor cell quality and assess cell line identity in real time. Previous work indicated that isolates of primary cells from different sources exhibited qualitatively different cellular response profiles, as did a continuous cell line at a different passage number. 16 Here we report the development of a rigorous and quantitative methodology based on RTCA profiles to assess the effects of both passage number and cell sourcing on cell quality. In addition, we determine the causes for some of the observed changes in cell quality as well as the potential impact of these changes on cell-based assay results. This approach to cell line quality control offers several advantages over current methods, including rapid turnaround time, reduced reagent costs, and applicability to any adherent cell line.
Materials and Methods
Cell culture
HeLa cells (#CCL-2; ATCC, Manassas, VA) were maintained at 37 °C and 5% CO2 in Eagle’s minimum essential media (ATCC #30-2003) supplemented with 10% fetal bovine serum (#SH30071.03; Hyclone, Logan, UT), 1% L-glutamine, and 1% penicillin/streptomycin (#30-002-CI; Mediatech, Manassas, VA). Cells were tested for mycoplasma using MycoAlert Mycoplasma Detection Kit (Cat #LT07; Lonza, Rockland, ME) according to the manufacturer’s instructions, and infected cells were treated and maintained with Plasmocin at the manufacturer’s suggested concentration (Cat #ant-mpt Invivogen, San Diego, CA). A549 fibroblasts (ATCC #CCL-185) were grown in F12-K media (ATCC #30-2004) supplemented as above. For the passaging experiment, HeLa cells from ATCC were thawed and expanded for four passages according to the manufacturer’s instructions, then split at 1/10 total cell number on an alternating 3- and 4-day interval. All of these cells were maintained and passaged in isolation from other cell lines throughout the study.
STR fingerprinting
Samples were submitted to ATCC for authentication via STR analysis using the PowerPlex 1.2 System (#DC6101; Promega, Madison, WI).
RTCA profiling
Cells were plated in E-Plate 96-well plates (#05232368001; Roche Applied Science, Indianapolis, IN) and monitored using the xCELLigence system (Roche Applied Science #053316 25001) at 30-min intervals.
Statistical analysis
Parametric values were compared by the two-tailed, unequal variance Student’s t test using a minimum of four replicate wells. Mean absolute percentage error (MAPE) was calculated as the average of the absolute value of the percentage difference between the test and reference well CI values over the duration of the experiment.
Cytotoxicity assay
Cells were seeded at 2500 cells per well onto an E-Plate. After 20 h of RTCA profiling, the cells were treated with the indicated compounds prediluted in growth media to a final maximal DMSO concentration of 0.1% or less, and responses were measured at 30-min intervals for 3 days. A duplicate E-Plate was treated in the same manner, and 25 h after dosing, the media were discarded and replaced with fresh media containing WST-1 (Roche Applied Science, #11644807001) diluted 1:10. The plate was incubated for 1 h at 37 °C, and 5% CO2, lysates were transferred to a standard 96-well plate and absorbance measured at 450 nm.
G-protein–coupled receptor (GPCR) assays
Cells were seeded at 10 000 cells per well onto an E-Plate. After 22 h of RTCA profiling, the cells were stimulated with agonist, and responses were measured at 2-min intervals for 3 h.
Gene expression analysis
RNA was purified using the High Pure RNA Isolation Kit (Roche Applied Science, #11828665001) and quantified using Quant-iT RiboGreen RNA Reagent and Kit (#R11491; Molecular Probes, Eugene, OR). The Human Cell Cycle Regulation Panel, 96 (Roche Applied Science, #05339359001) was used to conduct quantitative PCR on 20 ng of total RNA per reaction on the LightCycler 480 Real-Time PCR Instrument (Roche Applied Science #05015243001).
MAPK phosphorylation assay
Fifty thousand cells were grown overnight in a six-well plate, serum starved for 1 h, stimulated with 10 µM histamine, and harvested in ice-cold RIPA buffer supplemented with protease and phosphatase inhibitors (Roche Applied Science #04 693 132 001 and #04 906 845 001). Fifteen micrograms of each lysate was fractionated by SDS-PAGE, transferred to nitrocellulose, immunoblotted with an antibody against phosphorylated MAPK (ERK1/2, #9101; Cell Signaling, Danvers, MA) or an antibody against total MAPK (Cell Signaling #4695) and visualized using the BM Chemiluminescence Western Blotting kit from Roche Applied Science (#11520709001). Results were scanned on a ChemiDoc XRS+ (#170-8265; BioRad, Hercules, CA), and mean pixel intensities in equivalent areas bounding each band were background corrected and quantified with the manufacturer’s software. Phosphorylation was quantified as the ratio of the phospho- to total MAPK band intensities in each lane, normalized to the untreated sample.
Results
A case study on cell lines obtained from different sources was conducted to assess the utility of RTCA profiling for use in quality control monitoring. Five different test cultures of HeLa cells were obtained from three different laboratories located in academic institutions and two different laboratories located in biotechnology companies. In addition, a reference culture was obtained from ATCC. Visual inspection of these cultures revealed some morphological heterogeneity within and between cultures, but none showed morphologies that were unambiguously outside the range of normal HeLa cells ( Fig. 1A ). These cultures were assessed for differences in adhesion, growth rate, and overall morphology by seeding in E-Plates at four different cell densities and monitoring for impedance changes over the course of 2 days; representative results are shown in Figure 1B .
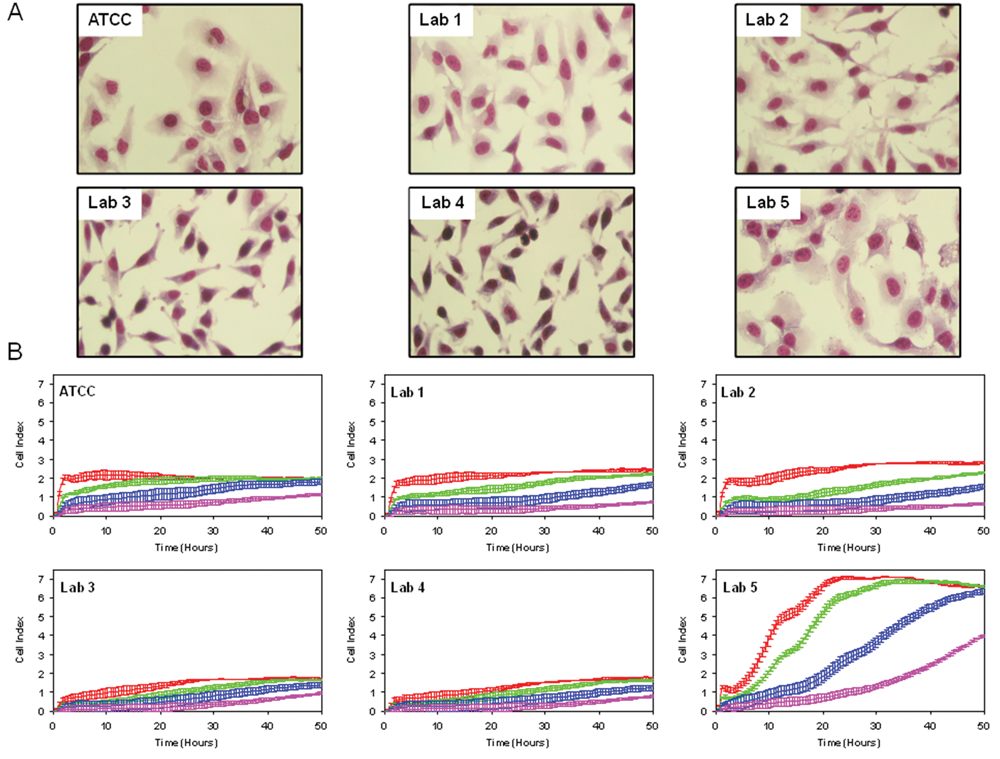
Profiling of HeLa cell lines. (
HeLa cells from lab 5 differed considerably from the other isolates in the overall RTCA profiles, and there appeared to be small differences among the other isolates as well ( Fig. 1B ). Similar results were obtained with collected isolates of A549 lung carcinoma cells, indicating that these RTCA profile variations may be a general phenomenon ( Fig. 2 ). To test whether the differences are significant, the HeLa RTCA profiles were quantitatively analyzed for different parameters corresponding to cell adhesion to the E-Plate surface (maximum CI from 0–3 h), maximal growth rate (3–24 h CI doubling time), and stationary phase morphology (maximum CI at 48 h; Fig. 3A ). Each of the HeLa cell isolates differed significantly from the ATCC reference in both the adhesion and stationary phase morphology parameters ( Fig. 3B and C ). HeLa isolates from labs 3 to 5 exhibited significantly different maximal CI doubling time, which primarily reflects increases in cell number but may also include changes in morphology as the cells reach confluence ( Fig. 3 ). HeLa cells from lab 5 were most dramatically different in terms of growth rate, with a fivefold faster doubling time, and overall morphology, with more than a threefold higher maximal CI ( Fig. 3 ). HeLa from labs 3 and 4 exhibited nearly identical profiles to each other but differed from the other HeLa isolates in showing a reduced CI during the adhesion and stationary phases of the curve ( Fig. 3 ). HeLa cells from labs 1 and 2 were most similar to the ATCC reference but showed statistically significant differences from each other and from ATCC HeLa in the adhesion phase ( Fig. 3 ). In addition, the overall variation of each isolate relative to the ATCC standard was determined by calculating the MAPE (the percentage difference relative to the ATCC mean at each data point is averaged over the entire experiment). The different ATCC replicate wells varied by less than 3%, whereas the other isolates averaged at least a 16% difference from the reference mean, with lab 5 exhibiting the greatest differential ( Fig. 3 ). These results suggest that RTCA profiling can detect significant differences among independent isolates of what is presumed to be a single cell line.
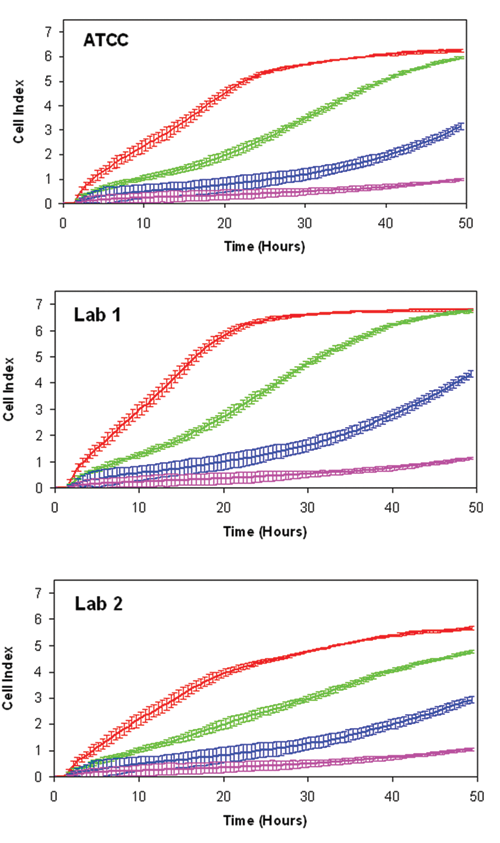
Real-time cellular analysis profiling of A549 cell isolates. A549 cell lines obtained from two different laboratories and from ATCC were profiled as described in Figure 1 .
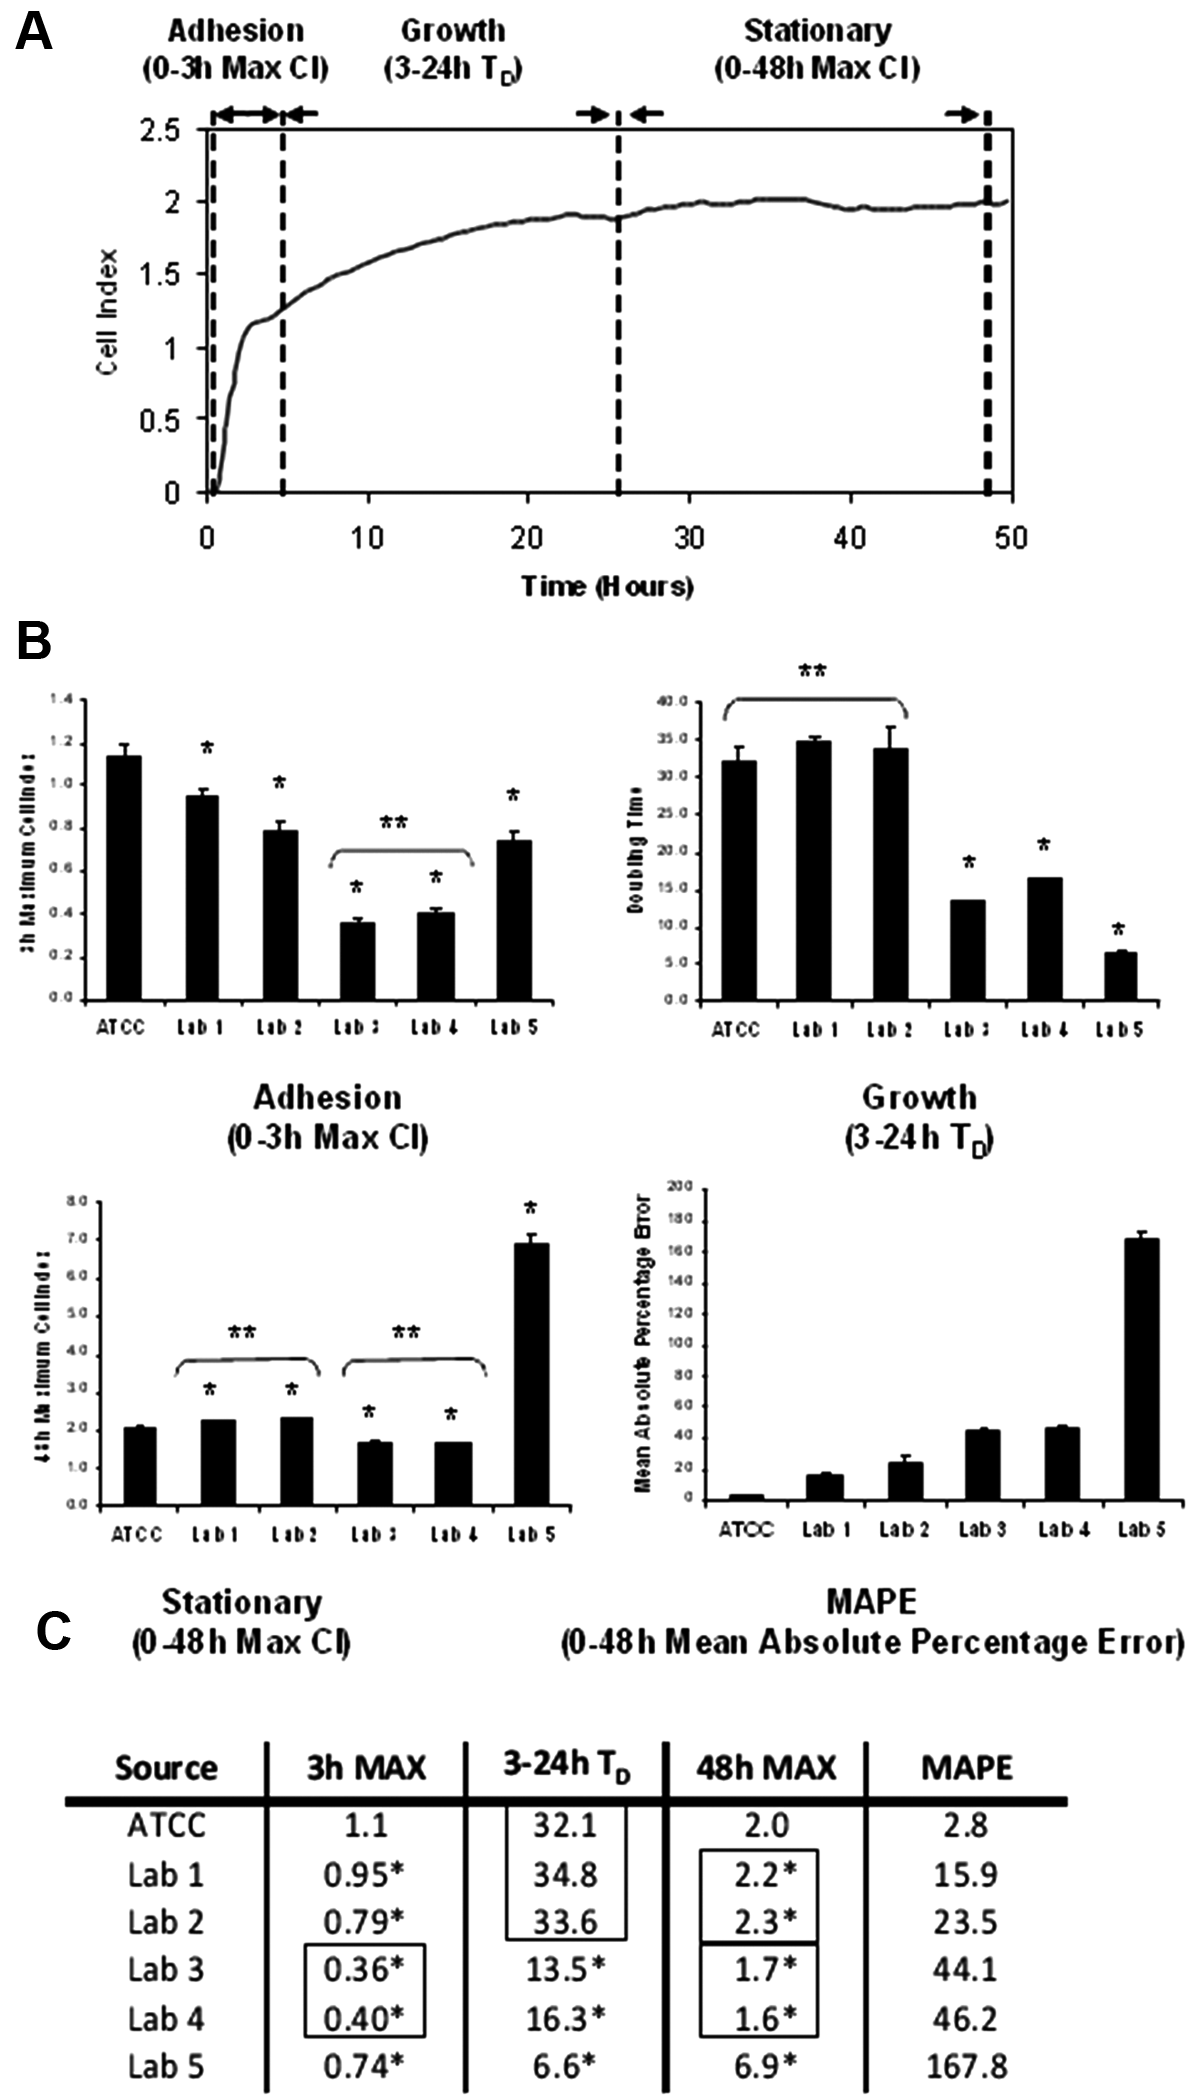
Quantitative assessment of profiles. (
We then tested these cell lines for genetic identity using STR profiling, revealing that HeLa isolates from labs 1 and 2, as well as the reference cell line obtained from ATCC and subsequently cultured in our lab during this study, were indeed pure cultures of normal HeLa cells ( Fig. 4A ). Consistent with this genetic identity, these cells showed the least degree of difference in the RTCA profiles ( Fig. 1B and Fig. 3C ). Surprisingly, the isolate from lab 5 showed an STR profile identical to that of the fibrosarcoma cell line HT-1080 ( Fig. 4A ), presumably due to cross-contamination of these cell lines with subsequent outgrowth of the faster-growing HT1080 cells or possibly an outright cell line switch occurring at some point during passaging prior to this study. This result is consistent with the dramatically different RTCA profile observed for this isolate ( Fig. 1B and Fig. 3C ) and indicates that RTCA profile differences can be indicators of different cell line identities, particularly when compared with a reference impedance profile.
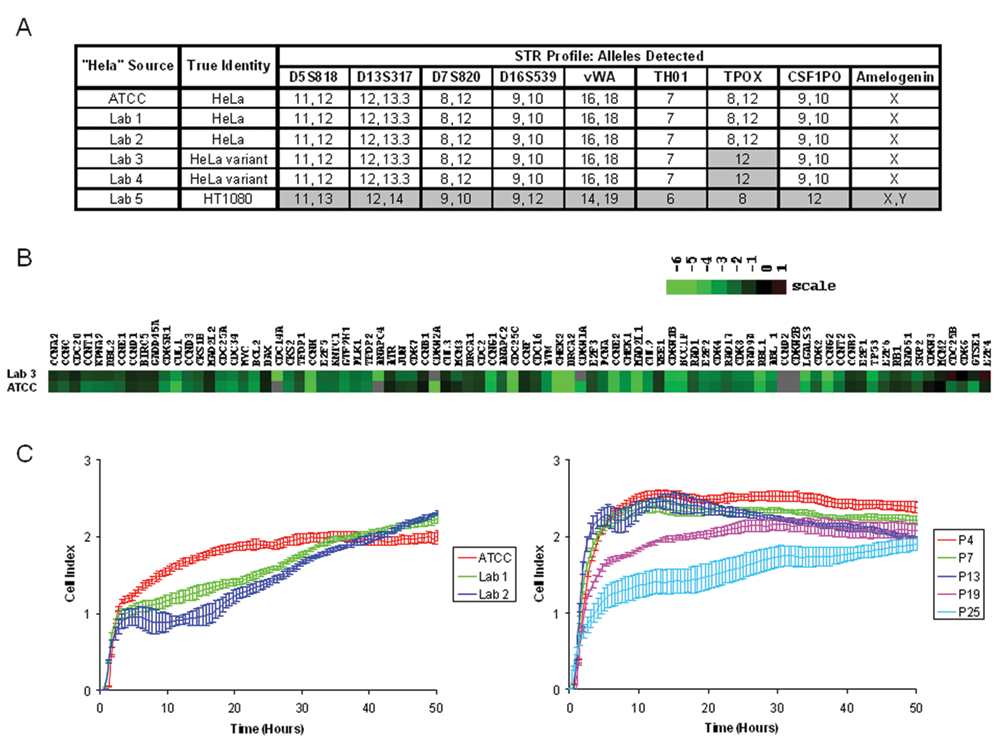
Potential causes of variation in HeLa isolate real-time cellular analysis (RTCA) profiles. (
The isolates from labs 3 and 4 were identified as HeLa cells; however, both lines exhibited the same genetic change, a loss of heterozygosity (LOH) at the thyroid peroxidase allele on chromosome 2 ( Fig. 4A ). Labs 3 and 4 are located adjacent to one another in the same academic institution, suggesting that these labs may have recently shared this HeLa variant. Although these isolates showed nearly identical profiles to each other, they differed significantly from the reference culture ( Fig. 1B and 3C ), suggesting that changes in the RTCA profile may be predictive of genetic changes during culturing of tumor cell lines that exhibit genomic instability. These profile differences are reflected by differences in gene expression of key growth regulatory proteins as assessed by quantitative PCR, including several regulators of either the S phase or the G1/S transition (CDK6, E2F4, and MCM2; Fig. 4B ). These differences in gene expression may be related to the LOH identified by STR profiling; alternatively, independent genetic or nongenetic factors may also play a role in the observed differences in gene expression and RTCA profiles.
Although STR profiling is useful for detecting cell line mix-ups or cross-contamination, as well as spontaneous genetic changes as outlined above, nongenetic factors may also influence cell line health and quality in a significant way. No detectable genetic differences were observed between the ATCC reference line and those from labs 1 and 2, yet the RTCA profiles differed significantly from each other, especially during the adhesion phase of the profile ( Fig. 1 and Fig. 3C ). These differences might be the result of undetected genetic alterations, differences in the number of passages, or in how the cells were maintained in the different source labs prior to this study. We therefore conducted a controlled experiment to assess the effect of passaging on cell growth and morphology characteristics using the impedance readout. HeLa cells obtained from ATCC were expanded by four passages and then maintained using a regular schedule, such that cells were split 1/10 twice weekly by a single scientist using a single batch of prepared media throughout the study. Cultures were tested by RTCA profiling on a periodic basis to monitor potential cell quality changes. The RTCA profiles remained markedly stable over the first 13 passages, after which the profile changed over time such that the initial cell adhesion signal was gradually reduced ( Fig. 4C ). These changes are similar to the differences observed among the three bona fide HeLa isolates, in which the ATCC standard was profiled at passage 15 and the passage numbers for the lab 1 and lab 2 isolates were unverifiable ( Fig. 4C ). These results indicate that cell passaging under normal laboratory conditions can alter the impedance profile and may account for the RTCA differences observed among the genetically indistinguishable HeLa isolates.
Differences in cell growth and morphology arising from any of the sources described above are commonplace and thus are often not of great concern to many researchers; however, differences in cellular responses to the assays used in a research or drug discovery program are of paramount concern. Therefore, we tested whether the differences in cell behavior observed using the impedance readout may be predictive of changes in cellular responses to small molecules. The impedance readout has been used to develop a wide variety of disease-relevant cell-based assays for small-molecule screening, including cytotoxicity assays as well as assays for cellular responses to GPCR activation. 15,17 Therefore, HeLa cells from labs 1 through 3 and from ATCC were assessed for sensitivity to three cytotoxic compounds and three GPCR modulators; in each case, at least one compound showed a significant difference in one or more of the HeLa isolates. The proteasome inhibitor MG132, which induces apoptosis in HeLa cells, caused a dose-dependent decrease in impedance after compound addition with similar potencies and kinetics in ATCC, lab 1 and lab 2 HeLa isolates ( Fig. 5 ). In contrast, lab 3 HeLa, the genetic variant, was much more sensitive to MG132, with a 10-fold increase in potency and an earlier onset of the cell morphology and attachment changes detected by the impedance response ( Fig. 5A ). The altered potency of MG132 in lab 3 HeLa was confirmed by an independent assay: the WST-1 assay for cell viability revealed a shift in the dose-response curve for lab 3 HeLa, relative to the other isolates, similar to the shift observed using the impedance readout ( Fig. 5B ).
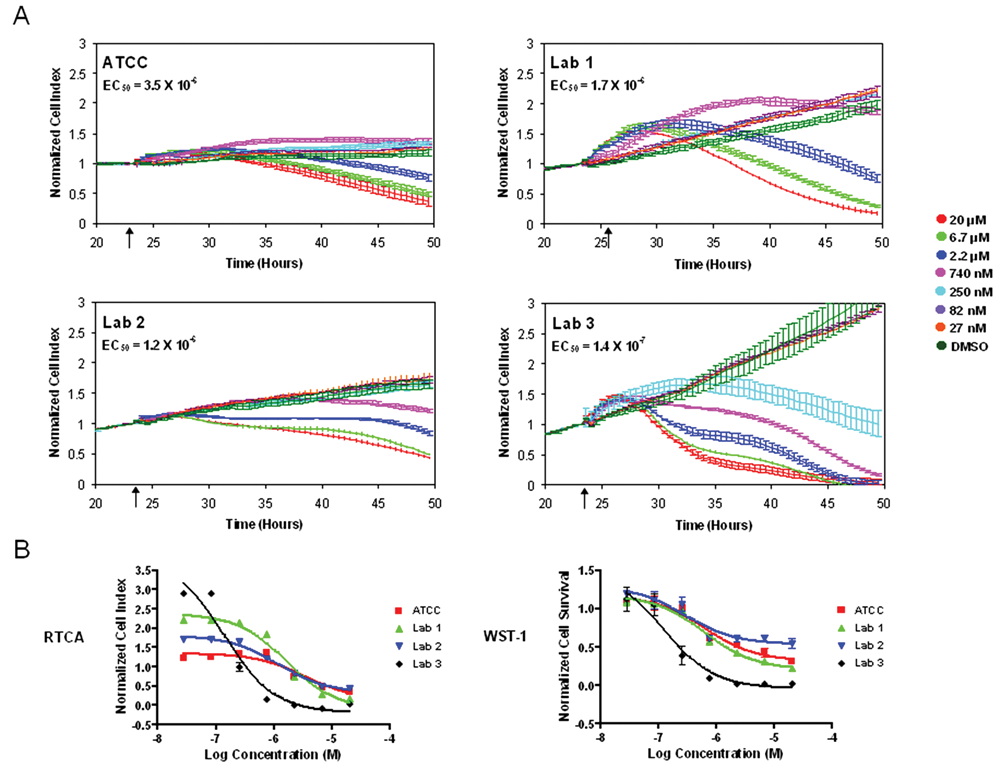
HeLa isolate impedance profile differences can predict functional differences in a cytotoxicity assay. (
In HeLa cells, the GPCR agonist histamine induces a small immediate decrease followed by a rapid increase in impedance characteristic of a Gq-coupled GPCR response. 17 This response occurred with similar kinetics in ATCC and lab 1 HeLa cells and with subtly altered kinetics in lab 3 HeLa ( Fig. 6A ). In contrast, the kinetics and magnitude of the response were both dramatically different in lab 2 HeLa. This isolate showed a greater initial decrease followed by a slower, and less intense, increase in impedance, which resulted in a decrease in apparent potency in the EC50 curve ( Fig. 6A and B ). This difference in cellular response kinetics was confirmed by an independent assay for MAPK phosphorylation induced by histamine receptor activation. The phosphorylation kinetics differed significantly between the two cell lines, with the peak level occurring later in HeLa obtained from lab 2 relative to the ATCC control ( Fig. 6B ). These observations suggest that small differences in the growth and morphological characteristics of cells, as revealed by RTCA profiling, may be predictive of significant differences in functional responsiveness, underlining the need for close monitoring of cell quality and identity during screening campaigns.
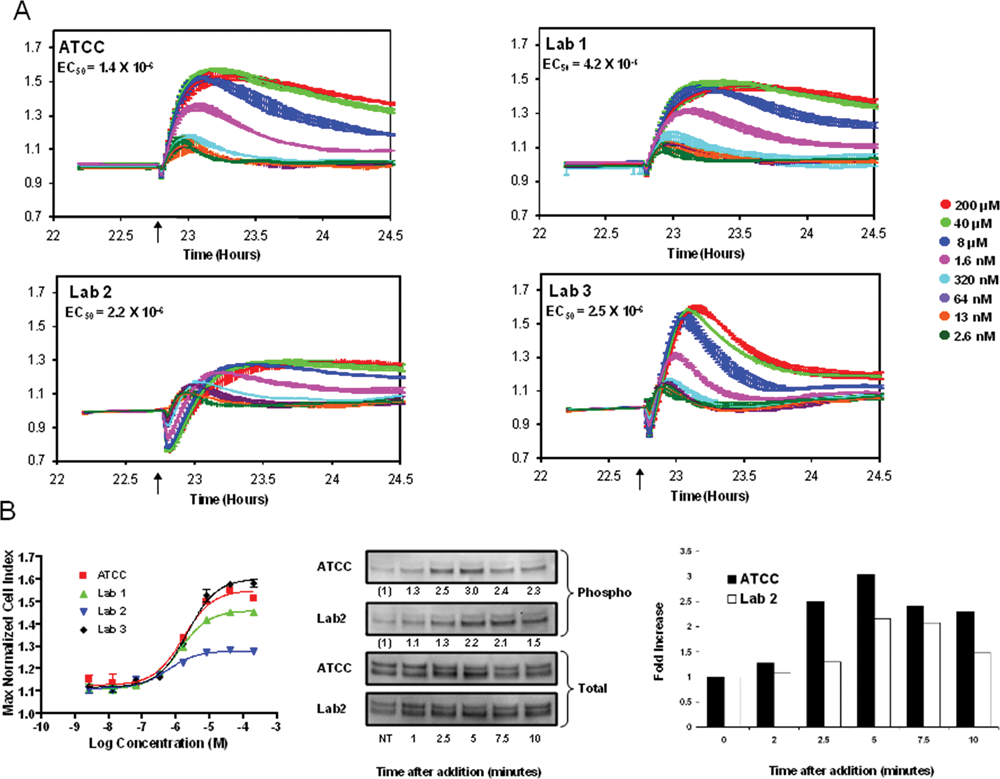
HeLa isolate impedance profile differences can predict functional differences in a G-protein–coupled receptor assay. (
Discussion
Most scientists recognize the importance of using only properly identified, pure, and well-maintained cell cultures to ensure the validity and reproducibility of their results. Ideally, all cell lines intended for critical projects would be obtained from a recognized biological resource center, maintained under the recommended conditions throughout the project, and minimally passaged. In reality, cell lines are routinely passaged extensively and shared by multiple researchers both within and between labs, with scant attention being paid to the ongoing monitoring of cell line quality and identity on a routine basis. This may in part be due to the impracticality of frequent application of traditional tests due to time and cost constraints. RTCA profiling fulfills the need for a routine, rapid, and reliable assay for general cell quality by allowing real-time monitoring of the overall growth and morphological characteristics of any adherent cell line. By simply seeding cells at a few densities, researchers can generate a profile that, when compared with a reference standard, can be indicative of changes in cell behavior or, in some cases, differences in cell identity.
The results of the real-world case study presented here illustrate the pervasiveness of cell quality control issues in both academic and industry research environments; all five of the HeLa isolates obtained from outside labs exhibited quantitative differences relative to the ATCC standard cell line. In the case of the most dramatically different RTCA profile, this was attributable to an outright cell line mix-up (lab 5). In two cases (labs 3 and 4), the difference was attributable to possible genetic drift during propagation of the line before it was shared between the labs. In the other cases (labs 1 and 2), no genetic differences were observed, leaving nongenetic or environmental differences as the likely culprit. In a carefully controlled experiment, quantitative differences in RTCA profile were observed during passaging of the ATCC standard isolate under typical laboratory conditions. These changes were consistent with the differences observed for HeLa isolates from labs 1 and 2. We cannot rule out the possibility that undetected genetic changes in these cells or gradual depletion of a critical factor in the growth media used during the course of the controlled study caused these differences. However, it seems quite likely that time in cell culture and/or passage number could directly alter the behavior of the cell population through nongenetic mechanisms.
The quantitative nature of the RTCA profiling approach for monitoring of cell quality allows the establishment of objective standards for evaluating cell lines on an ongoing basis. Although the profiles shown here were generated over a period of 48 h, it should be noted that, depending on the parameter used, a distinctive and statistically significant profile difference can be observed quite rapidly. For example, the HeLa isolates from labs 3 and 4 exhibited a clear reduction in CI during the first 3 h, as cells adhere to the plate; presumably, these reflect differences in cell size, shape, and attachment quality ( Fig. 3 ). The key finding is that these profile differences can be predictive of different outcomes in cell-based assays; in the case of lab 3 HeLa, a dramatically increased sensitivity to the proteasome inhibitor MG-132 was observed ( Fig. 5 ). In addition, changes in response kinetics and the apparent efficacy of histamine stimulation were observed for several HeLa isolates, especially in HeLa obtained from lab 2 ( Fig. 6 ). It should be noted that although lab 3 HeLa exhibited a genetic alteration that could possibly be linked to the phenotypic differences observed, lab 2 HeLa did not display any differences relative to the ATCC standard aside from the RTCA profile. In that case, the RTCA profile differences consisted of small (but statistically significant) alterations in the cell adhesion and stationary phase parameters ( Fig. 3 ). Thus, the establishment of objective phenotypic parameters for assessment of quality control requires establishment of RTCA profile difference thresholds that may vary somewhat according to cell type and to the intrinsic sensitivity of the biological pathways being interrogated for a particular type of cell-based assay.
Numerous low-cost procedural or preventative measures can be implemented to minimize the impact of cell line quality changes during the course of a screening campaign. Many labs require strict tracking of passage number and strict limitations on how cells are handled, as well as the number of passages allowed before assaying the cells. In addition, generation of large lots of cells for standardization purposes during screening campaigns, often coupled with cryopreservation, may be used for those cell types amenable to such treatment. In this context, label-free technologies such as RTCA profiling may be useful for precise and quantitative assessment of passaging limits, cell-handling protocols, and cryopreservation effects prior to establishment of such procedures. By measuring overall cell growth and morphological characteristics, rather than a specific assay readout, limits established in this manner should be useful across a broad array of assay types.
In addition, periodic phenotypic or genotypic testing is important for initial establishment of cell identity and quality and for minimizing the impact of the occasional human error. We recommend that STR profiling (or a similar method for nonhuman cell lines) should be used to unambiguously authenticate the identity of any newly obtained cell line, except for those obtained directly from a biological resource center. Such profiles may be obtained through commercial services in a matter of weeks for a few hundred dollars per sample. Second, a morphology and growth profile should be generated on the RTCA or a similar label-free system under standardized growth conditions to generate a reference phenotypic profile. This should be conducted at several cell-seeding densities to accommodate the wide range of size, morphology, and growth rates of different cell lines; we have found a range of 1000 to 20 000 cells per well of a 96-well E-Plate to be optimal for profiling most commonly used cell lines. Once generated from an authenticated cell line, the reference profile can be used on an ongoing basis to quickly verify the identity and quality of cells during culturing by comparison of the reference to a newly generated RTCA profile under the standardized conditions. Such testing may be completed in a matter of hours or days, with reagent costs in the tens of dollars per cell line. This procedure would allow for early detection of any of the numerous potential cell line quality problems affecting cell-based research and would thus lead to more reliable and reproducible results both within and between different research labs.
Footnotes
Acknowledgements
We thank the ACEA Biosciences Biology group for helpful discussions, Sharon Soh for reviewing the manuscript, and members of the Sanford-Burnham Medical Research Institute and the Genomics Institute of the Novartis Research Foundation for HeLa and A549 isolates.