
Abstract
Over the past decade, drug discovery programs have started to address the optimization of key ADME properties already at an early stage of the process. Hence, analytical chemists have been confronted with tremendously rising sample numbers and have had to develop methodologies accelerating quantitative liquid chromatography/tandem mass spectrometry (LC/MS/MS). This article focuses on the application of a generic and fully automated LC/MS/MS, named Rapid and Integrated Analysis System (RIAS), as a high-throughput platform for the rapid quantification of drug-like compounds in various in vitro ADME assays. Previous efforts were dedicated to the setup and feasibility study of a workflow-integrated platform combining a modified high-throughput liquid handling LC/MS/MS system controlled by a customized software interface and a customized data-processing and reporting tool. Herein the authors present an extension of this previously developed basic application to a broad set of ADME screening campaigns, covering CYP inhibition, Caco-2, and PAMPA assays. The platform is capable of switching automatically between various ADME assays, performs MS compound optimization if required, and provides a speed of 8 s from sample to sample, independently of the type of ADME assay. Quantification and peak review are adopted to the high-throughput environment and tested against a standard HPLC-ESI technology.
Introduction
A
Regarding the analytical part, software tools for MS compound optimization and data processing 8-10 were developed to facilitate and speed up analytical processes. Although the above-mentioned approaches such as UPLC 1 or new interfaces 6,7 already speed up sample analysis, both the autosampler and LC part are still the rate-limiting factor of LC/MS/MS analysis. Modern triple quadrupole mass spectrometers have scan speeds in the low millisecond range, resulting in the reliable acquisition of narrow peaks with a reasonable number of data points for qualitative and quantitative analysis. Nevertheless, most of the analysis time is spent acquiring noise (e.g., data before and after the peaks of interest have occurred in the mass spectrometer). The RapidFire autosampling technology applied in the Rapid and Integrated Analysis System provides narrow and fast consecutive peaks and, therefore, in combination with a mass spectrometer accentuates the excellence of triple quadrupole mass spectrometry: high sensitivity combined with high selectivity. Many of the above-mentioned approaches provide narrow peaks and analysis times far below 1 minute. 2,5,11 For our applications, a generic high-throughput LC/MS/MS system capable of running different ADME assays and performing compound optimization as well as sample measurement in a highly automated way was desirable. We herein present such a solution: a fully automated and universal in vitro ADME platform termed RIAS (Rapid and Integrated Analysis System) that is easy to use, secure in data handling, and capable of analyzing up to 450 samples per hour. Examples are shown for different types of ADME assays, which are known as standard investigations in early drug metabolism pharmacokinetics (DMPK): cytochrome P450 inhibition (CYP), Caco-2 cell permeability (PRM), and PAMPA (abbr. PMP).
The herein presented RIAS enables quantitative high-throughput mass spectrometry as a secure, easy to use setup for a broad community working in the field of ADME. It may provide new opportunities for quantitative mass spectrometry in fields that either were not accessible until now or have been neglected because of lack of sufficient throughput (e.g., high-throughput screening [HTS] campaigns).
Experimental
Reagents
Acetonitrile (gradient grade) was acquired from Merck (Darmstadt, Germany), methanol (gradient grade) from J. T. Baker (Deventer, Netherlands), and formic acid (p.a.) and trifluoroacetic acid (TFA, reagent grade) from Sigma Aldrich (St. Louis, MO). Ammonium acetate (p.a.) and ammonia solution (25%, p.a.) were purchased from Merck. Water was prepared in-house by a purification system (Elgastat Maxima HPLC, Elga Ltd., High Wycombe Bucks, UK). The CYP450 test compounds benzbromarone, fluoxetine, norfluoxetine, paroxetine, sulfaphenazole, ticlopidine, amodiaquine, 1-hydroxymidazolam, dextromethorphan, dextrorphan, diclofenac, 4-hydroxydiclofenac, 4-hydroxymephenytoin, and erythromycin were purchased from Sigma Aldrich; 13C6-4-hydroxydiclofenac, S-mephenytoin, 2H3-4-hydroxymephenytoin, and 2H6-dehydronifedipine were purchased from Toronto Research Chemicals (Ontario, Canada). 2H3-dextrorphan and 2H5-desethylamodiaquine were obtained from Cerilliant Corporation (Round Rock, TX), ketoconazole was purchased from Tocris Bioscience (Bristol, UK), and midazolam was purchased from Roche Pharma AG (Grenzach-Wyhlen, Germany). The residual 112 proprietary compounds were synthesized in-house at Boehringer Ingelheim Pharma GmbH & Co KG (BI, Biberach, Germany). Overall, the compounds were within a molecular mass range of 250 and 800 Da, and calculated logP values (ACD/labs, version 11; ACD, Inc., Toronto, Canada) were in the range between –2.5 and 7. The RapidFire cartridges were purchased from BioCius (Woburn, MA), the 0.8-mL 96-well plates and the “Easy Peel” sealing mats were obtained from Thermo Scientific (Hamburg, Germany).
Cytochrome P450 assay
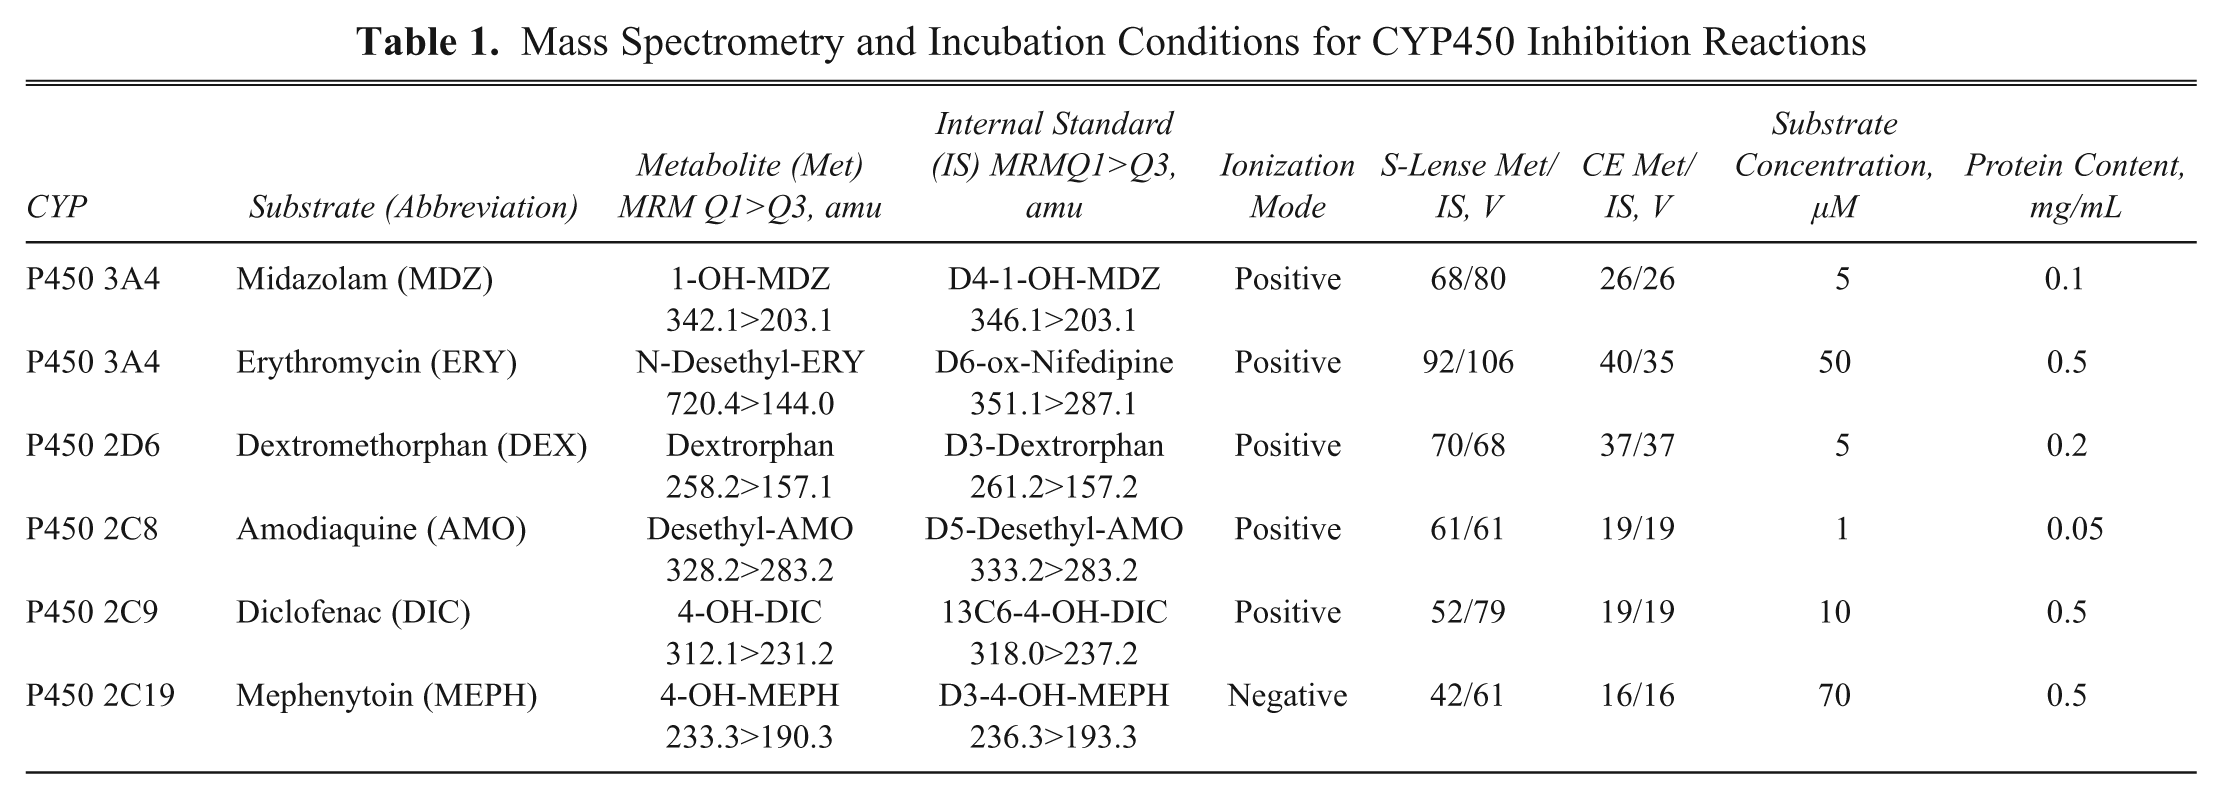
The inhibition of cytochrome P450–catalyzed metabolism of a specific substrate to the respective analyte was assayed at 37 ° C with human liver microsomes. All assays were carried out on a robotic system in 96-well plates. The final incubation contained Tris buffer (0.1 M), MgCl2 (5 mM), cofactor (nicotinamide adenine dinucleotide phosphate [NADPH], 1 mM), human liver microsomes, the specific substrate, and the test compound at a concentration range of 0–50 µM. Reactions were terminated by cooling the incubation down to 8 °C and subsequently by adding one volume of acetonitrile for protein precipitation. An internal standard solution—usually a stably labeled isotope of the substrate product—was added afterwards. The peak areas of the product (P) and of the internal standard (IS) were determined by LC/MS/MS. The resulting peak area ratio of product to internal standard (P:IS) was used to calculate IC50s. The MS and incubation conditions are summarized in Table 1 .
Mass Spectrometry and Incubation Conditions for CYP450 Inhibition Reactions
Caco-2 assay
A 10-µM test compound solution in assay buffer (pH 7.4) was added to the donor compartment of the Caco-2 cell chamber. After predefined intervals (up to 90 min), samples were drawn from the receiver and donor compartment, respectively. For analysis in the RIAS, samples from the donor compartment were diluted 1:50 (v:v), and an aliquot of a proprietary internal standard was added to all samples.
PAMPA assay
The PAMPA assay was performed at pH 5, pH 6.5, and pH 7.4, resembling the environment in different intestinal sections. The donor concentration was very high (target concentration 200 µM, filtration prior to incubation) to also allow analysis of poorly permeable compounds. Samples therefore had to be diluted 1:50 (v:v) with MeOH/water (50:50; v:v) for donor samples and 1:3 (v:v) for samples from the receiver compartment, respectively. The sample preparation and raw data analysis followed the procedure of the above-described Caco-2 assay.
Samples from all assays described were provided in 96-well format and centrifuged prior to analysis in the RIAS for 10 min at 4000 rpm and 4 °C (Multifuge 3SR+, ThermoScientific, Osterode, Germany).
Instrumentation
The original RapidFire system 12 was customized to a fully automated and flexible platform, termed RIAS. In this modified setup, the sample was aspirated by a vacuum pump into a 10-µL sample loop for 250 ms and flushed onto a C4 cartridge (3.8 µL bed volume; BioCius) with the aqueous mobile phase (99.9% water, 0.09% formic acid, and 0.01% TFA; flow rate 1.5 mL/min). A solid-phase extraction step retained the analyte for 3000 ms while interfering matrix (e.g., buffer components) was removed. With a simple step gradient, the analyte was back-eluted from the cartridge for 3000 ms with the organic mobile phase (99.9% acetonitrile/methanol [1:1, v:v], 0.09% formic acid, and 0.01% TFA) and flushed into the mass spectrometer at a flow rate of 1.25 mL/min. Afterwards, the cartridge was reequilibrated with the aqueous mobile phase for 500 ms (flow rate 1.5 mL/min). A detailed description of the hardware setup was provided previously. 13,14 The RapidFire and a customized control software were obtained from BioCius. QuickQuan 2.3, Xcalibur 2.0.7, and XDK 2.1.0.25 were used to operate the TSQ Vantage (ThermoFisher, San Jose, CA). Mass spectral data-processing software QuickCalc 7.1.9 was purchased from ThermoFisher. The Master software for the RIAS was programmed in-house using LabVIEW (version 8.6.1; National Instruments, Austin, TX). Data analysis was performed in AssayExplorer 3.2 (Symyx, Sunnyvale, CA), and correlation plots were visualized in Spotfire version 2.2.0 (TIBCO, Palo Alto, CA).
Results And Discussion
The RIAS has been established previously to automatically perform fast and robust LC/MS/MS analysis of metabolic stability samples. 13,14 In this contribution, we extend and demonstrate the applicability of the automated system to further key ADME assays such as Caco-2, PAMPA, and CYP, including assay type recognition and MS compound optimization.
System setup development
The central turntable for operations of the RIAS constitutes the in-house programmed LabVIEW software ( Fig. 1 ). Both the modified RapidFire and the triple quadrupole mass spectrometer are controlled according to handshake principles. Thus, operations of the RIAS are timed and triggered via the LabVIEW software. In most of the ADME assays, the research compound itself has to be quantified, which adds a level of complexity to the entire process. The customized RapidFire and the mass spectrometer can be set to compound optimization (tuning) or analysis mode measurement sequences submitted via software commands. Key for an automated analytical workflow and high level of automation of the system is the barcode-mediated differentiation into different types of plates, depending on the purpose (sample or tuning) and the assay type (CYP, Caco-2, PAMPA, metabolic stability). This was realized by the implementation of naming rules, which resulted in “speaking” acronyms in the plate barcode. A distinction between plates by the system is mandatory for the use of predefined injection series depending on purpose and assay type. In addition, this guarantees an unattended operation over many plates from different assays for both tuning and sample measurement. In summary, the automated differentiation of assay formats (CYP, PRM, PMP, metabolic stability [MST]) as well as of sample types (tuning, sample) was achieved via barcode-labeled plates triggering specific actions within the system (“active barcoding”).
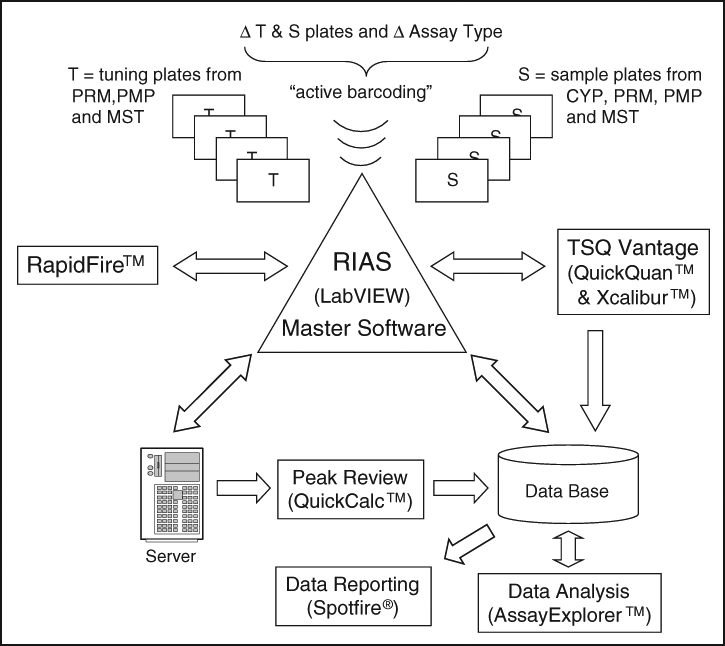
Schematic data flow of the high-throughput RIAS (Rapid and Integrated Analysis System): the RIAS master software represents the central turntable of the entire system. The software controls the interplay between the RapidFire injection module and the Thermo TSQ Vantage MS. Based on the barcode label of the plates, the software recognizes plate type (tuning or sample) as well as assay type (cytochrome P450 inhibition [CYP], Caco-2 cell permeability [PRM], parallel artificial membrane permeability [PMP], metabolic stability [MST]) and retrieves plate layout information, such as compound name, molecular formula, and selected internal standard. All of these steps trigger experiment-specific actions. The demonstrated data flow minimizes generation of large amounts of files by usage of databases.
An important task of the operating system is to distinguish whether a compound optimization is necessary for a specific assay. In this regard, samples from the CYP450 inhibition assay require the measurement of product analytes generated by metabolism of specific substrates. Because the formed product analytes are known and monitored independently of the research compounds, MS measurement parameters and methods have been established and stored in QuickQuan’s database to be instantly retrieved if necessary ( Table 1 ). In contrast, all other above-mentioned assays (PRM, PMP, and MST) require the direct measurement and quantification of the investigated compounds themselves and require, therefore, compound optimization by means of tuning plates. Hence, when a compound has been optimized, future analytics of this compound does not require a new optimization process. If a compound under investigation has already been tuned before, the RIAS will skip the tuning procedure. In case the RIAS contains loaded samples of compounds without tuning information in the database, the system will skip the processing and save these samples until the tuning plate of these compounds has been processed. Compound optimization with the RIAS was performed with pure compound solutions (concentration 1 µM) using the RapidFire setup with subtle differences regarding elution flow rate and valve switching times. Hence, time for the solid-phase extraction step from the RapidFire system was reduced from 3000 to 1000 ms. Next, the elution flow rate of the compound into the mass spectrometer was reduced to 0.3 mL/min to achieve a persistent signal for the MS optimization procedure. Timing of injections was triggered from the LabVIEW software upon request from the QuickQuan software. During the compound optimization process, basic mass spectrometric parameters such as ionization polarity (positive or negative), S-lense, and CE-voltage as well as the multiple reaction monitoring (MRM) transition were automatically determined and stored in the QuickQuan database. The optimization process was performed at pH 7.4 to facilitate compound tuning for both positive and negative ionization mode. The aqueous phase for sample loading onto the C4 cartridge was 10 mM ammonium acetate in water, and the organic solvent for the back elution into the mass spectrometer was 95% acetonitrile/methanol (1:1, v:v) with 5% 10 mM ammonium acetate at pH 7.4. The success rate of the automated compound optimization procedure with the RIAS was determined retrospectively for 331 different compounds over several months and was found to be 98% (successful optimizations within 1.5 min/compound). All protocols from automated or manual optimization were routinely reviewed to check S-lense and CE-voltage ramps as well as survey scans and MS product ion spectra provided in the MS software optimization protocols. If the automated compound optimization procedure failed, conventional off-line infusion (flow rate 10 µL/min) of a 1-µM compound solution was performed using Xcalibur’s internal tuning software. Hence, by the implementation of “active barcoding,” the RIAS is able to automatically perform plate differentiation and triggers operations of the system without manual interaction.
The starting point of the analytical workflow of the revised RIAS (cf. Fig. 1 ) is the barcode reading of a plate by a scanner located next to the plate-handling device. Scanning the barcode enables access to a specific plate identification file, which is provided on a server and contains plate specific analytical information (e.g., compound name, molecular formula, unique identifier, and internal standard). After MS optimization of analytes, the compound-specific information is stored in QuickQuan’s database and can be instantly retrieved if necessary during sample analysis by providing specific MRM conditions. LabVIEW software triggers the acquisition mode in the QuickQuan software and initiates both MS method generation and submission of sequences for the analysis in the RIAS. Data acquisition is performed in high-throughput (HT) mode with all samples from an assay series included in a single file 5,11,14 to reduce the number of data files. The cycle time between injections of analytes is 8 s, regardless if samples originate from an MST assay, a CYP450 inhibition assay, or a permeability assay (PMP or PRM). After data acquisition, MS raw data are moved to a network server for a quick peak review in the HT mode ( Fig. 2 ). Processed data are stored in a database via QuickCalc and can be retrieved during data analysis for automated calculation of ADME parameters such as IC50, half-life (t1/2), or permeability coefficients (PAPP).
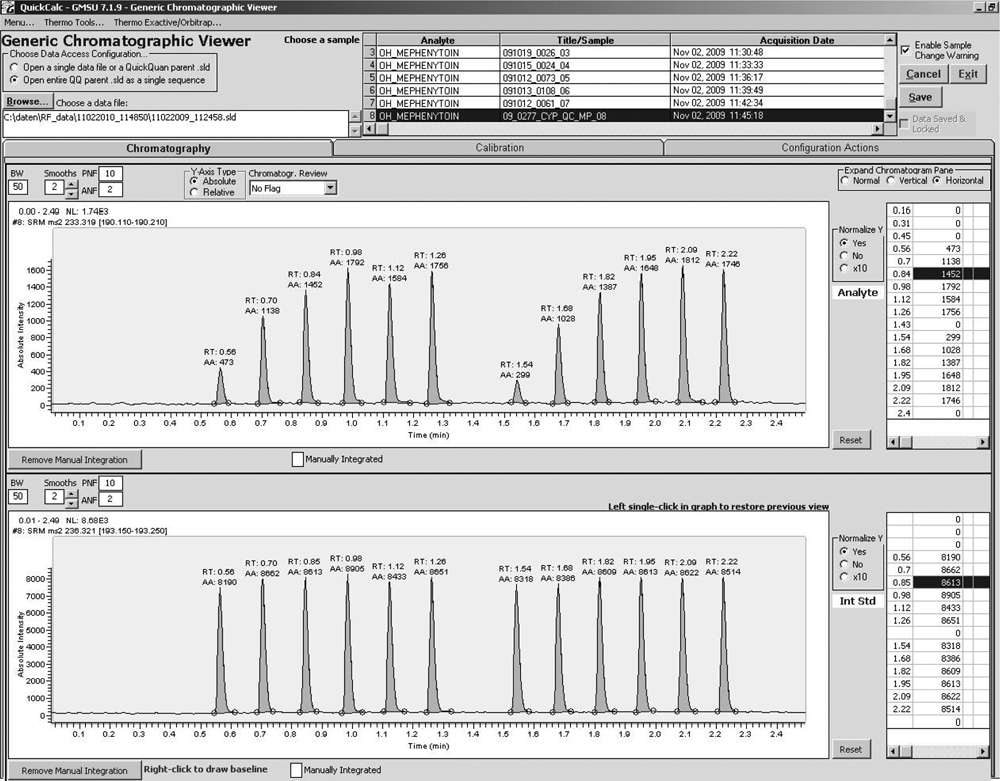
Simplified data processing in high-throughput (HT) mode: the application of HT data acquisition and data processing simplifies and shortens the peak review as depicted from an example of a CYP450 inhibition experiment analysis. The inhibition of the formation of 4-OH-mephenytoin (upper MRM transition) from mephenytoin in human liver microsomes in the presence of an inhibitor is displayed. Each peak represents a single-point incubation with increasing amounts of a potential inhibitor followed by a blank and the subsequent duplicate incubations. Inhibition of formation of the known metabolite leads to a reduced peak signal for 4-OH-mephenytoin and enables a compound-specific IC50 calculation for the isoenzyme. The MRM transition on the bottom depicts the stable labeled internal standard (2H3-4-OH-mephenytoin), which was added after quenching the microsomal incubation. In this application, the HT data review enables a quick peak review and integration check of 17 injections stored into one chromatogram.
ADME assay use cases for the assessment of the RIAS performance
CYP450 inhibition (CYP)
As depicted in Figure 2 , all samples of one inhibition experiment (16 samples, including blank and matrix injections) were analyzed within a run of 2.5 min. The individual samples were injected in the order of decreasing test compound concentrations (presumably leading to increasing analyte concentration, if inhibition of the substrate reaction was concentration dependent) followed by a blank and the duplicate incubation samples. The upper panel represents the analyte MRM trace, whereas the lower panel shows the MRM trace of the stably labeled internal standard. An inhibition potential of a test compound can already be estimated during peak review on the screen.
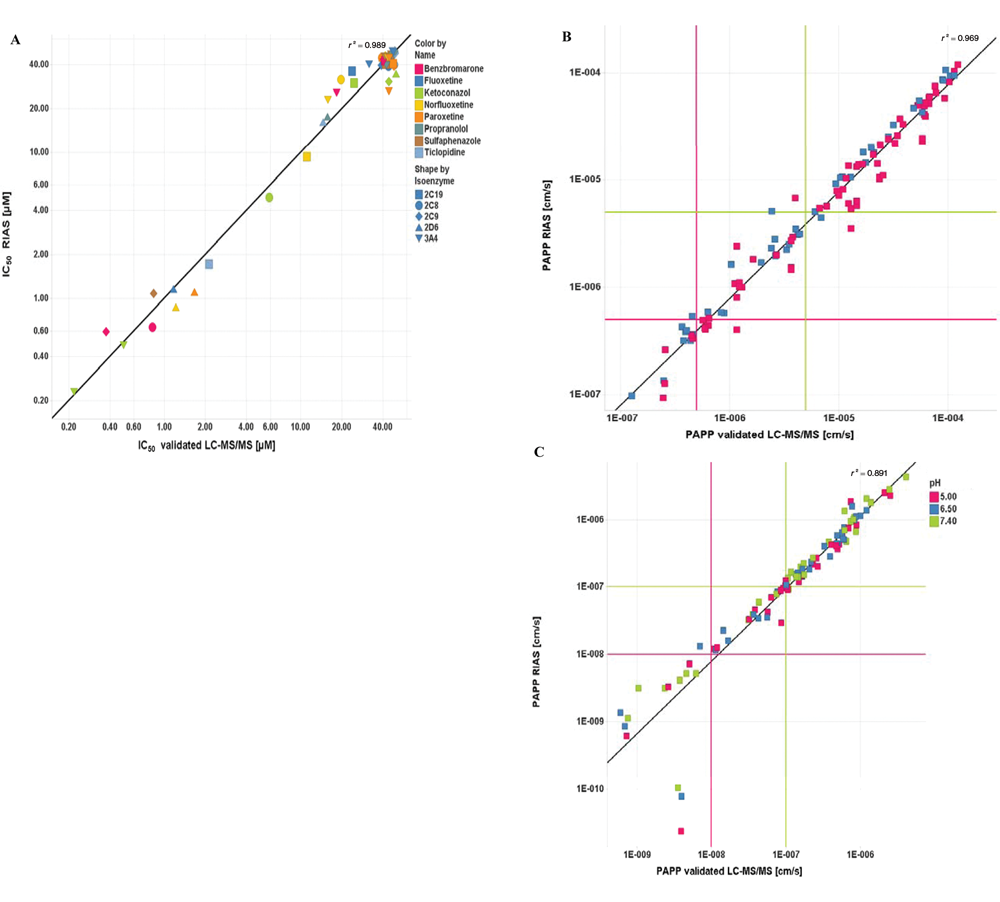
Samples from CYP inhibition experiments were analyzed on a validated LC/MS/MS setup as well as with the RIAS. Eight representative drugs (benzbromarone, fluoxetine, ketoconazole, norfluoxetine, paroxetine, propranolole, sulfaphenazole, ticlopidine) were each tested toward six different P450 substrate reactions with midazolam, erythromycin, dextromethorphan, amodiaquine, diclofenac, and mephenytoin, yielding 48 cross-validation IC50 results ( Fig. 3A ). The double-logarithmic cross-validation diagram displays IC50 values over the entire concentration range, including compounds with no or tolerable DDI (IC50 > 10 µM) and compounds with high DDI (IC50 < 1 µM). The correlation of quantitative data is excellent over the depicted concentration range (correlation coefficient r 2 = 0.989).
(
Caco-2—permeability (PRM)
Samples from the daily laboratory routine that were already analyzed with the conventional MS system were selected for a reanalysis with the RIAS. Figure 3B depicts the double-logarithmic diagram displaying an excellent correlation of permeability coefficients (PAPP, 15 r 2 = 0.969) of samples from 110 Caco-2 experiments with different BI proprietary compounds measured on both systems. In the RIAS, MS compound optimization was automatically performed for all compounds. The time required for sample analysis was 8 s from sample to sample compared to 1 min per sample with the validated LC/MS/MS system. The Caco-2 assay differentiates poorly permeable compounds (PAPP <5 × 10⁻⁷ cm/s; red line in Fig. 3B ) as well as highly permeable compounds (PAPP >5 × 10⁻⁶ cm/s; green line in Fig. 3B ). Compounds with permeability coefficients >5 × 10⁻⁷ cm/s but <5 × 10⁻⁶ cm/s are considered medium permeable in the Caco-2 assay. The blue squares indicate samples measured the same day, whereas the red squares indicate samples measured on the RIAS after (a timely delay and) one additional freeze-thaw cycle.
PAMPA—parallel artificial membrane permeation assay (PMP)
A high correlation of RIAS–electrospray ionization (ESI)–MS to HPLC-ESI-MS could also be demonstrated for the PAMPA assay. Figure 3C depicts a high correlation (r 2 = 0.891) of PAPP 15 between these systems. Again, fully automated MS compound optimization on the RIAS was successful. BI proprietary compounds were investigated in 35 different experiments at pH 5 (red squares), pH 6.5 (blue squares), and pH 7.4 (green squares). Most of the compounds showed high permeability in the assay (PAPP >1 × 10⁻⁷ cm/s; green line in Fig. 3C ), some medium permeability (>1 × 10⁻⁸ but <1 × 10⁻⁷ cm/s), and a few low permeability (<1 × 10⁻⁸ cm/s; red line in Fig. 3C ). The RIAS samples have been measured with a more sensitive triple quadrupole mass spectrometer compared to the validated system. A higher variability observed for low-permeable compounds (<1 × 10⁻⁸ cm/s) was usually correlated to a lower limit of quantitation (LLOQ). Cycle time from sample to sample was 8 s compared to 1 min with the validated approach.
The RIAS is a universal analytical high-throughput platform for in vitro ADME key assays, easy to use, and secure in data handling. Providing a high level of automation and a speed of 8 s per sample, it enables the analyst to run up to 450 samples per hour from various ADME assays such as CYP450 inhibition, Caco-2, PAMPA, or MST 13,14 in real-life applications. Time-consuming and tedious switching between compound optimization and sample measurement from various assays as well as data management in daily LC/MS/MS work was completely handled by the new unified platform without manual intervention. The setup of the RIAS for CYP450 inhibition enabled us to replace a laborious and cost-intensive radiometric inhibition assay, resulting in substantial savings with respect to time and money. The concept of “active barcoding” was introduced to our knowledge for the first time to LC/MS/MS analysis. Conventional barcode applications use the barcode to generate a raw data acquisition file name from a plate identifier. In our case, this step is only one aspect of the entire active barcoding principle. Barcode reading is also linked to different kinds of system actions/procedures such as recognition of assay type, loading of injection templates, differentiation between sample and tuning plates, and initiation of both compound optimization and sample measurement. Only the complete integration enables an unattended operation of the RIAS and provides a general applicability to various types of assays with different setups in a high-throughput environment. The system is controlled via a central master software and has been integrated into the workflow not only with the purpose to speed up but also to pass interfaces smoothly, to avoid copy/paste transactions, and to allow the usage of databases as data exchange and transfer turntables. In our view, this is the first report on a system that covers and unifies the analysis of samples from very different types of ADME assays at such an advanced level of automation and speed. We currently have limited the application of the entire system to in vitro ADME. However, our current efforts are directed to an extension toward the analysis of pharmacokinetic and toxicokinetic in vivo samples. 14
We are aware that the RIAS represents an in-house customized solution of commercially available components from different vendors. This customization, however, is in accordance with some basic but mandatory rules that can be transferred to any other platform. First, it is important to integrate the system into a well-designed workflow philosophy where copy/paste actions of data information should be avoided and active barcoding should be established. Furthermore, it is necessary to set up communication interfaces between single-system components (i.e., mass spectrometer and autosampler). Finally, for this kind of system, an automated MS compound optimization routine is required that enables automated storage and access of tuning information in and from a database.
Footnotes
Acknowledgements
The authors thank Dr. Bernhard Schmid for providing his expertise into the permeability assays, Dr. Daniel Bischoff and Dr. Achim Sauer for reviewing the contribution, and Dr. Klaus Klinder and Dr. Kurt Schumacher for supporting the project.