
Abstract
Lipophilicity is an important parameter for any potential drug candidate. Accurate and efficient lipophilicity measurements facilitate the development of high-quality predictive in silico models that support the design of future drugs. Lipophilicity estimates derived from the traditional 1-octanol/water shake flask techniques have been the most widely employed and are therefore the best understood. This technique can be considered to give a good measure of a compound’s lipophilicity, albeit slower and more labor intensive to run compared with some other methodologies. Herein is described and validated an efficient 1-octanol/water shake flask technique that has sufficient capacity to be run as a primary screen within the drug discovery process. This is achieved by the simultaneous measurement of the distribution coefficients of mixtures of up to 10 compounds using high-performance liquid chromatography and tandem mass spectrometry. Concerns regarding ion pair partitioning that could result in erroneous results due to interactions between compounds within a mixture are discussed.
Introduction
I
It was recently argued that the accuracy of in silico lipophilicity predictions that are widely available from globally trained algorithms is unacceptably poor, with an average error in excess of 1 log unit. 3 It was further argued that such inaccuracy can mislead the design of new analogues and that available experimental lipophilicity data from a particular chemical series can be used to develop high-quality local models that dramatically improve predictivity. This reflects our own experience and is an important driver for the development of accurate and efficient experimental methods.
The traditional shake flask method is considered the gold-standard technique for determining log D 7.4, but the associated steps are not compatible with high sample throughput. 4 To aid the lead optimization process of drug discovery, an efficient shake flask log D 7.4 primary screen was needed that had the ability to cope with every potential drug-like compound synthesized, as solid samples, within all lead optimization projects. The maximum demand on this screen was estimated to be in the region of 200 measurements per week.
The shake flask method has been miniaturized and automated by transferring it to a 96-well microplate format, with direct sampling of the two phases prior to the use of liquid chromatography (LC) and selected ion recording (SIR) mass spectrometry (MS) quantification. 5 A similar technique, which makes use of a water plug aspiration and injection method, has also been described. 6 The determination of log D 7.4 of 96 compounds using these types of methods requires lengthy analysis times. Large concentration differences between the 1-octanol and aqueous phases can also lead to problems with nonlinearity of detector output over such a wide range of response. 5 Other experimental measures of lipophilicity have been described, including methods such as chromatographic retention time measurement, 7 pH-metric, 8 microfluidic liquid-liquid extractions, 9 immobilized artificial membrane affinity, 10 and micellar emulsion electrokinetic chromatography. 11 The merits and disadvantages of the shake flask experiment and some of these alternatives have been recently reviewed, and the shake flask derived data are still viewed as the gold standard in terms of quality but with significant drawbacks in terms of sample throughput capacity. 12
The method that has been developed is a miniaturized and automated shake flask log D 7.4 technique that uses LC/MS analysis. The number of samples that need to be prepared and analyzed is reduced by pooling compounds into mixtures of up to 10. The use of mixtures of compounds in LC/MS-based pharmacokinetic assays has been fairly widely used without significant detrimental effects. 13–15 However, the use of mixtures of compounds in phase equilibrium experiments between 1-octanol and water has not been previously reported and is only possible if ion pairing interactions between the compounds do not lead to significant changes in the observed values of log D 7.4. Performing studies at low compound concentration can mitigate this effect but requires highly sensitive and selective LC/MS detection.
Materials And Methods
Materials
Columns for LC were obtained from Waters Ltd. (Elstree, Hertfordshire, UK). 1-Octanol was obtained from Sigma Aldrich (St. Louis, MO), and all other consumables where obtained from Thermo Fisher Scientific (Loughborough, UK). The pH 7.4, 0.02 M, phosphate buffer was prepared by dissolving NaH2PO4.2H2O (0.62 g) and Na2HPO4.2H2O (2.85 g) in water (1000 mL). The 1-octanol and pH 7.4, 0.02 M, phosphate buffer were shaken together for 18 h and the phases allowed to separate prior to use.
Instrumentation and analysis
Pre- and postdata handling procedures were carried out using custom-built Microsoft Excel workbook add-ins. Automated liquid sample handling was performed using a Tecan Freedon Evo 150 (Tecan, Männedorf, Switzerland) robot fitted with an eight-disposable tips configuration and controlled by EVOware software (Tecan). The use of disposable tips eliminated contamination issues relating to sample carryover. Centrifugations were carried out using a Beckmann Allegra R6 (Beckmann Coulter, Palo Alto, CA). Shaking of samples was carried out using an IKA KS 260 (IKA, Wilmington, NC) orbital shaker set at 450 rpm. Experiments were carried out in a constant-temperature laboratory held at 20 °C. All LC analyses were carried out using a Waters 2690 separations module and Waters 2777 autosampler fitted with a Peltier cooler set to 20 °C. A Waters 996 diode array detector was used for UV peak confirmation. MS detection was carried out using a Waters Quattro Premier XE atmospheric pressure tandem quadrupole mass spectrometer (Premier-MS) operating in the multiple-reaction monitoring (MRM) mode. 16 The Premier-MS was controlled using MassLynx software (Waters; refer to operating guides available from Waters Ltd. at www.waters.com). Waters QuanOptimise application manager was used to automatically generate MRM methods for compounds. Waters QuanLynx software was used to automatically process all the MRM chromatograms. Waters Symmetry C8 3.5 µm, 4.6 × 50-mm columns were used for LC along with a gradient of 1% acetonitrile/99% 0.1% aqueous formic acid to 99% acetonitrile/1% 0.1% aqueous formic acid at a flow rate of 2 mL min−1 over 5.0 min. All pH measurements were conducted using a Fisher Scientific AR20 pH/Conductivity meter (Thermo Fisher Scientific). A Milli-Q water purification system (Millipore, Billerica, MA) was used to supply water.
General procedure for log D 7.4 measurements
Compounds (1 mg) were dispensed into individual 1-mL polypropylene vials, held within a 96-well plate along with 1-octanol (700 µL), and presaturated with 0.02 M phosphate buffer (pH 7.4). The plate was then shaken overnight followed by centrifugation (800 g for 15 min) to sediment any undissolved solids. Up to 24 mixtures of 10 compounds (or less) were then prepared by pooling the 1-octanol solutions (100 µL) into a plate of 12-mL glass sample tubes. The pooling of solutions was performed using a bespoke algorithm, such that none of the compounds in each mixture had a mono-isotopic mass within 2 Daltons of each other, allowing facile resolution of the components of the mixture during the MS quantification. The pooling of compounds was performed robotically and controlled using automatically generated bespoke work lists. If a mixture contained less than 10 compounds, then 1-octanol (presaturated with 0.02 M phosphate buffer [pH 7.4]) was added to make up the total volume of the 1-octanol phase to 1 mL. 1-Octanol-saturated phosphate buffer (0.02 M, pH 7.4, 2 mL) was then added to each mixture before shaking (450 rpm for 30 min) and centrifugation (800 g for 15 min). The final 1-octanol and aqueous phases of each partition mixture were then robotically separated. The first step was to take an aliquot of the 1-octanol phase (20 µL) for LC analysis using a 1- octanol liquid class. The second step was to remove the excess 1-octanol phase to expose the aqueous phase. This was performed by repeat aspirations of the 1-octanol from various positions within the sample tubes. The final step in the separation was to take an aliquot of the aqueous phase (50 µL). The 1-octanol and aqueous aliquots were serially diluted using DMSO to give the final samples for LC/MS analysis. Five sequential dilutions were made of each final 1-octanol phase, covering a 10 000-fold range in concentration. The MS peak areas from these solutions were used to generate a log(peak area) against log(relative concentration) calibration line. Three sequential dilutions of each final aqueous phase covering a 100-fold concentration range were also prepared, and an LC/MS peak area was selected from one of these three dilutions that best fitted within the range of the calibration line, allowing interpolation of the relative concentration. To minimize the extent of carryover, the order of LC/MS analysis began with the least concentrated dilution of the 1-octanol followed by subsequent more concentrated dilutions, followed by two blank injections and then the dilutions of the aqueous phase in increasing concentration. Log D 7.4 was calculated from the ratio of one of the 1-octanol relative concentrations to the interpolated aqueous relative concentration after correcting for the extent of dilution of both the 1-octanol and aqueous solutions.
Results
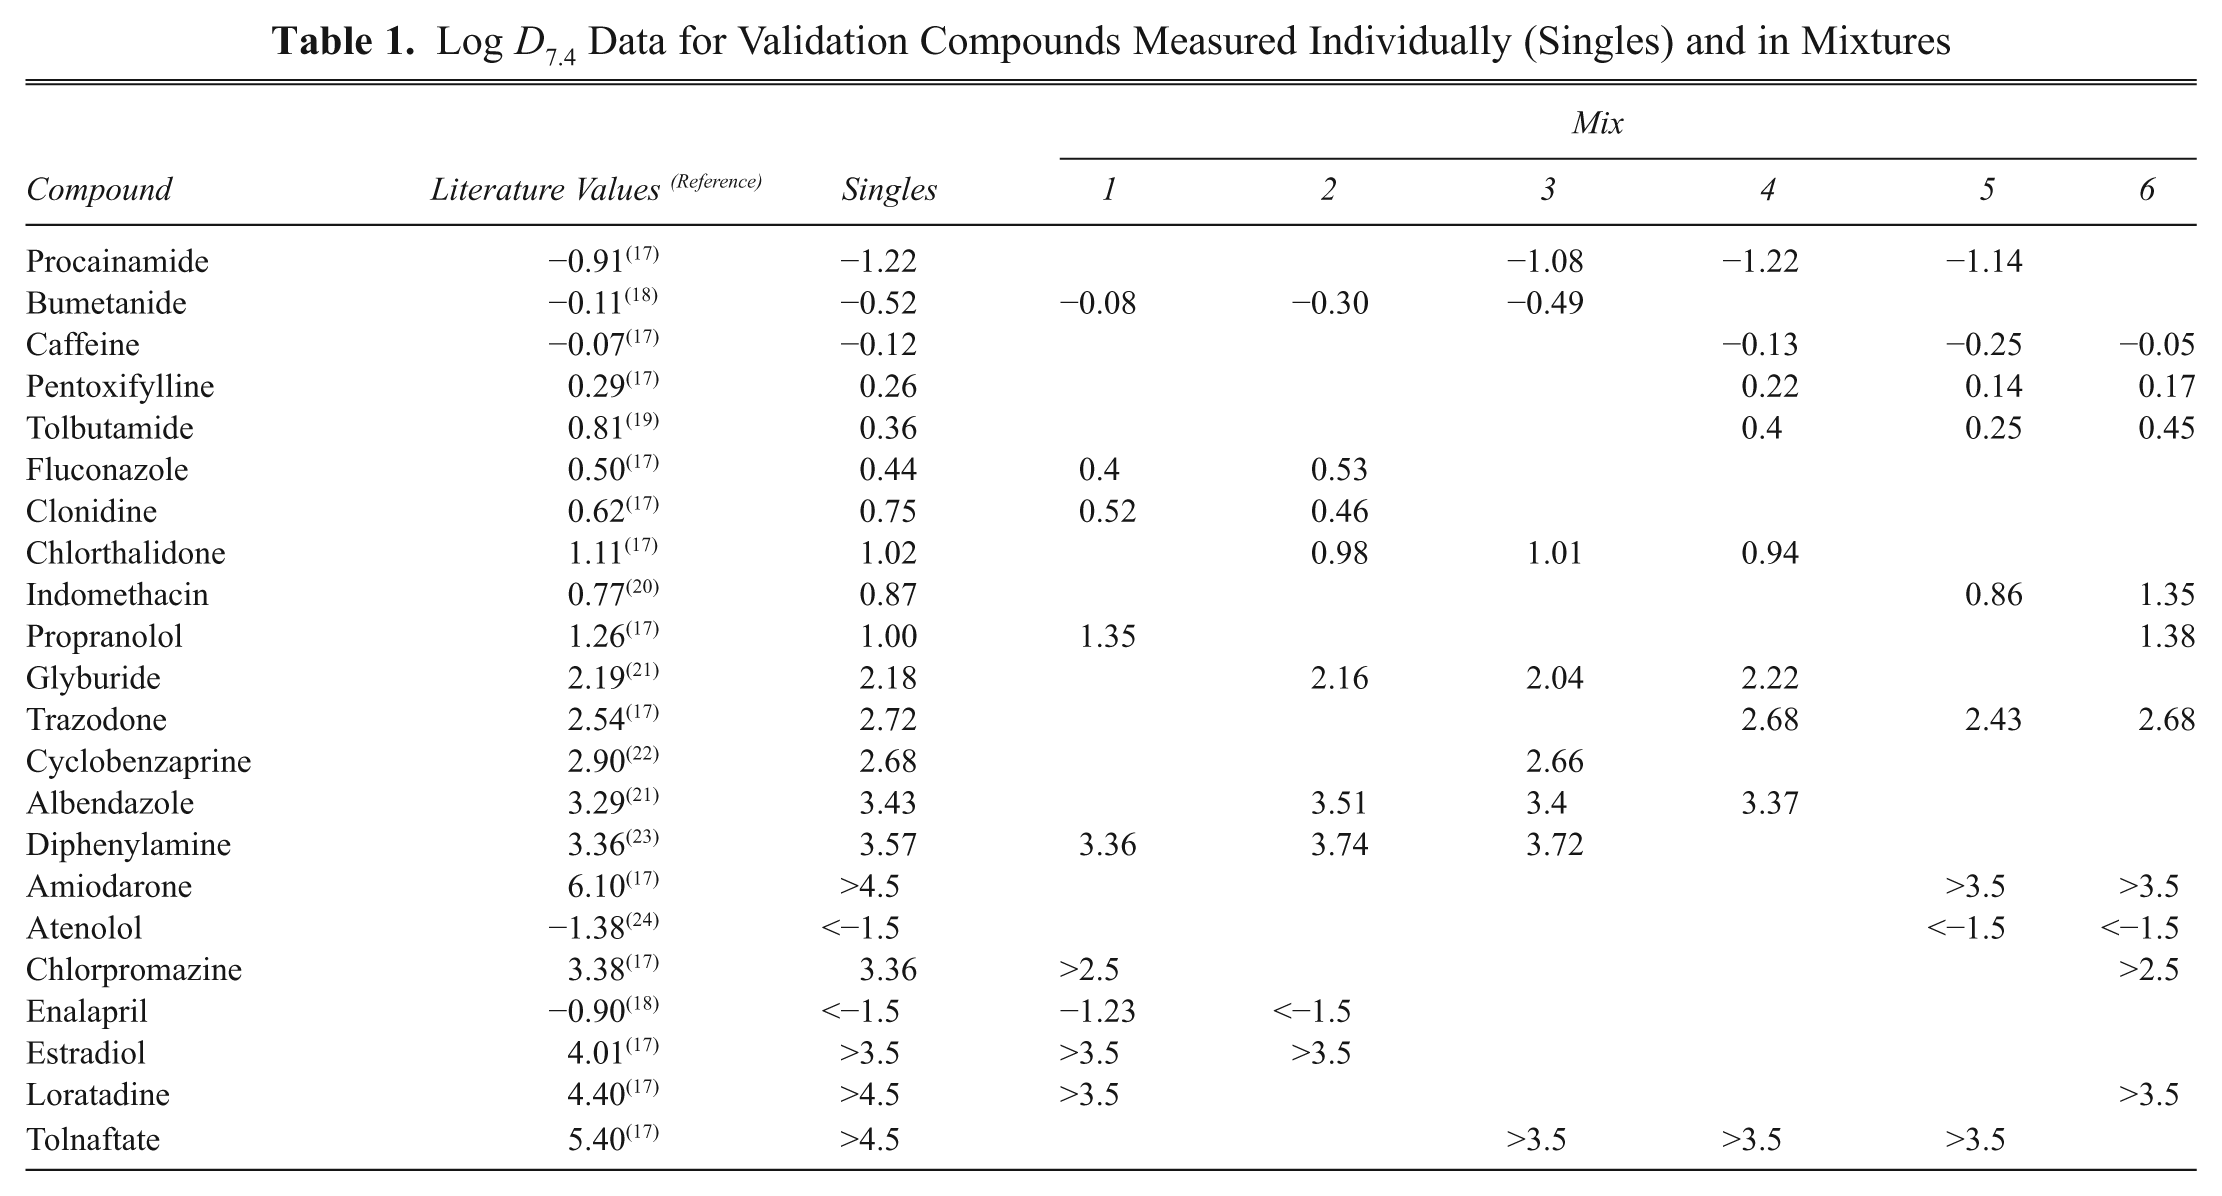
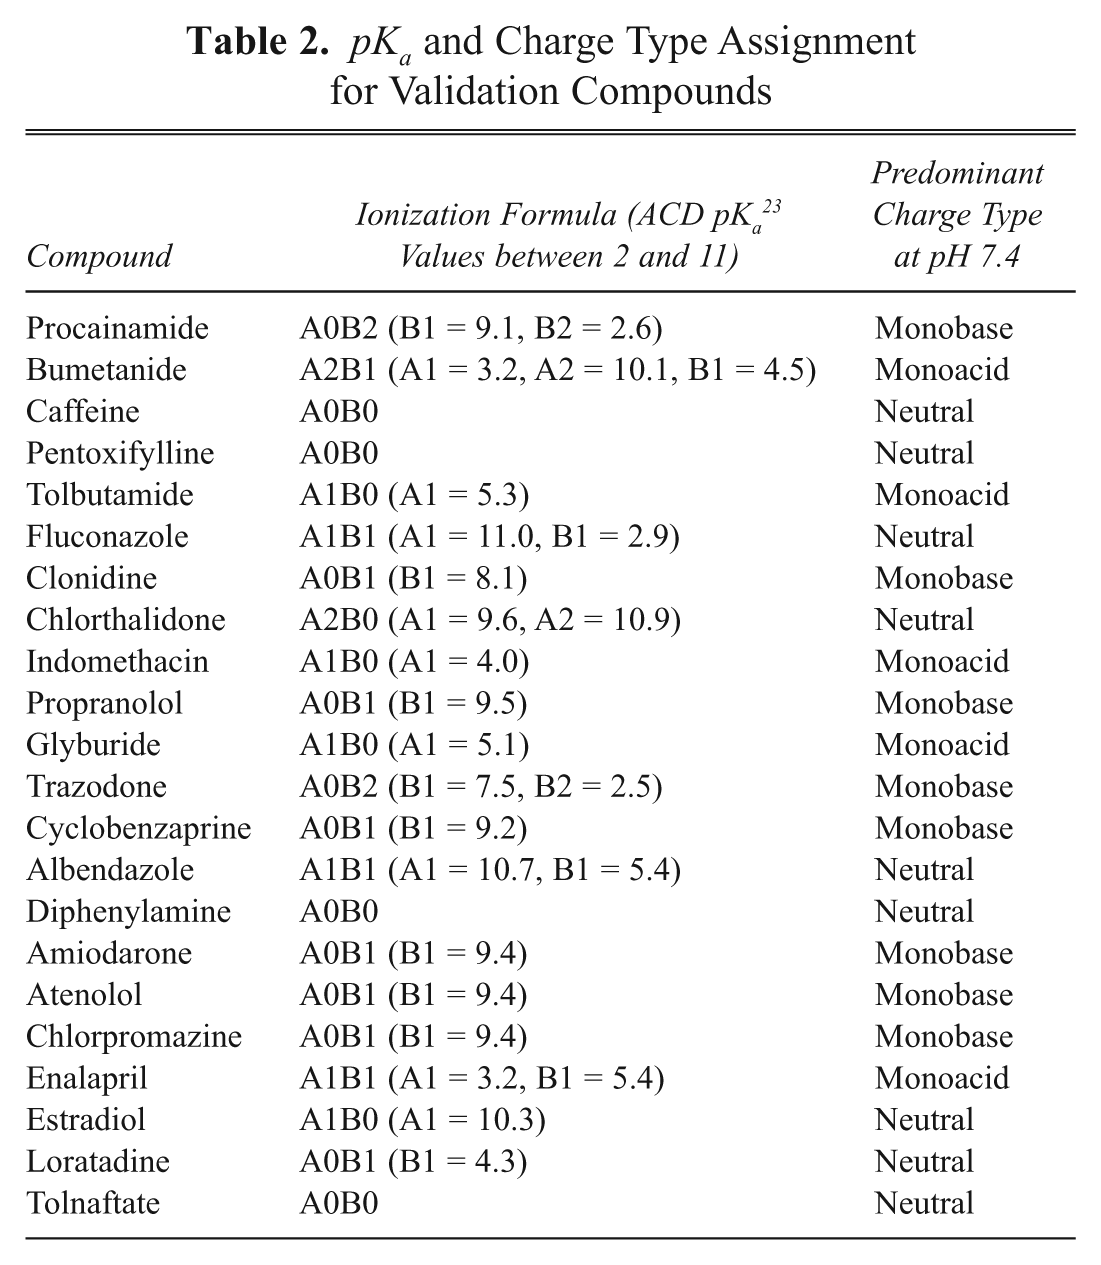
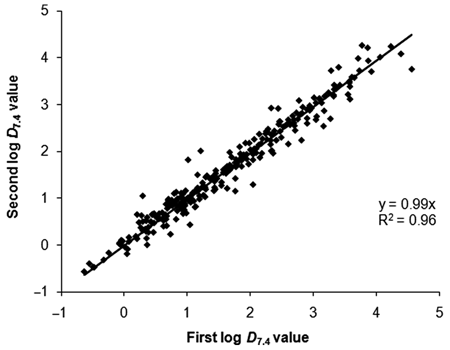
A set of 22 commercially available compounds exhibiting a wide range of lipophilicity and ionization class were selected for validation of the experimental method. To validate the use of mixtures of compounds, the method was first applied to the log D 7.4 determination of all 22 compounds, where each was measured individually. The log D 7.4 data from this experiment are shown in Table 1 along with previously reported literature values. The out-of-range log D 7.4 values generated using our method for single compounds are consistent with the previously reported data. The root mean square error (RMSE) between the log D 7.4 values generated using our method for single compounds, excluding the out-of-range values, and the previously reported data is 0.21 log units. A two-tailed paired t-test indicates that there is no significant difference between the two sets of data (p = 0.18, t stat = 1.39, t critical at 5% significance level = 2.13). Hence, the automated experimental procedure, when applied to single compounds, is able to reproduce literature data with a satisfactory level of random error (i.e., RMSE <0.3 log units) and with no evidence of significant systematic error. The 22 compounds were then assigned to 6 different mixtures as shown in Table 1 , each containing between 8 and 10 compounds, and the log D 7.4 values were determined for each compound when the experiment was run using mixtures. Each of the 6 mixtures contained examples of monoacidic, neutral, and monobasic compounds, and Table 2 lists the pK a s and charge type of the 22 validation compounds. The data from these experiments are shown in Figure 1 , which shows a plot of the mixture-derived log D 7.4 values against the values derived from single compounds, along with the line of unity. It is clear that there is very good agreement between log D 7.4 measurements performed individually and those performed in mixtures. The RMSE between the mixture and single data is 0.18 log units, and a two-tailed paired t-test shows that there is no significant difference between the two data sets (p = 0.47, t stat = 0.72, t critical at 5% significance level = 2.02).
Log D 7.4 Data for Validation Compounds Measured Individually (Singles) and in Mixtures
pK a and Charge Type Assignment for Validation Compounds
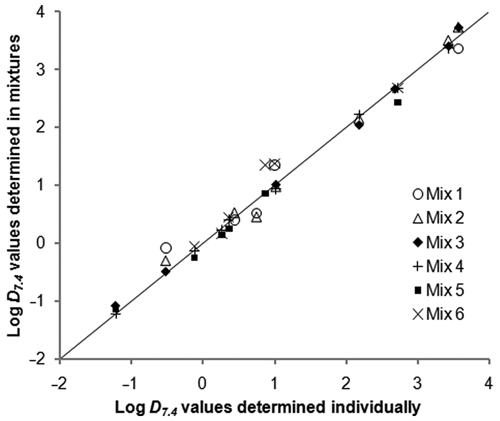
Comparison of log D 7.4 values measured in singles and mixtures.
To test the assay-to-assay precision of the mixture-based shake flask technique, the log D 7.4 of cyclobenzaprine was run in 200 separate assays, where on each occasion it was present in mixtures that contained different sets of compounds. The mean log D 7.4 for these measurements is 2.74 with a standard deviation of 0.13. The spread in these measurements can be seen in Figure 2 , and the data are normally distributed according to the Shapiro-Wilk test (p = 0.85). The small standard deviation of 0.13 indicates that any interactions between cyclobenzaprine and the other components of the many mixtures it has been measured in cannot be leading to significant shifts in the observed data. During the application of the mixture-based method to lipophilicity screening, repeat data on 287 compounds that were run on 2 different days were collected. Figure 3 shows a plot of the log D 7.4 values determined on the second date of testing against those determined on the first test date. The RMSE between these two data sets is 0.21 log units, and a two-tailed paired t-test indicates that there is no significant difference between the sets of data (p = 0.45, t stat = 0.76, t critical at 5% significance level = 1.97). Again, this demonstrates good reproducibility of the experiment and suggests that interactions between compounds in the mixtures are not leading to significant shifts in log D 7.4 values.
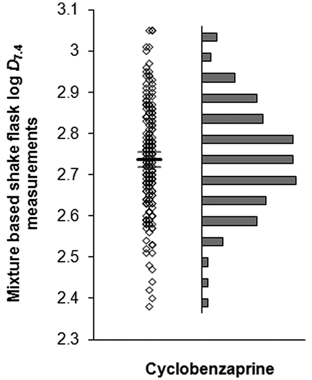
Plot of the spread in the 200 repeat log D 7.4 measurements for cyclobenzaprine as measured using the mixture-based shake flask technique.
Repeat log D 7.4 values measured on the same compound, but on different days, using the mixture-based shake flask technique.
Discussion
Experimental complexity
The experimental methodology extensively uses standard robotic liquid handling techniques and automated MS data processing to vastly reduce the manual effort needed to run a traditional log D 7.4 shake flask experiment. Furthermore, the nonlinear concentration–response property of some compounds justifies the generation of concentration–response calibration curves for every compound and adds to the scientific rigor of this generic technique.
Two aspects of running a log D 7.4 shake flask experiment are particularly time-consuming: (1) the liquid handling steps, particularly the time needed to prepare the partition phases and subsequently the time needed to separate these phases ready for analysis, and (2) the LC/MS analysis time. With respect to the former, 60 min is required for 10 compounds run in the traditional manner without the benefit of automated liquid handling and sample pooling. Using automated liquid handling, incorporating sample pooling into a mixture of 10 compounds, this time can be reduced by 10-fold, approximately 25% of which actually involves manual work. With respect to the LC/MS analysis time, the benefit of sample pooling, into mixtures of 10, results in a 3.6-fold reduction compared to methods that do not use sample pooling (when blank injections are also taken into consideration). 5,6
Dynamic range
The experimental procedure leads to an effective log D 7.4 measurement range of approximately −1.5 to 4.5. This maximum range is consistent with an oral drug discovery strategy targeting compounds with a log P of less than 5. 25 However, if the protein target requires ligands of higher lipophilicity, variation of the dilution factors for both the 1-octanol and aqueous phases can be used to modify this range accordingly. Some of the data from the method will be reported as out-of-range values such as >4.5 or <−1.5. For example, if the most dilute 1-octanol calibrant could be observed and formed the bottom of the calibration line, and if the most concentrated aqueous sample had an even lower response, the result would be quoted as log D 7.4 >4.5.
Technical information regarding MRM MS
The procedure uses mixture-based MRM MS methods containing the individual MRM MS method for each compound in a mixture. During the LC/MS analysis stage, the Premier-MS applies the approximate mixture-based MRM MS method and acquires the data by cycling through the individual MRM MS methods for each compound in a mixture. Each individual MRM MS method is tailored so that the Premier-MS only collects data for the major daughter ion of the parent ion, making this detection method highly sensitive. The Premier-MS is capable of collecting enough MS scans for each daughter ion in a mixture of 10 compounds for a typical peak width (refer to operating guides available from Waters Ltd. at www.waters.com). This is illustrated in Figure 4 . The top chromatogram shows the MS response peak versus the number of scans when the Premier-MS is set to just collect data for bumetamide. Similarly, the bottom chromatogram shows the data for bumetamide where it has been collected along with data for nine other compounds. The only difference in the methods used to generate these two chromatograms is the dwell time: 0.2 s (top) and 0.035 s (bottom)—the former resulting in 35 scans across the peak compared to 30 for the latter, with both satisfying the minimum quantification requirement of 15 scans to define a peak. However, the bottom chromatogram shows a 7-fold reduction in peak area. Such reductions are tolerable because of the increased sensitivity provided by the Premier-MS. In our experience, the simultaneous analysis of mixtures of up to 10 compounds does not compromise quantification. Mixture-based MRM MS methods of more than 10 compounds are possible, but this will affect the number of MS scans that are collected, and proper quantification of peaks may be compromised. Conversely, compounds with poor MS response or that show chemical instability in aqueous or 1-octanol media may need to be run in mixtures of less than 10 to maximize the collection of MS data. Care should be taken to avoid the pooling of compounds that may chemically react with one another. The risk of this happening is low as lead optimization projects tend to avoid synthesizing drug-like compounds that are chemically reactive because of their potential to cause toxicity.
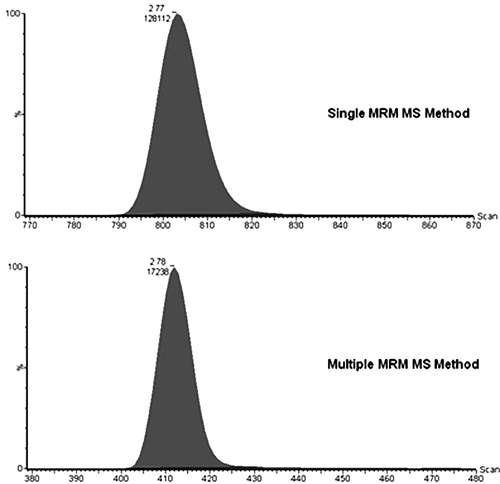
Response chromatographs showing the number of mass spectrometry (MS) scans collected when using a single multiple-reaction monitoring (MRM) MS method for detecting bumetamide alone, compared to a multiple MRM MS method where bumetamide is detected along with nine other MRM transitions. Parent ion (m/z) = 365.03, daughter ion (m/z) = 240.13, cone voltage = 24 v, collision energy = 16 eV.
The Premier-MS is a very high-end capability MS, and the applicability of the described log D 7.4 procedure will limit the breadth of its use. However, the ability to perform log D 7.4 measurement in mixtures of five is still possible when using tandem quadrupole MS with slower data acquisition speeds or single quadrupole MS using SIR MS methods. 5
Using the aqueous phase dilutions to generate a calibration curve
The situation can arise when the concentration–response calibration curve generated from the 1-octanol phase dilutions is poor or it is inappropriate to be used. This tends to happen for very hydrophilic compounds that have poor MRM MS response, where only one or two of the most concentrated 1-octanol phase dilutions can be quantified. A log D 7.4 for these compounds can still be determined provided that the three aqueous phase dilutions can be quantified and used to build a calibration curve. Provided that the relative concentration of one of the 1-octanol phase dilutions falls within the range of the calibration line, a log D 7.4 can then be determined.
Ion pair partitioning: consideration of erroneous results due to compound–compound interactions
Highly ionized compounds can be extracted as an ion pair, with a buffer counter ion, into the 1-octanol phase, which will cause the observed log D 7.4 values of such compounds to be shifted upwards and away from the correct value, and these deviations can be large. The possibility of erroneous results due to ion pairing interactions between compounds (e.g., between a protonated base and a deprotonated acid) within a mixture can also exist. Because extraction of ion pairs into phospholipid membranes is known to be much less favorable than into 1-octanol, 26 the process should be viewed as having little physiological relevance, and log D 7.4 measurement methods should be configured to minimize any ion pairing effects.
Austin et al. 26 used equation (1) to describe the observed 1-octanol/water distribution coefficient, D obs , for a monoacidic (HA) molecule.
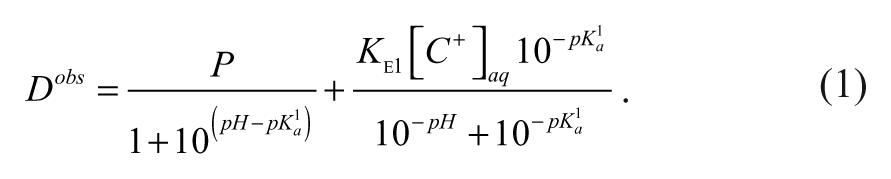
In equation (1), P is the 1-octanol/water partition coefficient of HA, and pK a 1 refers to the ionization constant for HA. K e1 is the extraction constant that quantifies the extent of ion pair partitioning for the anion of HA (see Austin et al. 26 for definition of K e1). Counter ions are introduced into the partitioning experiment from the aqueous buffer, so [C +] aq will be equivalent to the concentration of buffer cation assuming a mixture of buffer cations has been avoided. Equation (1) shows that the extent to which D obs is affected by the ion pairing process at a particular pH is a function of pK a 1, [C +] aq , and K e1. If pK a 1 has not been measured, it can be calculated with reasonable reliability using a commercially available algorithm, or it can be estimated from data on a close analogue. 23 Information on measured K e1 is sparse. A value of 991 M−1 has been reported for the K e1 for the ion pair between the anion of proxicromil and Li+, shifting to 360 M−1 when the counter ion changes to Na+. 26 Using a 0.02 M [Na+] aq and a predicted log P and pK a 1 of 4.82 and 2.30, respectively, the log D 7.4 with and without the ion pairing contribution is 0.89 and −0.28 respectively. 23 Even with the use of a low ionic strength buffer, observed values of log D at any pH above 6.0 will have significant deviation away from the correct value.
Scherrer and Donovan 27 have developed a potentiometric titration method in KCl/water-saturated 1-octanol that enables the ion pair partitioning coefficient, P I , of compounds to be determined. Their results can be used to show that K e1 is proportional to the log P of the compound. The coefficient P I is defined as the ratio of the concentration of the ionized compound in the 1-octanol phase to the concentration of the ionized compound in the aqueous phase; it does not differentiate the ion pair from the dissociated ion forms in each phase. For a monoacidic compound, P I is defined by equation (2).
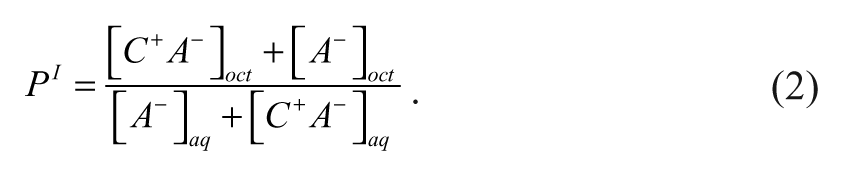
Equation (2) can be simplified if it is assumed that the ionized compound predominantly exists as the ion pair in the 1-octanol phase and as the dissociated ion in the aqueous phase such that [C + A −] oct > [A −] oct and [A −] aq > [C + A −] aq . It follows that K e1 can be related to P I by equation (3). 26
Equation (3) enables the estimation of K e1 to be made using the coefficient P I . Scherrer and Donovan’s work 27 allows for P I for a series of monoacidic compounds to be determined. Dividing the P I values by the [C +] aq (i.e., 0.15 M) leads to estimates for K e1 for the ion pairs between K+ and 20 different monoacids. A plot of log K e1 versus log P is shown in Figure 5 . This strong correlation allows for a good estimate of K e1 of a particular compound from its log P. A similar correlation to that shown in Figure 5 can be generated for the monobasic compounds studied by Scherrer and Donovan. 27 The resulting extraction constants would be between the monobasic cation and Cl−.
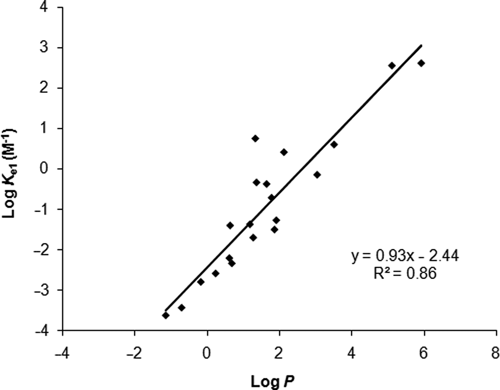
Plot of extraction constants (log K e1) for monoacids with K+ versus their log P using data reported by Scherrer and Donovan. 27
It can be predicted from the correlation in Figure 5 that K e1 for the ion pair between the anion of proxicromil and K+ is approximately 110 M−1. This is consistent with the measured proxicromil extraction constants of 991 M−1 and 360 M−1 for Li+ and Na+ because the magnitude of K e1 appears to be related to the polarizability of the counter ion. The harder or less polarizable the Lewis acid, the more the equilibrium is shifted toward the proxicromil ion pair to the counter ion, and in terms of hardness, Li+ > Na+ > K+. Based on these data from proxicromil, the extraction constants for ion pairs of other monoacidic compounds are expected to be about three times greater when the counter ion is Na+ compared to K+. This observation, in conjunction with a prediction of a monoacidic compound’s log P and pK a , enables a prediction of K e1 to be produced when a buffer containing Na+ is used. 23 The extent to which ion pairing will cause a deviation in D obs under particular experimental conditions can be estimated using equation (1). If the ion pairing contribution is significant, then the log D can be determined at a different pH such that it is minimized.
When log D 7.4 measurements are performed in mixtures, the presence of other compounds can be considered as counter ions. Equation (1) can be modified to account for the sum of all the different ion pairs that could affect the log D 7.4 of a particular compound in a mixture. With high-sensitivity MRM MS detection, low concentrations of compounds are used. Therefore, significant deviation in D obs resulting from intercompound ion paring interactions would only occur if the corresponding extraction constant between the two species was exceptionally large. Our validation work involving the reproducibility of data when compounds are mixed with a wide variety of other compounds in separate experiments ( Fig. 2 ) shows that significant intracompound ion pairing does not occur under the described experimental conditions. To further investigate the magnitude of K e1 for ion pairs between monoacidic and monobasic species, the method described by Austin et al. 26 could be modified, where the log D 7.4 of a monoacid would be determined in the presence of increasing concentrations of the monobasic species rather than the buffer counter ion.
With respect to monobasic compounds, the effect of ion pairing on D obs is much less than for monoacidic compounds because of the use of a phosphate buffer, existing predominantly as PO4 2− species at pH 7.4. The formation of an overall neutral triple ion pair involves two monobasic cations pairing with one counter ion, which is entropically unfavorable. Consequently, significant ion pair–induced deviations in log D 7.4 values for moderately basic compounds, up to pK a of 11, were not observed in our experiments. For more basic compounds, deviations in D obs due to ion pairing to PO4 2− can be modeled using a variation of equation (1) and estimates of K e1, although measurements of K e1, using similar methods to those described by Austin et al. 26 or Scherrer and Donovan, 27 are recommended.
This mixture-based shake flask log D 7.4 method has been shown to give high-quality, reproducible data across a wide dynamic range of measurement. The method is highly automated and has been successfully applied to a wide range of chemical classes. In common with other 1-octanol/water shake flask experiments, care must be taken with highly ionized compounds, particularly acids, with regard to the phenomenon of ion pair partitioning. Methods have been described that allow the experimenter to estimate how large the effect will be for a given compound under particular experimental conditions, which gives guidance to the modification of experimental conditions to minimize ion pair effects.