
Abstract
Protein glycosylation can impact the efficacy and safety of biotherapeutics and therefore needs to be well characterized and monitored throughout the drug product life cycle. Glycosylation is commonly assessed by fluorescent labeling of released glycans, which provides comprehensive information of the glycoprofile but can be resource-intensive regarding sample preparation, data acquisition, and data analysis. In this work, we evaluate a comprehensive solution from sample preparation to data reporting using a liquid chromatography–mass spectrometry (LC-MS)-based analytical platform for increased productivity in released glycan analysis. To minimize user intervention and improve assay robustness, a robotic liquid handling platform was used to automate the release and labeling of N-glycans within 2 h. To further increase the throughput, a 5 min method was developed on a liquid chromatography–fluorescence–mass spectrometry (LC-FLR-MS) system using an integrated glycan library based on retention time and accurate mass. The optimized method was then applied to 48 released glycan samples derived from six batches of infliximab to mimic comparability testing encountered in the development of biopharmaceuticals. Consistent relative abundance of critical species such as high mannose and sialylated glycans was obtained for samples within the same batch (mean percent relative standard deviation [RSD] = 5.3%) with data being acquired, processed, and reported in an automated manner. The data acquisition and analysis of the 48 samples were completed within 6 h, which represents a 90% improvement in throughput compared with conventional LC-FLR-based methods. Together, this workflow facilitates the rapid screening of glycans, which can be deployed at various stages of drug development such as process optimization, bioreactor monitoring, and clone selections, where high-throughput and improved productivity are particularly desired.
Introduction
The number of therapeutic proteins has increased steadily over the past several decades due to their high efficacy and low toxicity in disease treatment. 1 Glycosylation can often affect the safety and efficacy of biotherapeutics,2,3 making it one of the critical quality attributes (CQAs) that need to be characterized and monitored throughout the development and manufacturing process to ensure drug product quality.4,5 While the overall glycoprofile of protein therapeutics can indicate the level of control of biomanufacturing processes, some glycan species are particularly important as they can impact the key properties of the biotherapeutics. For example, high-mannose glycan species associated with antibody-based therapeutics can affect their in vivo half-life, lowering the overall potency of the therapeutic,4,6 whereas high levels of afucosylation can enhance the antibody-dependent cell-mediated cytotoxicity (ADCC).7,8 Sialylation can also influence the immunogenicity and clearance of the antibody drug product.4,9 The relative abundance of critical glycan species such as these needs to be quickly determined and monitored to facilitate efficient drug development processes such as cell line selection and process control, calling for rapid analysis methods to support the growing number of protein-based biotherapeutics.
N-glycosylation is commonly assessed through the N-linked glycans released from the protein backbone. The native structures of glycans lack a UV absorptive chromophore, thus requiring derivatization to yield a detector response when deploying an optical-based method. 10 Fluorescent labeling is commonly used to derivatize N-linked glycans to increase the sensitivity of glycan analysis, especially for the detection of low-abundance critical glycans. While suitable for profiling needs and quantitative analysis, fluorescence (FLR) detection alone offers limited structural information. In this regard, mass spectrometry (MS) has been increasingly used online and offline with FLR detection as an orthogonal technology to provide structural information as well as the identity of released glycans.3,5 However, conventional labeling methods using reductive amination reactions and reagents such as 2-aminobenzamide (2-AB) and 2-aminoanthranilic acid (2-AA) produce labeled glycans that generate weak MS responses, especially for low-abundance glycan species. 11 Furthermore, these labeling methods can be time-consuming by current standards. To this end, effort has been devoted to improving the MS sensitivity of released glycans as well as increasing the throughput of sample preparation.12–15 In recent years, procainamide has become a popular labeling reagent for its increased MS sensitivity. However, because the labeling reaction of procainamide follows a similar mechanism pathway to that of 2-AB, it offers little advantage in shortening sample preparation time compared with 2-AB-based methods.13,16 In contrast to this method, Baginski demonstrated that directly labeling glycosylamine instead of free glycans can increase the speed of fluorescent labeling. 17 Cook et al. developed a rapid tagging group with direct glycosylamine labeling capability, which reduced the sample preparation time but had a negligible effect on MS ionization efficiency. 12 In 2013, a rapid glycan labeling reagent, RapiFluor-MS (RFMS), was developed to enhance the FLR and MS sensitivity of labeled N-glycans. 15 Followed by this work, alternative rapid labeling reagents were also developed using the same reaction mechanism, providing similar gains in fluorescent and MS sensitivity. 18 To increase the glycan labeling throughput, the RFMS reagent was introduced as a plate-based kit allowing for the preparation of up to 96 glycan samples at one time.15,19 With the kit format, suitable automation platforms can be selected for sample preparation that proportionally scale to throughput needs across an organization’s pipeline.
Upon labeling, the released glycans are subjected to chromatographic separation for analysis using hydrophilic interaction chromatography (HILIC) as the preferred mode of separation,20,21 with FLR detection as the optical detector to determine abundance. However, the HILIC separation typically requires a long separation time to fully resolve the glycan structures for identification.22,23 Moreover, inclusion of external glycan standards is often needed to achieve retention time calibration/normalization across samples, adding extra time to the analysis. Capillary electrophoresis (CE)-based methods offer higher throughput for glycan screening. However, CE separation is often reported to suffer from robustness in operation and is difficult to couple with a mass spectrometer for mass confirmation. 22 Ultra-high-performance liquid chromatography (UPLC) has been demonstrated to be effective and robust in its ability to resolve closely related glycan species in a short time, offering the means to address throughput deficiency while being directly compatible with MS.22,24,25 Existing workflows using UPLC-MS-based methods have enabled in-depth characterization of released glycans for therapeutic proteins (e.g., monoclonal antibodies [mAbs]) with measurable impact on throughput compared with high-performance liquid chromatography (HPLC)-based methods (>2-fold faster). 26 However, even a relatively short run time of 0.5–1 h in UPLC-MS analysis would still require a significant amount of time to handle a large number of incoming samples. To address the analysis needs of high-volume sampling, a rapid and robust method for released glycan screening is highly desired during the process development of biotherapeutics.
Here we report a comprehensive automated UPLC-FLR-MS-based analytical workflow for the rapid screening of released glycans (
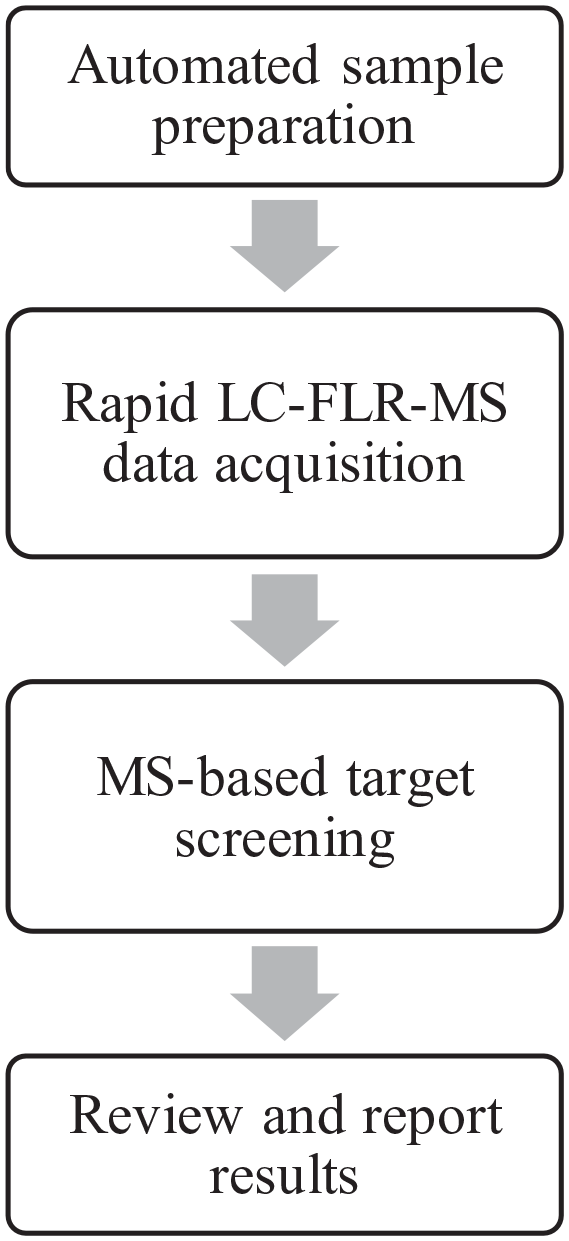
Automated complete workflow for analysis of released glycans.
Materials and Methods
Reconstitution of Released Glycan Standard and Protein Samples
One vial of 100 pmol RFMS-labeled released glycan performance test standard (Waters, Milford, MA) was reconstituted in 40 µL of the solution consisting of water/dimethylformamide/acetonitrile (9/10/21, volume ratio). Six batches of mAb samples were obtained from our collaborator, including four batches of innovator infliximab (Remicade) and two batches of biosimilar infliximab (Inflectra). All infliximab samples were diluted with water from stock solution to a final concentration of 1.5 mg/mL.
Automated N-Glycan Releasing and Labeling
The N-glycans were prepared using the GlycoWorks RapiFluor-MS N-glycan kit (Waters) on an Andrew Alliance pipetting robot (Geneva, Switzerland) as described previously. 19 Briefly, 10 µL of diluted infliximab sample was loaded to a 96-well sample plate. Reagents including RapiGest surfactant, Rapid PNGase F enzyme, and RFMS labeling reagent were used for protein denaturation, N-glycan release, and labeling, respectively, by following a modified protocol in the GlycoWorks RapiFluor-MS N-Glycan Kit Care and Use Manual (p/n 715004793). 19 A total of 48 released N-glycan samples were prepared, including 12 samples from batch 1 of innovator infliximab, 6 samples from each of the other three batches of innovator infliximab, 6 samples for each of two batches of biosimilar infliximab, and 6 samples from a blank control solution. After the glycan labeling protocol was completed, 0.25 pmol of a high mannose glycan standard (Waters) was spiked into each of six released glycan samples prepared from innovator batch 1. This group of samples was used to evaluate the capability of the workflow to capture the relative abundance changes in glycans across samples.
HILIC-FLR-MS Analysis of Released N-Glycans
The labeled released N-glycans were analyzed on a Waters BioAccord system. The system configuration includes an ACQUITY UPLC I-Class PLUS coupled to an ACQUITY UPLC FLR detector and an ACQUITY RDa Time-of-flight mass detector (Waters). The separation of N-glycans was conducted at 60 °C using a 2.1 × 50 mm Waters ACQUITY UPLC Glycan BEH Amide column (1.7 µm particle size, 130 Å pore size). LC-MS-grade water and acetonitrile were purchased from Honeywell (Canton, MA) and used for mobile phase preparation. Mobile phase A was 50 mM ammonium formate in water (pH 4.4), while mobile phase B was 100% acetonitrile. At a constant flow rate of 1.0 mL/min, the gradient was set as 25%–42% A over 3.50 min, 42%–60% A in 3.55 min and maintained at 60% A until 3.75 min, and 25% A from 3.80 to 5.00 min for reequilibration. As a comparison, a standard 55 min gradient separation was carried out using the same mobile phase composition and the same column temperature.
15
The detailed gradient condition is listed in
MS Data Interpretation
Acquired MS data of the glycans were automatically processed using the UNIFI 1.9.4 Scientific Information System. The processing method uses the “Accurate mass screening” workflow (also known as the MS screening workflow) in UNIFI and a scientific library specially created for the method. In the current study, 18 glycans of interest were imported from a library as the targets. To match the glycans in the library, search criteria of 10 ppm mass tolerance and 0.08 min retention time window were used. The quantitation of each glycan was based on the area of extracted ion chromatogram (XIC) of all isotopes of observed protonated species and their corresponding salt adducts in the MS spectra. A reporting method was created to include a summary plot and relative quantitation information of key glycan species. After creating the processing and reporting methods, the data were processed and reported in an automated manner.
Results and Discussion
Method Development for Rapid Screening of Released N-Glycans
The analysis of released N-glycans is commonly conducted by HILIC separation, followed by identification using either retention time or accurate mass. Relative quantification of released glycans is typically based on FLR response, which is generally regarded as reliable and sensitive. This methodology often requires developing an LC separation method that can fully resolve critical glycan structures for accurate peak integration. MS signals can differentiate co-eluted glycan peaks that have different molecular weights, therefore removing the need to achieve a chromatographically resolved separation for glycan identification and quantitation, leading to shorter analysis times. To evaluate the feasibility of this hypothesis, a 5 min separation method was developed using a 5 cm column on the integrated LC-FLR-MS system. Previous work demonstrated that a shorter column length can accelerate the separation for 2-AB-labeled glycans.
27
The short column length allows the use of a higher flow rate and shorter run time without exceeding pressure limits of the LC system or column, which can adversely impact column equilibration and ultimately chromatographic performance.
Figure 2
shows the separation of the RFMS-labeled N-glycan standard pooled from human and mouse immunoglobulin G using the high-throughput 5 min method (
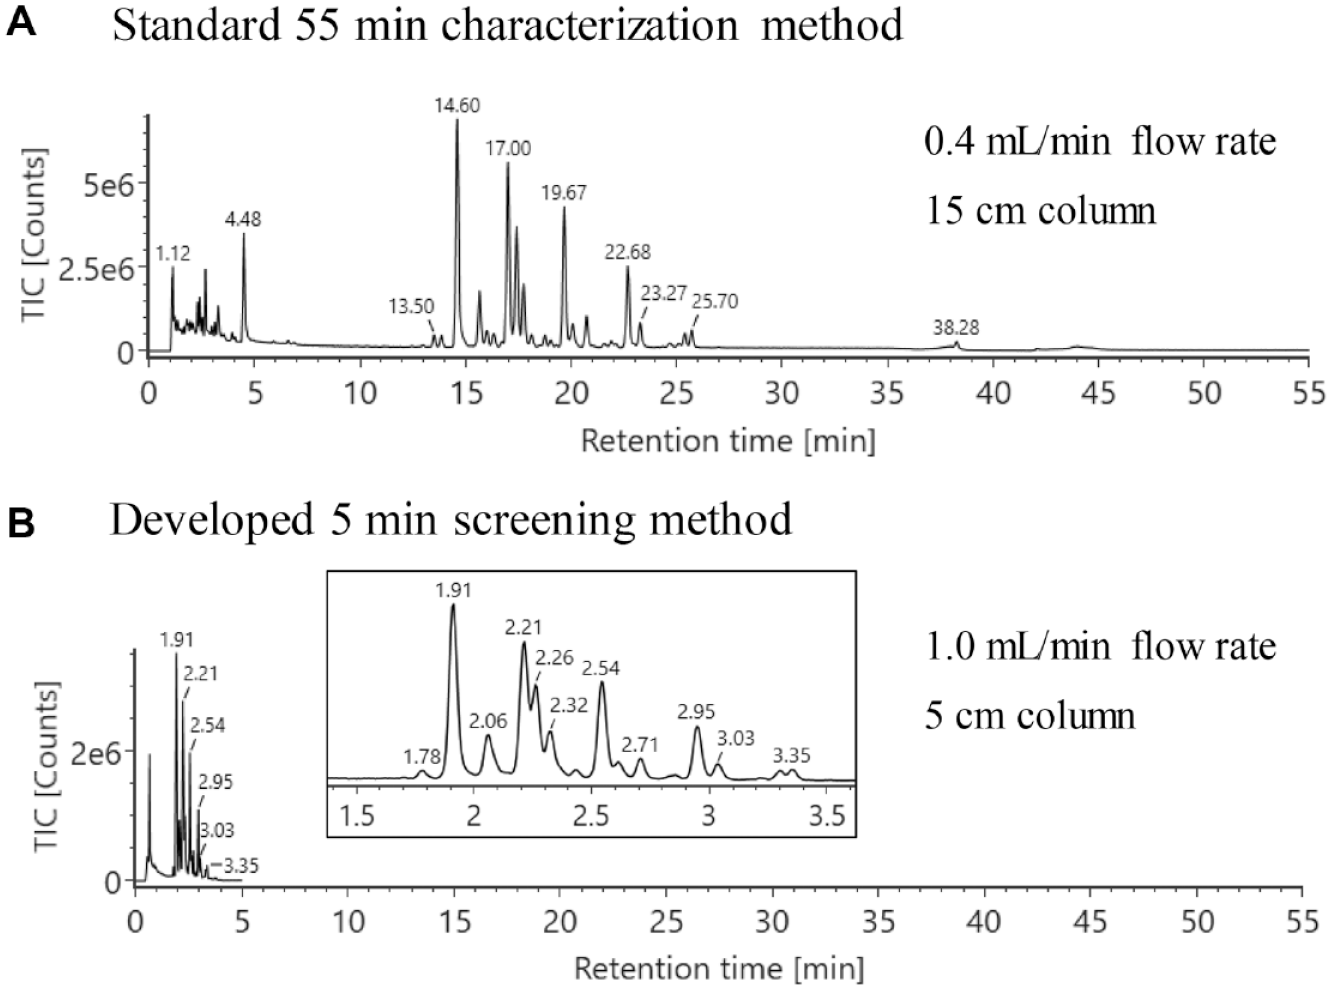
A 5 min UPLC-FLR-MS method was developed for released glycan screening to increase analysis speed. (
Due to the complexity of glycan profiles in biotherapeutics, data interpretation is often the bottleneck in rapid analysis of released glycans. To assign the glycan peaks, glucose unit (GU) values generated by an external retention time calibration standard, such as a dextran ladder, are commonly used in released glycan analysis. However, the peak assignment can be ambiguous when dealing with chromatographically unresolved peaks, requiring orthogonal detection methods such as MS to confirm the peak identity. In this work, identification and relative quantitation of released glycans were achieved automatically using an integrated data processing workflow in the UNIFI informatics platform. As described in the workflow in
Figure 3A
, the peaks were assigned through the matches between measured glycan masses and the accurate masses in a glycan structural library. In addition, replicate injections performed on three columns showed minimal retention time variations under the given method conditions (
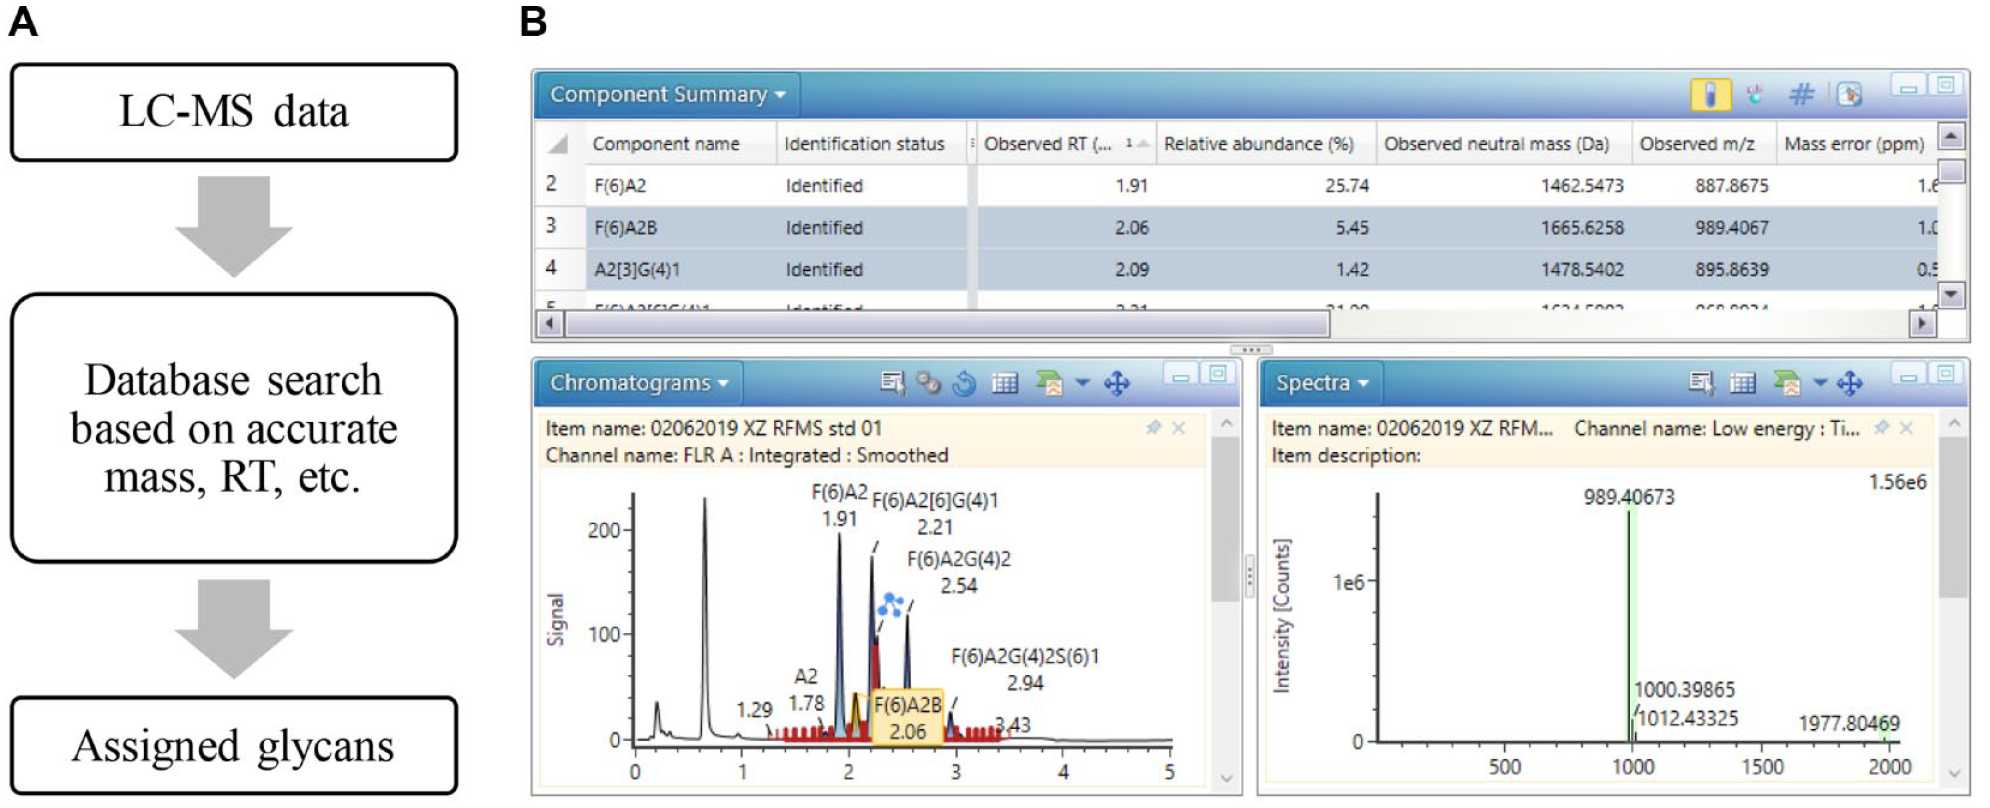
Informatics platform for automated UPLC-FLR-MS data processing. With the accurate mass-based targeted search, the software compares the known components from the database compiled by users and assigns the peaks. Retention time was also used as part of the search criteria to increase identification accuracy. Information including chromatogram, MS spectra, and component information for identified and unknown components was obtained. Sample: RFMS-labeled N-glycan standard pooled from human and mouse immunoglobulin G.
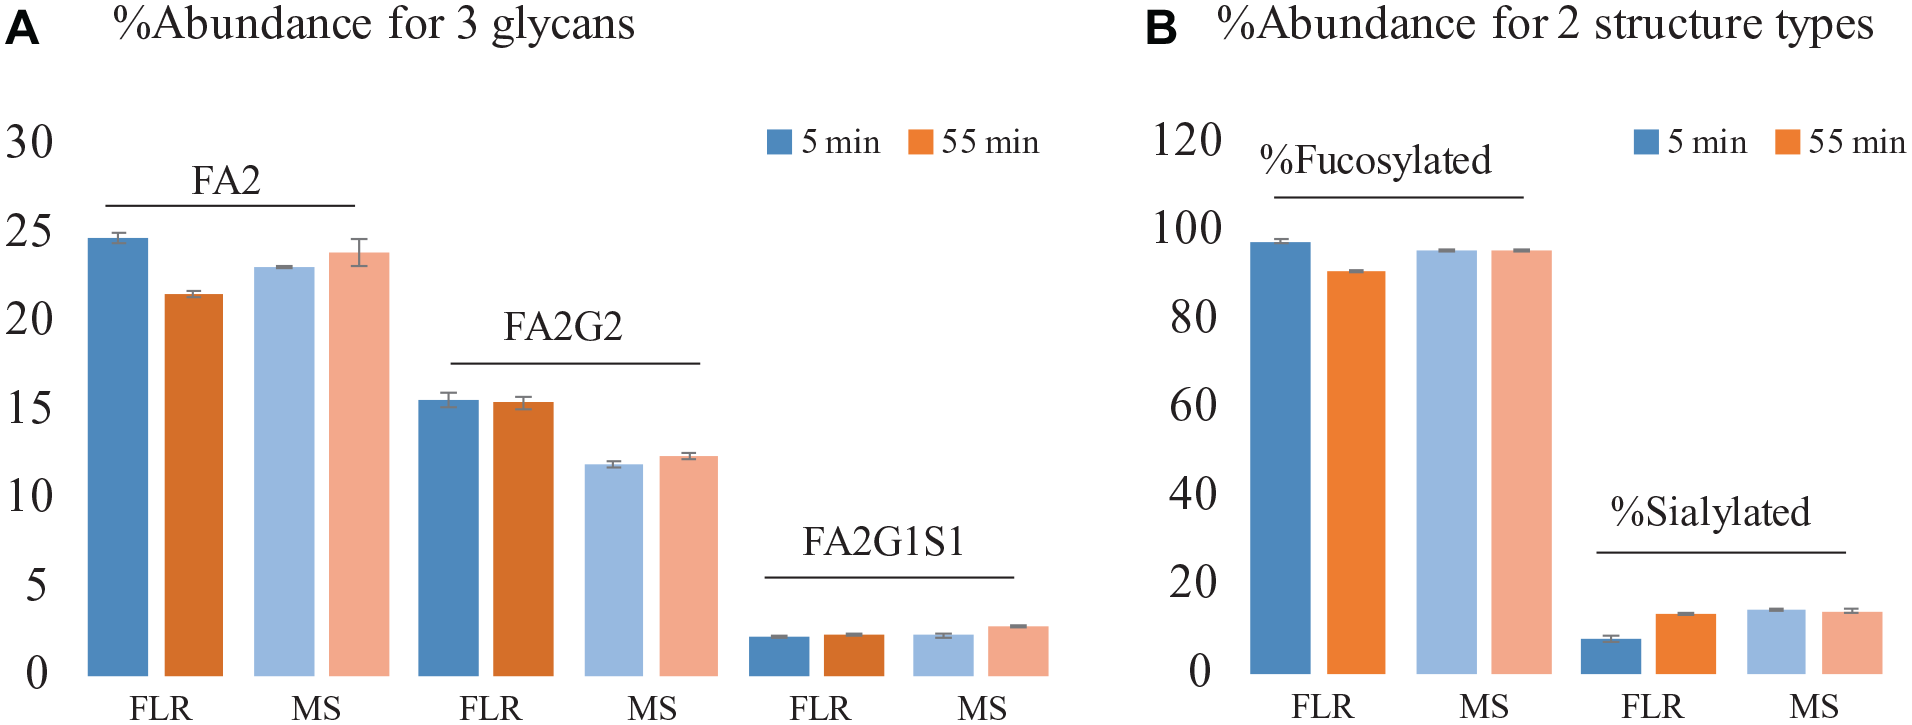
To assess the use of MS response for the relative quantitation of glycans, the relative abundances of three representative glycans, calculated based on either FLR or MS responses, were compared. MS relative quantitation was based on the sum of the peak areas of XICs of all isotopes of protonated species and the corresponding salt adducts for each glycan. As shown in Figure 4A , the relative abundances of glycan species are comparable across methods. With FLR-based quantitation, differences in relative abundance were observed. For example, the measured relative abundance of glycan FA2 was 24.7% for the 55 min separation method and 21.6% for the 5 min separation method. The observed quantitation difference is likely due to integration differences from peak compression in the chromatographic profile when the steeper gradient was used. In contrast to this, quantitation results based on XICs are more consistent between the two separation methods. For example, the difference in the relative abundance of FA2 between the two separation methods was approximately 1% in MS-based quantitation compared with approximately 3% in FLR-based quantitation. The differences in the relative abundance of the two lower-abundance glycans species, FA2G2 and FA2G2S1, were also found to be less than 0.8% and 0.3%, respectively. This suggests that the co-elution, if present, had negligible effect on MS response in terms of signal suppression between the two separation methods. Differences in relative abundances were observed for the same glycan when comparing the values between MS- and FLR-based quantitation, which is expected since these abundance values were acquired based on the measurement of two fundamental physicochemical properties of the molecules. To evaluate the reproducibility of MS-based quantitation, percent relative standard deviation (%RSD) in glycan abundance was calculated based on three consecutive injections. Less than 3% RSD was obtained for all glycans evaluated, which demonstrated good quantitative repeatability of the developed method. Similarly, as shown in Figure 4B , comparable relative abundances were also obtained for glycan attributes such as fucosylated glycans (%RSD = 0.08) and sialylated glycans (%RSD = 2.86), demonstrating the general applicability and repeatability of using MS data for relative quantification of released glycans. The high reproducibility of the data demonstrates that the workflow can be applied to glycan screening to closely monitor the glycan profiles in biopharmaceutical development.
(
Rapid Batch Screening of N-Glycans Derived from Infliximab
During the development of biotherapeutics, it is often necessary to perform glycan analysis for a high volume of incoming samples in process optimization, bioreactor monitoring, or late-stage comparability tests. To explore the applicability of this analytical platform in these environments, 48 samples of released N-glycans derived from six batches of infliximab were analyzed using the developed workflow within 6 h. To readily recognize the abundance changes of individual glycans in any sample among the batches under analysis, the expected abundance levels (threshold limits) of critical glycan species were set up in the processing method. The limits can reflect the acceptance criteria of individual quality attributes that are usually determined based on historical knowledge of the product. As a proof of concept, the “Error” limits were set as 8.0%, 10.0%, and 95.0% for mannose 5, sialylated, and fucosylated glycans, respectively, based on previous experimental results on infliximab. 28 Additionally, the “Warning” limits were set as an optional specification to more closely monitor the change in the level of glycan species. In Figure 5A , the processed results were shown in the format of a sample plate so that out-of-spec results such as the samples from batch innovators 1B and 2 could be quickly captured for further investigation. To investigate the reasons for the out-of-spec results, the autogenerated summary plots were reviewed to compare the quantitation results of glycans across all samples. As shown in Figure 5B , innovator 1B (the innovator infliximab with spiked high-mannose standards) has elevated mannose 5 (approximately 4% higher) compared with the other sample batches (top panel). Similarly, the summary plot of the sample with the “Warning” sign (innovator 2) shows that its sialylated glycan species (bottom panel) are approximately 3% higher in relative abundance than the rest of the samples. The levels of mannose 5 and sialylated glycans were also found to be slightly higher in the two batches of biosimilar infliximab samples compared with the four batches of innovator infliximab samples. The quantitation results for the two glycans show good consistency (mean %RSD = 5.3%) in relative abundance within the same batch. Higher variability was observed in lower-abundance species as expected. The average %RSD of relative abundance was observed to be 2.4% for major glycan species that have greater than 2% of relative abundance. These results demonstrate the speed and reproducibility of the developed method for screening released glycans from a large set of samples. For glycoproteins with more complex glycan patterns than mAbs, similar methods can be developed using the same approach to monitor the N-glycan profiles of the sample. In such cases, optimization of sample preparation might be needed to achieve complete deglycosylation, while the separation method might need to be optimized for monitoring some critical pairs of glycans depending on the development stage and the purpose of glycan screening. Overall, it is perceived that this method is applicable to the studies that need rapid analyses of a large number of samples, such as cell culture media selections, comparability tests in the late stage, and optimization of biosimilar glycoprofiles.
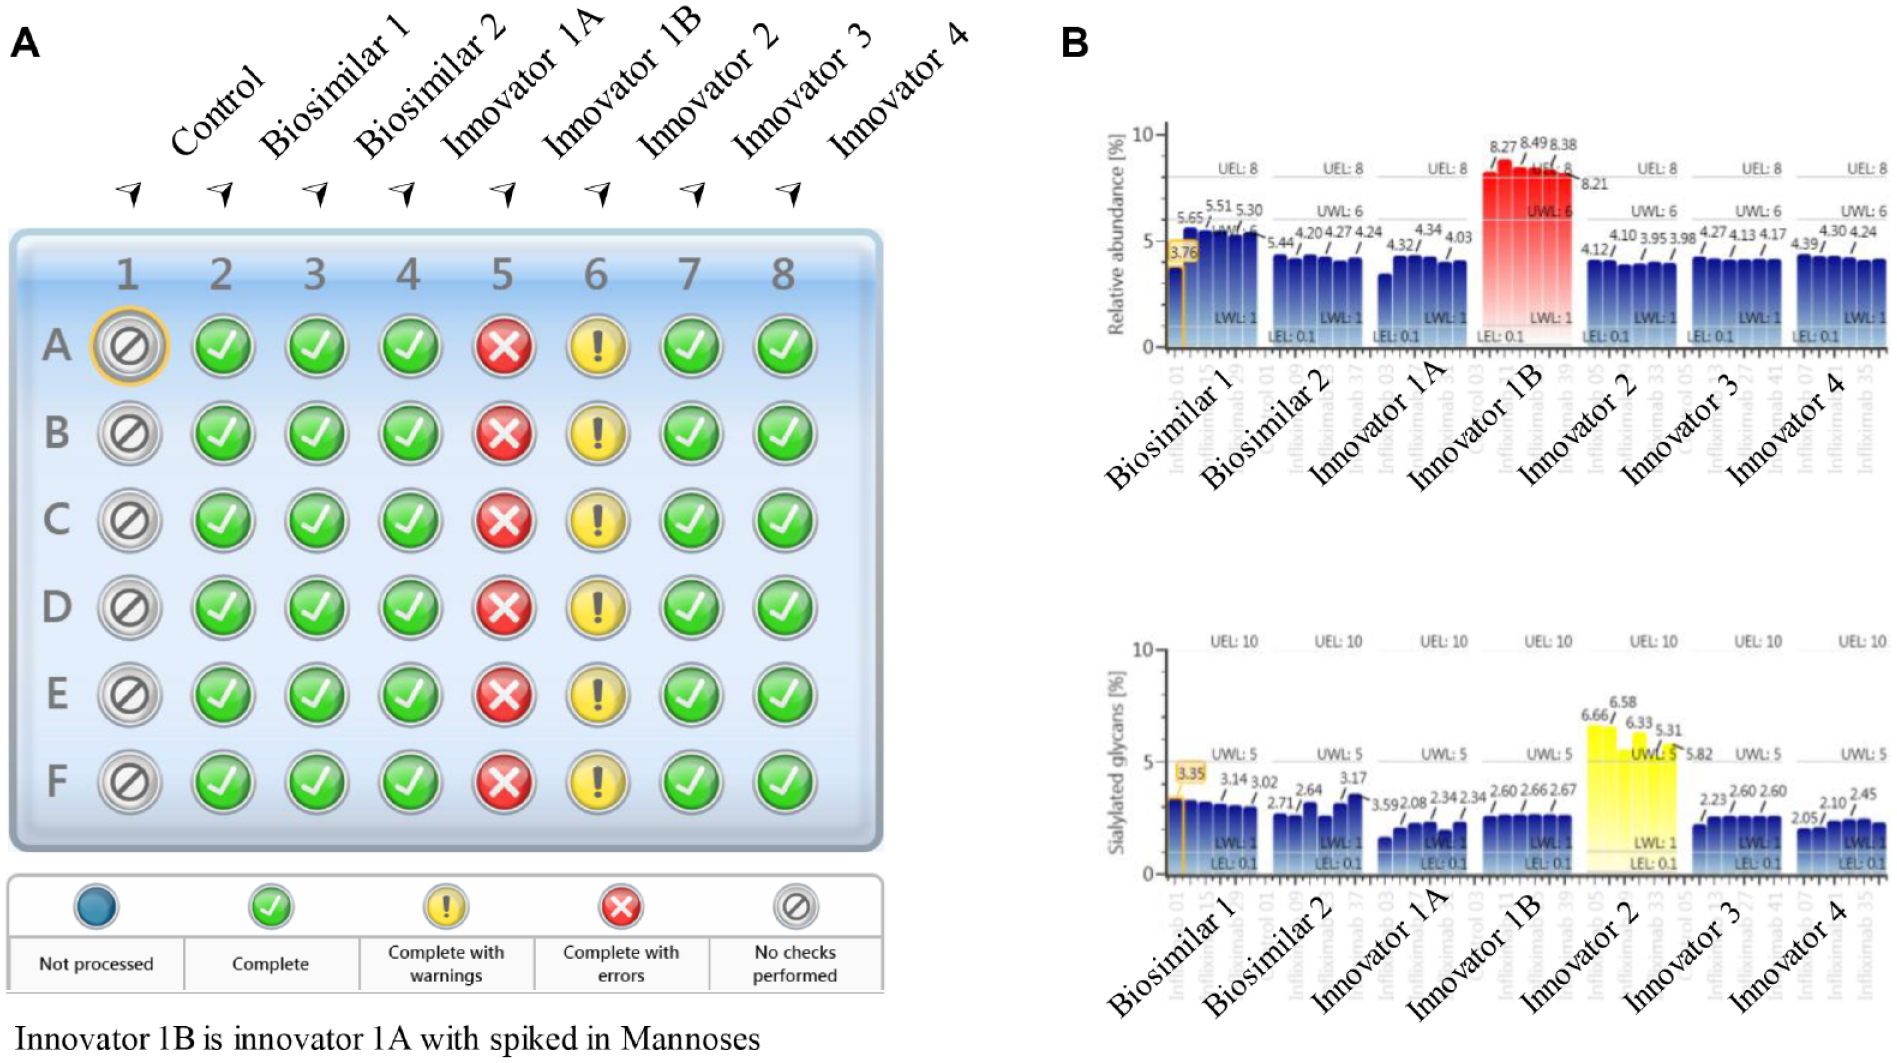
Released glycan screening results of multiple batches of infliximab. (
Conclusion
In this work, a comprehensive workflow was developed on a UPLC-FLR-MS analytical platform for analysis of released glycans, where MS information was used as the primary identification and quantification measure offering high-throughput capability. Sample preparation, LC-MS data acquisition, and processing can be completed automatically with minimal user intervention. To demonstrate the applicability of the workflow to the biopharmaceutical development, a 5 min method was developed on an integrated UPLC-FLR-MS system for rapid analysis of released glycans and used in the screening of 48 samples of infliximab from six different batches. The identity and relative abundance of released glycans were obtained in an automated manner. The levels of critical glycan species such as high mannose and sialylated glycans were also evaluated among the samples. Using the developed method, out-of-spec results were captured and reported with detailed information for further investigation. The analyses can be completed within 8 h, including sample preparation, data collection, data processing, and reporting for a total of 48 glycan samples derived from mAbs. For glycoproteins with more complex glycan patterns, the same approach can also be used to develop similar methods for automated monitoring of glycan profiles with optimization of sample preparation and separation. Collectively, this comprehensive workflow provides a viable solution for high-throughput analysis of released glycans, which can be used in the process development of biotherapeutics with improved productivity.
Supplemental Material
Supplemental_material_for_High_Throughput_Glycan_Screening_by_Zhang_et_al – Supplemental material for High-Throughput Analysis of Fluorescently Labeled N-Glycans Derived from Biotherapeutics Using an Automated LC-MS-Based Solution
Supplemental material, Supplemental_material_for_High_Throughput_Glycan_Screening_by_Zhang_et_al for High-Throughput Analysis of Fluorescently Labeled N-Glycans Derived from Biotherapeutics Using an Automated LC-MS-Based Solution by Ximo Zhang, Corey E. Reed, Robert E. Birdsall, Ying Qing Yu and Weibin Chen in SLAS Technology
Footnotes
Acknowledgements
The authors wish to thank Andrew Alliance for providing the Andrew Alliance pipetting robot and customizing the GlycoWorks protocol for automated N-glycan sample preparation.
Supplemental material is available online with this article.
Declaration of Conflicting Interests
The authors declared no potential conflicts of interest with respect to the research, authorship, and/or publication of this article.
Funding
The authors received no financial support for the research, authorship, and/or publication of this article.
References
Supplementary Material
Please find the following supplemental material available below.
For Open Access articles published under a Creative Commons License, all supplemental material carries the same license as the article it is associated with.
For non-Open Access articles published, all supplemental material carries a non-exclusive license, and permission requests for re-use of supplemental material or any part of supplemental material shall be sent directly to the copyright owner as specified in the copyright notice associated with the article.