
Abstract
Many attractive targets for therapeutic intervention are enzymes that catalyze biological reactions involving small molecules such as lipids, fatty acids, amino acid derivatives, nucleic acid derivatives, and cofactors. Some of the reactions are difficult to detect by methods commonly used in high-throughput screening (HTS) without specific radioactive or fluorescent labeling of substrates. In addition, there are instances when labeling has a detrimental effect on the biological response. Generally, applicable assay methodologies for detection of such reactions are thus required. Mass spectrometry (MS), being a label-free detection tool, has been actively pursued for assay detection in HTS in the past several years. The authors have explored the use of multiparallel liquid chromatography coupled with tandem mass spectrometry (LC/MS/MS) for high-throughput detection of biochemical reactions. In this report, we describe in detail the assay development and screening with a LC/MS-based system for inhibitors of human diacylglycerol acyltransferase (DGAT1) with a chemical library of approximately 800,000 compounds. Several strategies and process improvements have been investigated to overcome technical challenges such as data variation and throughput. Results indicated that, through these innovative approaches, the LC/MS-based screening method is both feasible and suitable for high-throughput primary screening.
Introduction
M
In this report, we describe in detail our approach using a LC/MS/MS-based assay in a large-scale screening campaign for inhibitors of human diacylglycerol acyltransferase (DGAT1). DGAT1 is a member of the acyl-CoA:cholesterol acyltransferase (ACAT) family and catalyzes the final step of triglyceride (TG) synthesis by combining diacyl glycerol (DAG) and fatty acyl-CoA. 17,18 The reduction in DGAT1 activity has potential therapeutic benefits by lowering plasma TG and low-density lipoprotein (LDL) cholesterol level 19 and also produces an antiobesity effect. 20 DGAT1 exemplifies many metabolizing enzymes for which the activity is difficult to measure. For instance, DGAT activity is routinely determined by the acylation of exogenous DAG with radiolabeled fatty acyl-CoA and using thin-layer chromatography (TLC) to separate the radiolabeled TG formed in the reaction. 17,18,21
To adapt the LC/MS-based assay for DGAT1 HTS, several strategies and process improvements have been investigated to overcome technical hurdles such as throughput and data variation. With the optimized assay and process, we successfully carried out a DGAT1 primary screening of approximately 800,000 compounds in approximately 8 weeks. The screening results showed that both the assay quality and hit-finding capability were sufficiently high. These results demonstrated that, with appropriate screening strategies, an LC/MS-based method for large-scale primary screening is practically achievable and particularly useful for biological targets for which the conventional HTS assays are difficult to implement.
Materials and Methods
Reagents and materials
The reagents and materials used for this study are listed in the following. 1,2-Dioleoyl-sn-glycerol (diolein) and oleoyl coenzyme A (oleoyl-CoA) were obtained from Avanti (Alabaster, AL). Pentanol and DMSO were obtained from Fisher Biotech (Subiaco, WA). 1,2,3-Tri(cis-9-octadecenoyl)glycerol (or glyceryl trioleate/triolein) and glyceryl tripalmitate (or tripalmitin) were obtained from Sigma (St. Louis, MO). The internal standard 1,1,1-13C-glyceryl trioleate (or 3-13C-glyceryl trioleate or 13C-triolein) was obtained from Cambridge Isotope Laboratories (Andover, MA). Deep-well polypropylene 384-well plates were purchased from Greiner Bio-One (Longwood, FL). All other chemical reagents and solvents were obtained from Sigma or stated otherwise.
Enzyme solution and substrate mixture preparation
The enzyme used in this assay was prepared as membrane fraction from Sf9 cells overexpressing human (His)6DGAT1 (hDGAT1). An aliquot of frozen recombinant hDGAT1 protein membrane was thawed and diluted 1:10 with the enzyme buffer (100 mM HEPES, 100 mM MgCl2, pH 7.5) and homogenized briefly 5 times on ice by a Wheaton Potter-Elvehjem homogenizer. After homogenization, the enzyme was further diluted in the same enzyme buffer to 0.025 mg/mL as working concentration for the DGAT1 assay. Diolein and oleoyl-CoA were dissolved to a stock concentration of 10 mM in 100% ethanol and 10 mM sodium acetate (pH 4.5), respectively. Then, these 2 portions were diluted and mixed gently to give a substrate mixture with working concentrations of diolein and oleoyl-CoA both at 100 µM.
Assay development and validation
The assay procedure and initial condition were adapted from an earlier report for DGAT with radioactive detection. 17 The DGAT assay was modified and conducted in 384-deep well plates. The amount of hDGAT1 enzyme used in the assay was determined by a 9-point enzyme titration series (1:2 serial dilution [v/v] using the enzyme buffer in a range from 0.125-0.0009 mg/mL). Substrate titrations were carried out with varied amount of each substrate (diolein or oleoyl-CoA, both from 400-3.12 µM). After the enzyme and substrate titrations, a time course was retested to confirm the linear range of reaction response under the selected enzyme and substrate conditions. In addition, a known DGAT1 inhibitor, LCD344, was examined for inhibition of hDGAT1 activity, and IC50 values were obtained from an 11-point dilution series, ranging from 3.3 µM to 0.056 nM (1:3 serial dilutions). To further validate the assay for its hit-finding capability and data reproducibility in screening, assay plates with randomly spiked LCD344 at 3 concentrations (corresponding to ~ 90% inhibition, 50% inhibition, and 10% inhibition) were tested twice in 2 separate runs, and the results were compared.
Procedure of DGAT1 inhibitor screening
First, 384-deep well assay plates were predotted in each well with 2 µL of compound (or DMSO in control wells in columns 23 and 24). Then, 25 µL of the enzyme working solution and, 10 min later, 25 µL of substrate mixture were dispensed to each well using a WellMate™ liquid dispenser (Matrix Technology, Hudson, NH). The final screening concentration for each compound was 8 µM for the orthogonally pooled mixtures (10 compounds/mixture) or 10 µM for compounds in singleton. The reaction was allowed to proceed at room temperature for 30 min. After incubation, reaction was stopped by adding 10 µL of 10% acetic acid containing 5 µM 3-13C-triolein (internal standard) to each well. Afterward, 50 µL pentanol was added in all wells using a WellMate™. The plates were sealed with “nonsticky” aluminum seal with a PlateLoc™ plate sealer (Velocity11, Menlo Park, CA) and then put on a plate shaker (Barnstead lab, Dubuque, IA) and agitated with maximum speed for 5 min to extract triolein into the organic phase. In negative control wells (in column 24), the same stop solution was added before the reaction started. The positive control wells (in column 23) contained all the components of reaction with only the corresponding amount of DMSO. The final concentration of DMSO in all wells was 3.8%, at which concentration DMSO has no significant effect on the enzymatic reaction.
LC/MS/MS setup, analysis methods, and data processing
LC/MS/MS analyses were performed on a MUX-LC/MS/MS system operating in a 4-way parallel mode, and the MS operating parameters were the same as described previously. 15 This system consisted of a Gilson 215/889 parallel autosampler, 4 Agilent binary high-performance liquid chromatography (HPLC) pumps, and a Micromass Quattro Micro with a 4-way MUX source ( Fig. 1 ). For each sample, a 5-µL plug of the organic phase (i.e., pentanol) from liquid-liquid extraction in the assay plates was injected onto a Thermo Betabasic C4 guard column (2.1 mm inner diameter × 20 mm total length, 5-µm particle size) and eluted isocratically (1.6 mL/min) using the mobile phase (51.5% isopropyl alcohol, 35% acetonitrile, and 13.5% water containing 0.1% ammonium formate). Two 6-port 2-way Rheodyne valves were used to divert the mobile phase for 0.2 min, at which time the primary Agilent HPLC pump triggered the valve. Multiple-reaction monitor (MRM) chromatograms of triolein (m/z 903>604) and 3-13C-triolein (m/z 906>606) (monitoring the corresponding [triolein-NH4 +] and [3-13C-triolein-NH4 +] ions) were collected for 0.55 min. The analysis was formatted for 384-well plates, with each plate analyzed in 110 min (i.e., 17 s per sample, including cycle time). Two such LC/MS/MS detection systems were used for the HTS sample analysis. The chromatograms were processed using Quanlynx software, which divided the area of individual triolein peaks by the area of the internal standard 3-13C-triolein peaks. The resulting values were reported as the relative response for the corresponding sample.
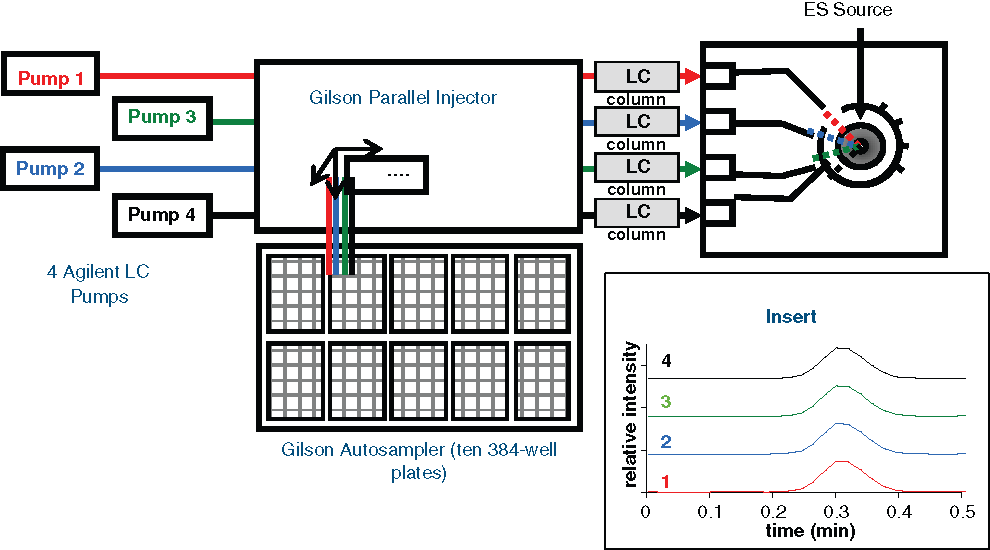
Schematic diagram for the MUX-LC/MS/MS system setup used in DGAT1 screening. The insert shows the multiple-reaction monitor chromatograms of product detected from each injection cycle.
Compound percent inhibition was calculated by the following formula: Inhibition % = 1 – [(Compound Response – Low Control Response)/(High Control Response – Low Control Response)] × 100%. The screening data were processed with the Novartis internal data analysis software XTS and also visualized by Spotfire™ (Somerville, MA). For the orthogonally pooled compound mixture, the primary hits at or above the designated hit inhibition cutoff values were deconvoluted in a similar fashion as described previously. 22
Results and Discussion
The DGAT activity has been determined routinely by measuring the triolein formation from the acylation of exogenous DAG with radiolabeled fatty acyl-CoA by TLC separation and scintillation counting. 17,18,21 The LC/MS-based DGAT assay described here is nonradioactive and label free, via direct measurement of triolein formation with LC/MS/MS detection using the MRM mode. MRM uses a triple quadrupole MS/MS instrument to selectively pass a selected parent ion (i.e., triolein + NH4, m/z 903) and detect a selected MS2 ion (m/z 604). The advantages of using MRM mode quantitation is the combination of the 2 selection events, conferring greater selectivity as well as high sensitivity due to improvement in signal-to-noise ratio. To apply this detection method for HTS, the throughput of the analysis has to increase significantly. Equally important, the assay needs to be optimized for reducing measurement variability and enhancing product detection sensitivity. We have explored several strategies, such as using parallel MUX-LC/MS/MS, stable isotopic internal standard, “in-plate” organic solvent extraction, and compound pooling mixtures, to increase the detection sensitivity, measurement accuracy, and throughput.
LC/MS-based DGAT1 assay development
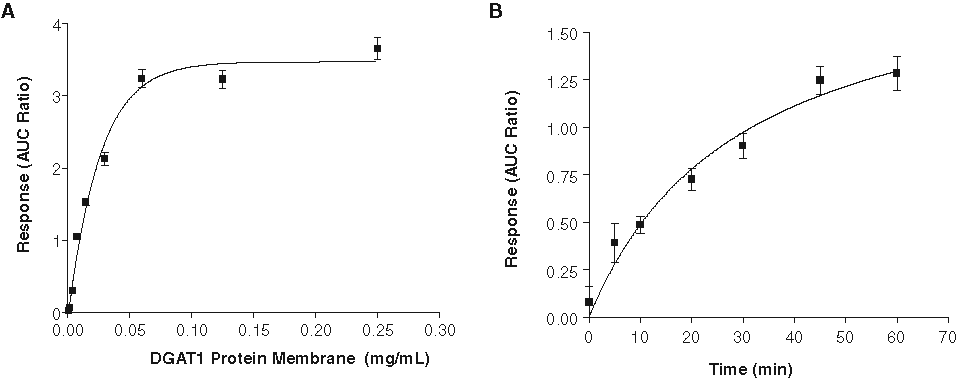
The enzymatic assay was optimized for both the reaction kinetics and facilitation of the LC/MS detection. First, suitable DGAT1 enzyme and substrates concentrations used in the assay were determined via titration. The selected substrate concentrations for diolein and oleoyl-CoA, 50 µM each, were in the vicinity of the apparent Km values determined experimentally (data not shown). The enzyme titration and reaction kinetics are shown in Figure 2 . From these experiments, the enzyme concentration and the assay reaction time were set at 25 µg/mL and 30 min, respectively, based on the linear range of the response curves. The hDGAT1 enzyme activity was quite tolerant to DMSO and ethanol and was not significantly affected by up to 10% DMSO or 20% ethanol (data not shown). However, the reaction was sensitive to acidic conditions, as 2% acetic acid would completely stop the reaction.
(
Reduction of assay data variation
With the originally adopted assay and detection protocol, the triolein measurement by LC/MS/MS showed wide data variation among replicate wells in an assay plate, with a coefficient of variation (CV) typically in the range of 20% to 30% for the full-reaction response signal (see
Fig. 3A
). Therefore, the data variation had to be reduced significantly before the assay could be used for screening. Realizing that there were several liquid handling steps involved in the assay, efforts had been focused on optimizing the process for enhancing the reproducibility of the measurement. Further tests showed that liquid dispensing, solvent extraction, and internal standard all affected the data variation. A comparison of the assay data variation before and after optimization is shown in
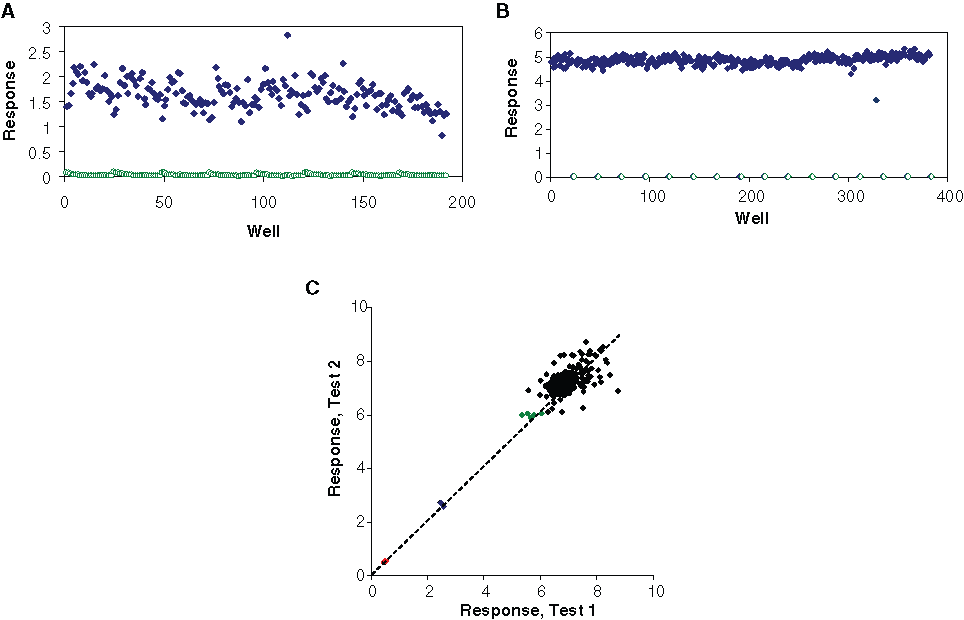
Assay data variation reduction and reproducibility test. Scatter plot of an assay plate data (
In-plate solvent extraction
The solvent extraction step was retained from the original protocol 17 to maintain the LC/MS detection sensitivity for triolein. The assay was first adapted to a deep-well plate format to perform an in-plate extraction process. By using the deep-well plate, the enzymatic reaction, solvent extraction, and direct sampling for LC/MS analysis were all performed on the same assay plate without any need for liquid transfer to new plates. This setup significantly simplified the assay logistics and reduced data variation caused by liquid transfer. Besides the process simplification, we also tested several organic solvents to optimize the extraction efficiency and reproducibility. Methanol, butanol, isopropanol, and pentanol were evaluated for this purpose. It was found that pentanol consistently gave better results in terms of extraction efficiency (yielded higher triolein signal) and consistency (lowered data variation) (data not shown), so pentanol was selected as the extraction solvent. In addition, several reaction stop solutions, including 0.5 M EDTA, 10% acetic acid, 5% sodium dodecyl sulfate (SDS), and 10% ammonium hydroxide, were also evaluated. Ten percent acetic acid (with a final concentration of ~2% in assay) had the best quenching effect to the reaction and did not interfere with the LC/MS detection. The lower quantitation limit of triolein in the finalized assay protocol with the MUX-LC/MS/MS detection was estimated to be around 0.2 µM, and the standard curve of triolein detection showed the response was linear to at least 10 µM in the current detection setting (data not shown).
Internal standard
The MRM chromatograms were processed using the ratio of the area of triolein peak by the area of the internal standard peak. The internal standard was typically premixed with substrate solution or reaction stop solution. We had originally used tripalmitin as the internal standard for triolein quantitation. However, tripalmitin was not ideal as an internal standard for triolein analysis due to their nonidentical chemical and physical properties. For example, triolein and tripalmitin would have different solvent extraction efficiency, different elution time from the LC column, and different ionization efficiency. These differences contributed to the data variation and also could cause problems in real HTS due to the possibility of compound interference to the detection of product or internal standard. To circumvent these drawbacks, we employed a stable isotope-labeled triolein (3-13C-triolein) as the new internal standard. With this internal standard, both triolein species (unlabeled 12C and 13C-labeled) were extracted, eluted, and detected in an essentially identical manner. It therefore improved the process uniformity ( Fig. 3B ) and reduced interferences from the co-eluting compounds, providing better quality screening data.
Assay validation for HTS
The IC50 value of a known DGAT1 inhibitor, LCD344, a pyrrolo(1,2-B)pyridazine derivative originally discovered at Tularik (San Francisco, CA), was determined to be in the range of 32 to 50 nM, which was comparable to values obtained by using the original assay protocol. 17 To evaluate the assay hit-finding capability and reproducibility, a plate with randomly spiked LCD344 at 3 concentrations (corresponding to ~90%, 50%, or 10% inhibition) was tested blindly in 2 separate runs. Figure 3C showed the result of this test. The result suggested that the assay was capable of identifying hits of a varied inhibition range with good reproducibility. To further evaluate the data variability and data uniformity, several plates with positive and negative control wells were tested. The CV in the positive control data was below 8%, and the assay quality statistic Z′ factors 24 for these plates were all above 0.7, indicating the assay data quality being excellent for screening. In addition, a pilot screening of a small subset of compounds (at 10 µM compound) also yielded similar Z′ values.
Screening singleton vs. mixture compounds with LC/MS-based assay
The throughput of an LC/MS-based assay has been a major technical hurdle in screening a large chemical library consisting of several hundred thousands to a million compounds in a reasonably short time (e.g., several weeks). One approach to increase the throughput of LC/MS analysis is via parallel analysis with multiple LC setups. Other improvements, including the use of an optimized and simplified assay procedure and screening logistics, can also enhance the throughput. With our current 4-way parallel MUX-LC/MS/MS detection at 17 s per sample (slightly less than 2 h per 384-well plate) in the DGAT1 assay, further enhancement of throughput is needed for large-scale screening. To achieve higher throughput for the LC/MS-based screening, we have employed the use of orthogonally pooled compound mixtures. 23 In this compound compression strategy, each compound in the orthogonally pooled plates is present twice in the pooled library, in 2 different mixture contexts (one by row and one by column). Therefore, compounds are tested essentially in duplicate, but the overall throughput in the case of 10 compounds per mixture is still 5-fold higher than testing compounds in singleton. The primary hits can then be deduced and identified by a self-deconvolution process, based on the compounds present in the 2 different active mixtures.
Figure 4 shows the scatter plots of DGAT1 screening data from a set of screening plates of both single compound (10 µM) and pooled mixture (10 compounds per mixture, 8 µM each compound). The slightly different compound concentrations used in this case (i.e., 10 µM vs. 8 µM) were mainly due to logistic consideration in compound addition. The scatter plot of the pooled mixture showed noticeably wider activity dispersion, and the mean activity was skewed slightly toward the inhibition side. This phenomenon was due to the so-called bystander effect of mixture (biological activity of a mixture affected by compound interaction, interference, or crowdedness in the mixture). Although the exact nature of this effect is not clear, it seems to be a common phenomenon, with severity of the effect varying in different assays. The pooled matrix strategy usually works well in screening with high-quality biochemical assays. 22 In this DGAT1 LC/MS screening, there was clearly an adequate activity window to identify hits from the pooled compound screening data ( Fig. 4B ). The use of the pooled mixtures also made LC/MS-based screening more cost-effective and efficient.
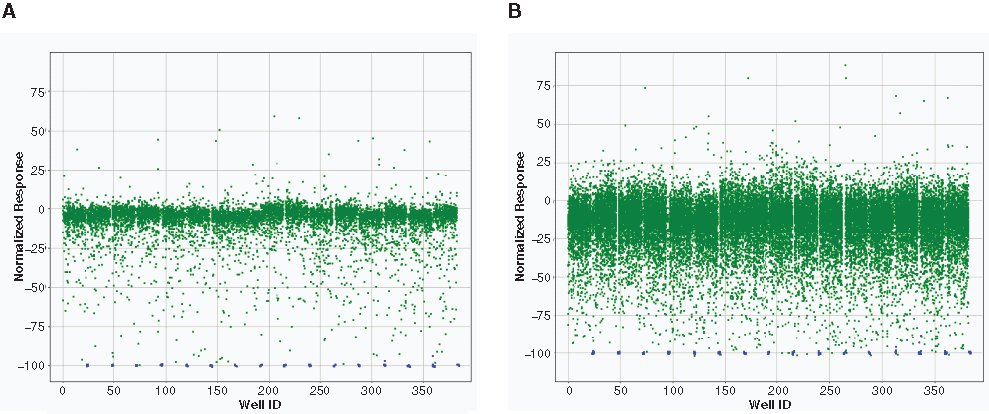
Scatter plots of DGAT1 primary screening data. The negative response values in this plot represent inhibition. Overlay of (
Results from DGAT1 inhibitor screening
A total of 773,000 compounds were tested in the primary screen in this LC/MS-based screening format, with 16,200 compounds tested in singleton (screening at 10 µM) and 756,800 compounds tested in pooled mixtures (screening at 8 µM for each compound). With 2 identical MUX-LC/MS/MS apparatus setups for sample analysis, the screening was completed in 8 weeks. The overall data quality of the screening was high, with a Z′ factor for the majority of assay plates in the 0.7 to 0.8 range. A very small number of plates with Z′ factors <0.5 were repeated.
From the primary screening, approximately 4600 primary active wells were identified with a hit limit cutoff set at 60% inhibition. After hit deconvolution and a triage process, which applied several in silico compound filters to eliminate compounds with less attractive structures or undesired properties, 2022 compounds were selected and retested in dose-response curves. In total, 1119 hits yielded reasonable dose-dependent inhibition curves and were subjected to further evaluation. The hit confirmation rate for this LC/MS-based screening was approximately 51%. Among these confirmed hits, 196 compounds (~17% of the confirmed hits) showed sub-micromolar potency (IC50 <1 µM). Figure 5 shows the dose-response curves from a few selected inhibitors identified and confirmed from this screening. The confirmed hits contained a variety of structural scaffold series, including chemotypes with both known (identified from a previous in-house DGAT1 screening with FlashPlate™ assay format) and novel structures (data not shown), indicating good hit-finding capability with the current LC/MS-based screening format.
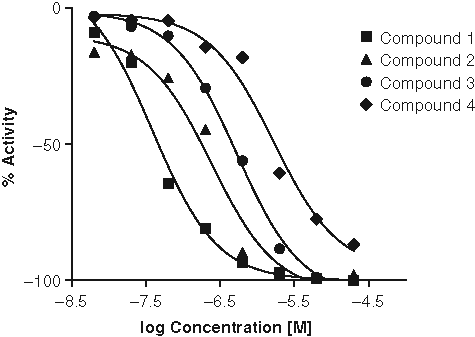
Dose-response curves of 4 representative example hits with different potencies from DGAT1 liquid chromatography/mass spectrometry screening. Negative activity values in this plot represent inhibition.
Through optimization of assay conditions and screening process, a high-quality LC/MS-based DGAT1 assay has been developed, and the assay procedure and logistics have been optimized and simplified. Furthermore, by combining parallel LC/MS/MS detection with the use of a orthogonally pooled compound mixture, this assay is apt for high-throughput mode and has been applied successfully in the DGAT1 inhibitor screening campaign with nearly 800,000 compounds. These results demonstrate the feasibility of using LC/MS-based biochemical assays for large-scale primary screening. This screening technology platform is particularly useful for biological targets for which the conventional HTS assays are difficult to implement.
Footnotes
Acknowledgements
We thank Stephen Weldon for providing the expression clone for DGAT1, Drs. Mary Ellen Digan and Debra Burdick for their input during the assay setup, and Meir Glick and Michael Serrano-Wu for hit triage.