
Abstract
High-content screening (HCS) is increasingly used in biomedical research generating multivariate, single-cell data sets. Before scoring a treatment, the complex data sets are processed (e.g., normalized, reduced to a lower dimensionality) to help extract valuable information. However, there has been no published comparison of the performance of these methods. This study comparatively evaluates unbiased approaches to reduce dimensionality as well as to summarize cell populations. To evaluate these different data-processing strategies, the prediction accuracies and the Z′ factors of control compounds of a HCS cell cycle data set were monitored. As expected, dimension reduction led to a lower degree of discrimination between control samples. A high degree of classification accuracy was achieved when the cell population was summarized on well level using percentile values. As a conclusion, the generic data analysis pipeline described here enables a systematic review of alternative strategies to analyze multiparametric results from biological systems.
Introduction
H
Nevertheless, there are many examples in the literature demonstrating the benefits of a multiparametric analysis of HCS data. For example, the validation rate of hits determined using a support vector machine (SVM) was higher than using a standard analysis, 10 or a compound’s target could be predicted based on a phenotypic profile. 11 It was also shown that by integrating phenotypic profiles obtained by HCS with chemical similarity, mode of action (MoA) could be inferred. 12 Hence, the routine use of multivariate methods promises to add value to screening campaigns by higher reliability of hit prediction and detailed description of the cellular response.
Before different treatments can be compared, the (single-cell) data have to be preprocessed to obtain a parameter set describing the response at the well level. To enable the routine use of sophisticated data mining in screening, several analysis pipelines recently have been described. 13,14 These workflows, however, are often tailored to a specific type of assay. 13
Steps in a generic data analysis pipeline may include correction for experimental biases, transformation/normalization of image readout values, dimension reduction methods, and eventually summarizing the cell population on a well level. 15 The purpose of this process is to generate a multivariate assessment of the sample treatment at a well level that is then used in the following hit analysis. Whether to use control compounds in this process is a fundamental methodical decision. So-called supervised methods draw on control samples. For example, supervised feature selection reduces the set of parameters to a smaller subset that is sufficient to differentiate these control samples. However, control samples may not be available or may even include undesired phenotypic effects. Furthermore, the available controls might not capture all effects that can be monitored by the assay, and thus unanticipated phenotypes could be missed. Therefore, this study focuses on unsupervised data-processing methods (i.e., methods that do not use control compounds) to obtain a well-level description. Nevertheless, supervised methods are important to evaluate the quality of the well-level description as usually done for high-throughput screening (HTS) using the Z′ factor.
One step in the data analysis pipeline occurring before applying multivariate methods is value transformation. Different parameters may display different activity distributions (e.g., fluorescent intensity values often tend to be right tailed). Many of the statistical tools used for the analysis of biological results assume that the data points have a normal distribution (e.g., the Z′ factor). 16 Comparing readouts with different distribution characteristics using multivariate methods is questionable. This issue was addressed in recent HCS reports by using Box-Cox transformation. 17,18 However, it has not been assessed whether such an automated transformation is at all beneficial for such multivariate analysis.
An unbiased approach allowing for the discovery of unexpected phenotypes calls for the retention of as many parameters as possible. Among these, there are often redundant (i.e., highly correlated) parameters that can presumably be removed without significant loss of information. A noncorrelated, reduced set of parameters can be beneficial in subsequent analyses and for interpreting these results. Unbiased methods for dimension reduction usually rely on parameter correlation. Among these, factor analysis has been shown to derive a biologically meaningful set of parameters. 12 Alternatively, principal component analysis (PCA) has been used. 18 No comparative review of these techniques has been reported, and their impact on the information content has not been assessed.
A crucial step is how best to summarize the cellular population on a well basis to compare different treatments. Often, the basic approach of computing one characteristic value (i.e., mean or median) for all cells in a well is used. However, additional characteristics such as the value variation or percentile values can add information on the cellular population in the particular well. Alternatively, the Kolmogorov-Smirnoff (KS) statistic has been used to compare the value distribution of each parameter in a treated well to an untreated population. 4,19,20 Hence, a range of possibilities on how to aggregate the single-cell information on a well level exists that may capture different aspects of the biological effects being monitored.
Consequently, there are various decisions to be made on which data analysis approaches to choose. Screeners are left with open questions as whether to apply dimension reduction or how to best summarize a cellular population in a well. There has been no extensive review and comparison of the different methods of data analysis for routine use in HCS. This article addresses this issue by describing a generic data analysis pipeline that extends from the output of the image analysis to a quantitative characterization of each well. Using this framework, HCS data can be processed using alternative approaches at each step.
Using a HCS data set monitoring cell cycle events, 3 dimension reduction methods relying on parameter correlation (i.e., factor analysis, successive parameter elimination, and parameter selection based on clustering) were evaluated against the unreduced data set. The effect of using Box-Cox transformation prior to factor analysis was assessed. Moreover, summarizing the cell population in a well using the well median, percentile values, a parametric description, or the KS statistic was also compared. Thus, the multiparametric description generated by this data-processing method was created with unsupervised methods only. However, the quality of these descriptors was evaluated using the control samples with linear discriminant analysis (LDA). Here, samples treated with 1 of 5 positive control compounds (camptothecin, curcumin, etoposide, ionomycin, and nocodazole) were compared to untreated samples. Hence, different strategies for the analysis of an HCS data set using multiple analysis steps were evaluated, concluding on how to best set up an unbiased data analysis strategy for a multiparametric HCS data set.
Materials and Methods
Data set
The data set studied here was generated from an assay monitoring the cell cycle phases using 3 nuclear stains and was described previously. 12 Hoechst was used to identify the nuclei. Within the nuclear area, phosphorylated histone (pH3) was detected by antibody staining. In addition, cells were treated with labeled uridine (EdU), which is incorporated into the DNA during its synthesis, enabling DNA replication to be monitored. Based on these 3 stains (Hoechst, pH3, EdU), the image analysis (Cellomics BioApplication, Morphology.V2; Cellomics, Pittsburgh, PA) generated 29 image readouts for each single cell.
Cells were treated with 5 compounds (positive controls) that affect the cell cycle: camptothecin, curcumin, etoposide, ionomycin, and nocodazole. For evaluation purposes, the ability to discriminate wells treated with these compounds from untreated wells (i.e., DMSO only) was assessed. In total, 208 replicate samples for ionomycin and DMSO and 104 replicate samples for other positive controls distributed on 26 plates were available. Moreover, 9152 samples were treated with compounds from an internal compound library. Random samples of single-cell data from the whole data set (controls and compound treatments) were used to establish the transformation and dimension reduction methods (as described below).
Data processing and analysis
As reagent amounts could be influenced by pipetting errors or evaporation effects, parameters directly related to these quantities (i.e., total and average stain intensities) were corrected for systematic errors. Well-to-well variations were modeled for each plate separately using the median polish method based on well median values for each different image readout. Plate-to-plate variation was corrected by normalizing the wells on each plate to the median of all wells on the respective plate. The correction model and values for normalization were determined based on well medians and were applied to the single-cell data.
The parameter for the Box-Cox transformation was estimated using a 1% random sample of single-cell data from the whole data set (approx. 60,000 single cells). For parameters that contained negative values, all values were shifted by a constant value such that 99% of the sampled single cells had values above 0.001. A few cells that still had a negative value for a parameter after this shift were neglected from further analysis, as negative values cannot be processed by a Box-Cox transformation.
The factor analysis was calculated based on a 1% random sample of single-cell data from the whole data set (approx. 60,000 cells). Robust estimates of the correlation matrix (orthogonal quadrant correlation estimator 21 ) were used, and the model was subsequently applied to the single-cell data. For the correlation elimination, an iterative procedure was used. In each step, a robust estimate of the correlation matrix (orthogonal quadrant correlation estimator) was calculated, and the image readout pair with the highest correlation was determined. For these 2 image readouts, the sum of all correlation coefficients to all other readouts in the current set was determined. The readout having the higher sum was eliminated. The iteration was stopped at the desired number of remaining dimensions.
Wells were summarized using 4 different approaches. First, only the well median for each parameter was calculated for each well. Second, percentile values of each image readout for which 5%, 25%, 50%, 72%, and 95% of the cells in the well have lower values were determined. Third, to describe the value distribution using a parametric description, the mean, standard deviation, skewness, and kurtosis were calculated for each image readout. Fourth, the KS statistic for each parameter was determined by comparing the cells in the particular well to cells pooled from all DMSO samples. While for the well median and the KS statistic, the well-level description has the same dimensionality (i.e., 29) as the description of a single cell, 5 and 4 times as many parameters describe a well for the percentile and parametric well summary methods, respectively.
Fisher’s LDA was trained on the well-level data. To discriminate samples treated with a positive control compound from untreated samples (negative controls), 10-fold cross-validation runs were performed 100 times. Hence, mean values and the standard deviation for both classification accuracies and Z′ factors were determined from 1000 trained classifiers. For calculating the Z′ factor, the distances of each control sample to the respective separating hyperplane were used. 22
For the parameter clustering, the Spearman correlation matrix was determined, and their absolute values were used as a similarity measure. A hierarchical clustering of the parameters was determined using Ward’s method to determine linkages. For both nontransformed and transformed data, a similarity threshold of 0.7 resulted in 10 groups of parameters. From each of these groups, 1 parameter was manually selected to represent each cluster in further analysis.
All data manipulations and analyses were performed with R (2.9.2) on a dual-core processor (1.8 GHz, 4 GB memory) using the additional packages geoR and rrcov for Box-Cox transformation and robust estimates of the correlation matrix for the dimension reduction, respectively. The package e1071 was used for LDA. For well correction, the median polish algorithm in the package stats was applied. All packages were retrieved from http://cran.r-project.com.
Results
Processing overview
The generic data preprocessing pipeline, described here, consists of (1) a correction step, (2) distribution transformation, (3) parameter correlation–based dimension reduction, and (4) cell-to-well aggregation ( Fig. 1 ). Thus, a description that summarizes the phenotype of the cells present in each well is obtained that can then be subjected to further analysis (e.g., clustering or hit identification). At each stage, alternative methods can be used, or a step even can be left out. Displaying heat maps for each parameter helped to decide whether median polish or local regression should be applied to correct for evaporation effects, for example. 23 The dimension reduction and transformation were performed on single-cell data to assess parameter correlation and distributions as independently as possible of a particular well summary or compound treatment.
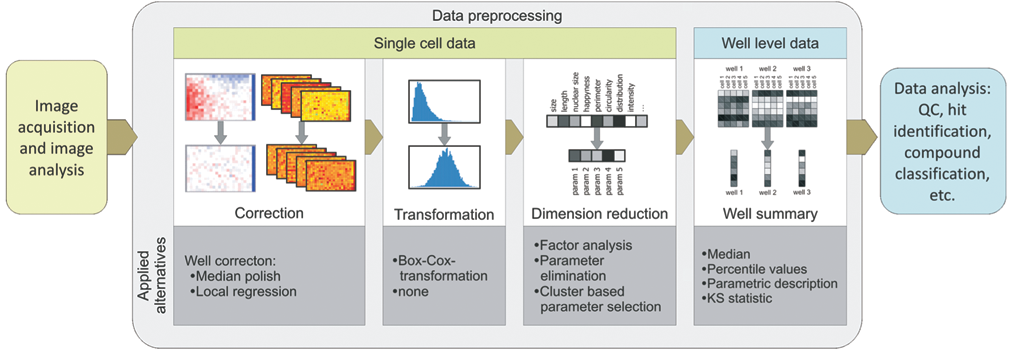
Overview of the data preprocessing pipeline. The data preprocessing consists of (1) correction for plate pattern and plate effects (using either local regression or median polish, based on normalization to the whole plate median or the median of the negative controls), (2) transformation (i.e., Box-Cox transformation), (3) dimension reduction (i.e., factor analysis or correlation elimination [successively eliminating 1 parameter of the pair with the highest correlation until a certain threshold—either number of remaining dimensions or maximal desired correlation]), and (4) well summary (i.e., median, percentiles [values for which 5%, 25%, 50%, 75%, and 95% of the population have a lower value], parametric description [i.e., mean, standard deviation, kurtosis, skewness], and Kolmogorov-Smirnoff [KS] statistic [comparing cell population in a respective well to all DMSO cells of the respective plate]). QC, quality control.
Assessing the discrimination ability of different data analysis methods
Although data processing does not rely on control samples, the discrimination between positive controls and untreated controls was used to evaluate the quality of the data after alternative processing setups. A straightforward way to judge whether negative and positive control wells can be distinguished from each other is to train a classifier on a training set and evaluate its performance to predict the correct control affiliation in a test set (i.e., perform cross-validation). Here, the classifier used is LDA, which determines an “optimal” separating hyperplane between treated and untreated control samples. The classification accuracy (ranging from 50% [random] to 100% [perfect]) of 10-fold cross-validation was used to evaluate to which extent positive and negative controls are separated.
The classification accuracy can thus be used to score and rank cases that range between random and perfect separation. For 2 cases, where the controls are perfectly separated, the gap between the control groups can differ in magnitude. Then, the classification accuracy, which is 100% in both cases, does not discern the different separation window sizes. In screening, (univariate) assays are usually optimized toward reaching such a high classification accuracy. The most common measure of assay quality, the Z′ factor, assesses the separation width between negative and positive control wells for a single readout. 16 Analogously to this univariate case, the distances of control samples to the separating hyperplane can be used for a Z′ factor calculation in a multivariate assay. 22
Figure 2 compares Z′ factors and classification accuracies for the example data set using different preprocessing configurations. Indeed, the Z′ factors are in the positive range (corresponding to an existing separation gap) when the prediction accuracy is nearly 100%. For not completely separable cases, the Z′ factor and the classification accuracy are correlated. To be able to compare cases for which the classification accuracy is approaching 100%, we used the Z′ factor.
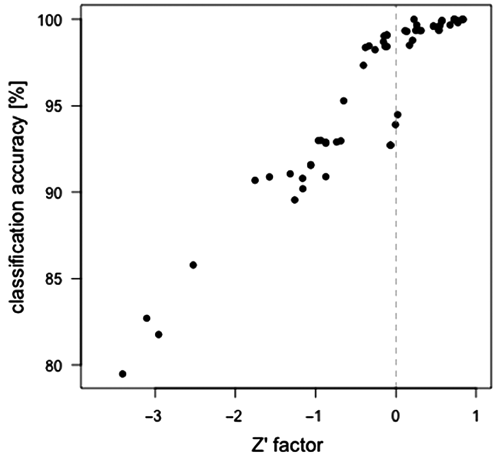
Correlation of classification accuracy and Z′ factor. The separation of different positive controls from untreated wells was evaluated for the example data set after alternative preprocessing setups.
Comparison of dimension reduction methods
Two automatic approaches to reduce the dimensionality based on parameter correlations in comparison to the unreduced data set were evaluated. First, factor analysis seeks to model the variance observed in a data set by latent factors that are a weighted sum of multiple correlated parameters. 24 Second, for the method described here as the correlation elimination method, 1 parameter in the pair with the highest correlation to an existing parameter was successively eliminated (see Materials and Methods).
For both dimension reduction methods, a criterion is needed to decide on the final number of dimensions. For factor analysis, the Kaiser criterion suggests using as many factors as there are eigenvalues of the covariance matrix larger than 1. Alternatively, the fraction of the variance that is covered by a certain number of factors can be used as a cutoff criterion. For the correlation elimination, a threshold can be set as follows: parameters with the highest correlation coefficients are eliminated until the current highest correlation is lower than a selected limit (see
Control samples that were treated with curcumin and etoposide were not completely distinguishable from untreated samples as indicated by classification accuracies smaller than 100% ( Fig. 3A ). For the other controls (i.e., camptothecin, ionomycin, and nocodazole), the classification accuracies were very close to 100%, and therefore Z′ factors were compared, as described earlier ( Fig. 3B ).
(
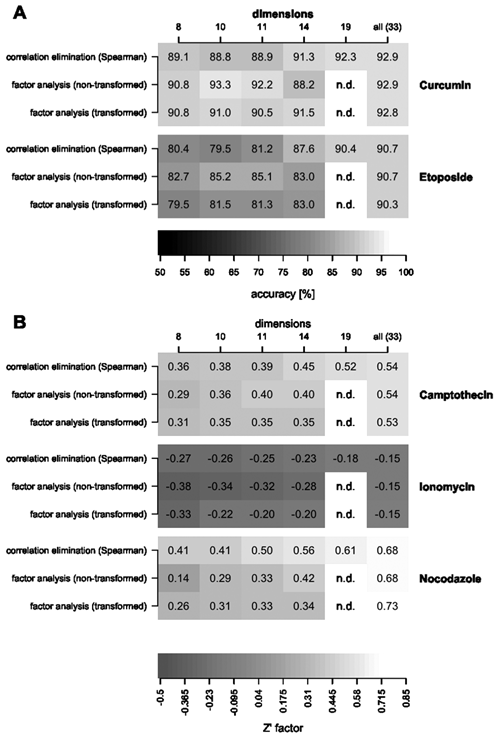
All dimension reduction methods that were tested led to lower discrimination ability between untreated and treated control wells compared to the unreduced data (
Fig. 3
). For the correlation elimination, the separation of negative and positive controls tends to decrease significantly when using 14 or fewer parameters, which corresponds to the maximal remaining correlation of approximately 0.7 (
The underlying reason for decreased performance of the factor-reduced data set was investigated using nocodazole as an example. For this control, the Z′ factor clearly decreases with decreasing number of factors. The weights of the LDA for the correlation elimination–reduced data set at 8 dimensions indicates that “SkewIntenCh1,” a measure of the intensity distribution skewness of the nuclear staining, is an important parameter for detecting the phenotype produced by nocodazole treatment ( Fig. 4 ). This particular parameter is not highly weighted in any of the new parameters calculated by factor analysis and thus is almost eliminated.
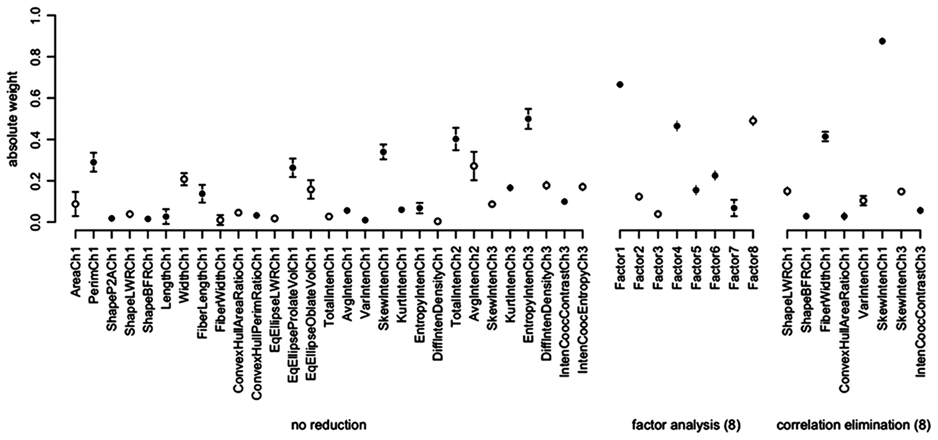
Weights of parameters for linear discriminant analysis (LDA) to separate samples treated with nocodazole from untreated samples. Open and closed circles indicate negative and positive weight, respectively. Error bars display the standard deviation across 100 tenfold cross-validation runs.
Factor analysis assumes a normal distribution of the readout values. Therefore, the effect of the Box-Cox transformation that seeks to obtain normally distributed values was assessed. When comparing transformed versus nontransformed data sets, lower classification accuracies for the transformed data were observed. However, for nocodazole and, to lesser extent, ionomycin, the Z′ factors of factor-reduced data were higher with the transformation when compared to nontransformed data. Hence, the data transformation could be beneficial for factor analysis (see discussion in
Although dimension reduction leads to lower discrimination abilities, the weights of the classifiers are less variable for lower dimensions. Figure 4 displays the weights and their variability for the unreduced data in comparison to the data reduced to 8 factors. Similar results were observed for dimension reduction using the correlation elimination.
For the correlation elimination, it is an open question which correlation threshold is suitable to terminate the elimination process. Figure 5 displays the classification accuracies for the maximal remaining correlation coefficients in the elimination process. The classification accuracy decreases remarkably in particular for etoposide below 0.65. At this step, the image readout reporting on the kurtosis of the nuclear stain intensity is eliminated.
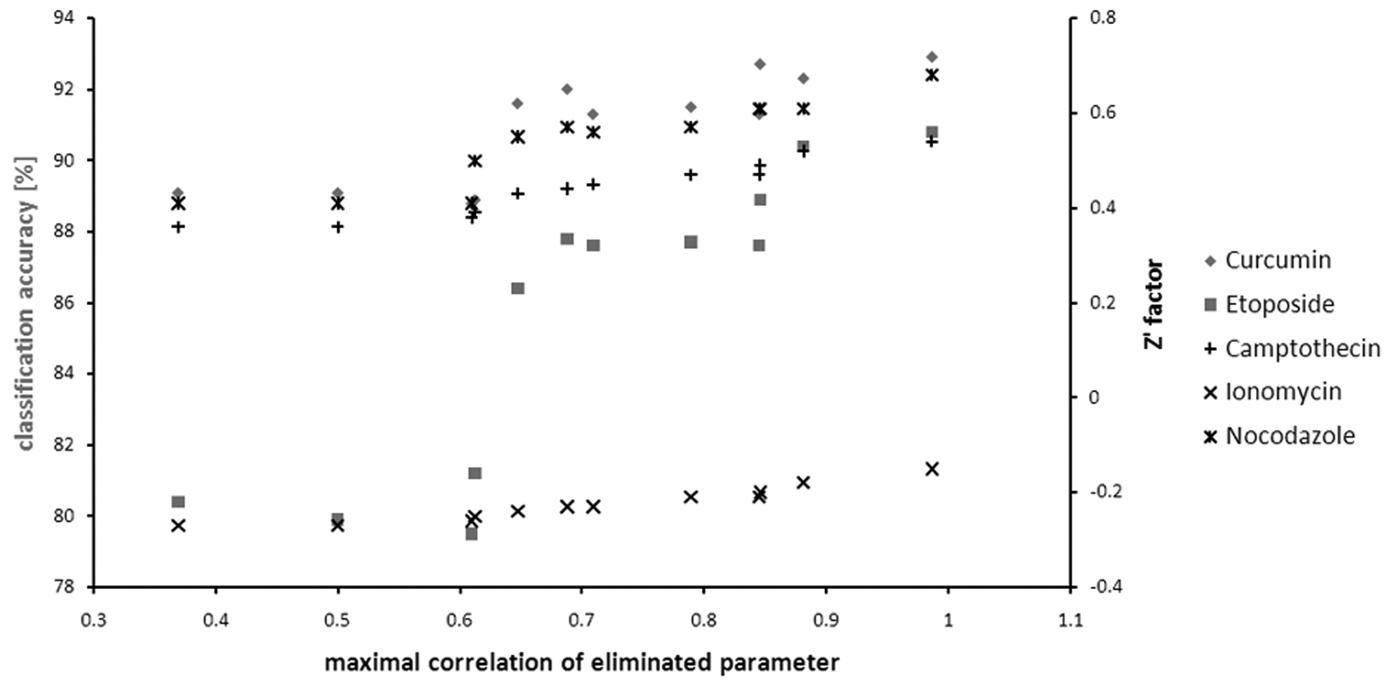
Discrimination ability after successive elimination of parameters with highest remaining correlation coefficients. Either the classification accuracy (curcumin and etoposide) or the Z′ factor (camptothecin, ionomycin, and nocodazole) is displayed depending on whether or not the respective control is perfectly discriminated.
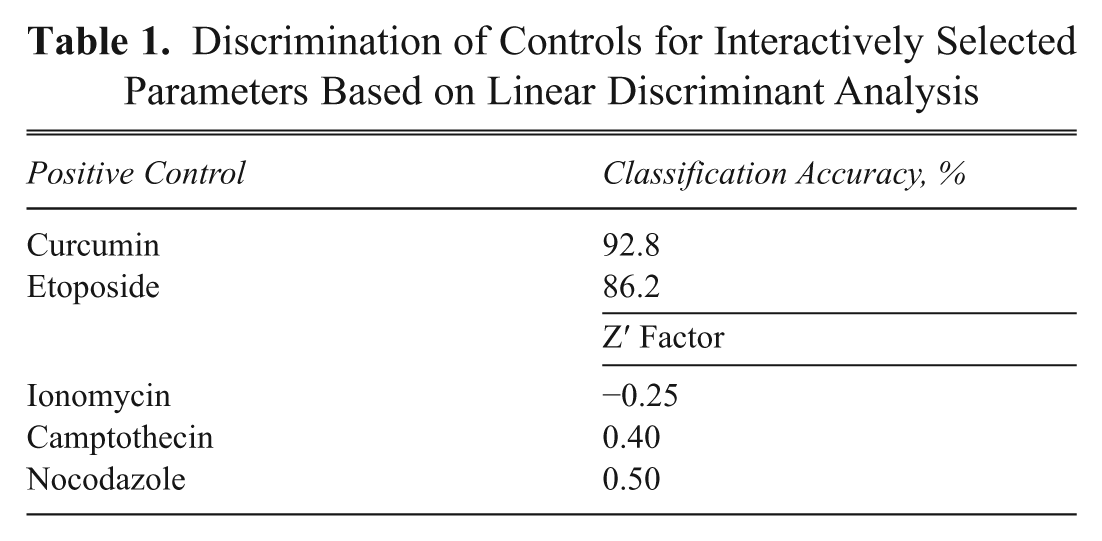
The finding that the degree of control discrimination is not significantly decreased when eliminating parameters with a correlation coefficient above a certain threshold can be used for an interactive selection strategy of parameters to retain. For this, parameters were hierarchically clustered based on their correlation. From this clustering, 10 groups were defined within which the parameters shared correlation coefficients of 0.75 or higher. From each group, 1 parameter was manually selected ( Fig. 6 ). This manual selection performed better than the set of 10 parameters determined by the automatic, correlation-based parameter elimination or a set of 10 parameters derived by factor analysis ( Table 1 ). For example, for the nontransformed data, the classification accuracies for etoposide and curcumin are 92.8% and 86.6% compared to 88.8% and 79.5% for the automatic correlation elimination to 10 parameters.
Discrimination of Controls for Interactively Selected Parameters Based on Linear Discriminant Analysis
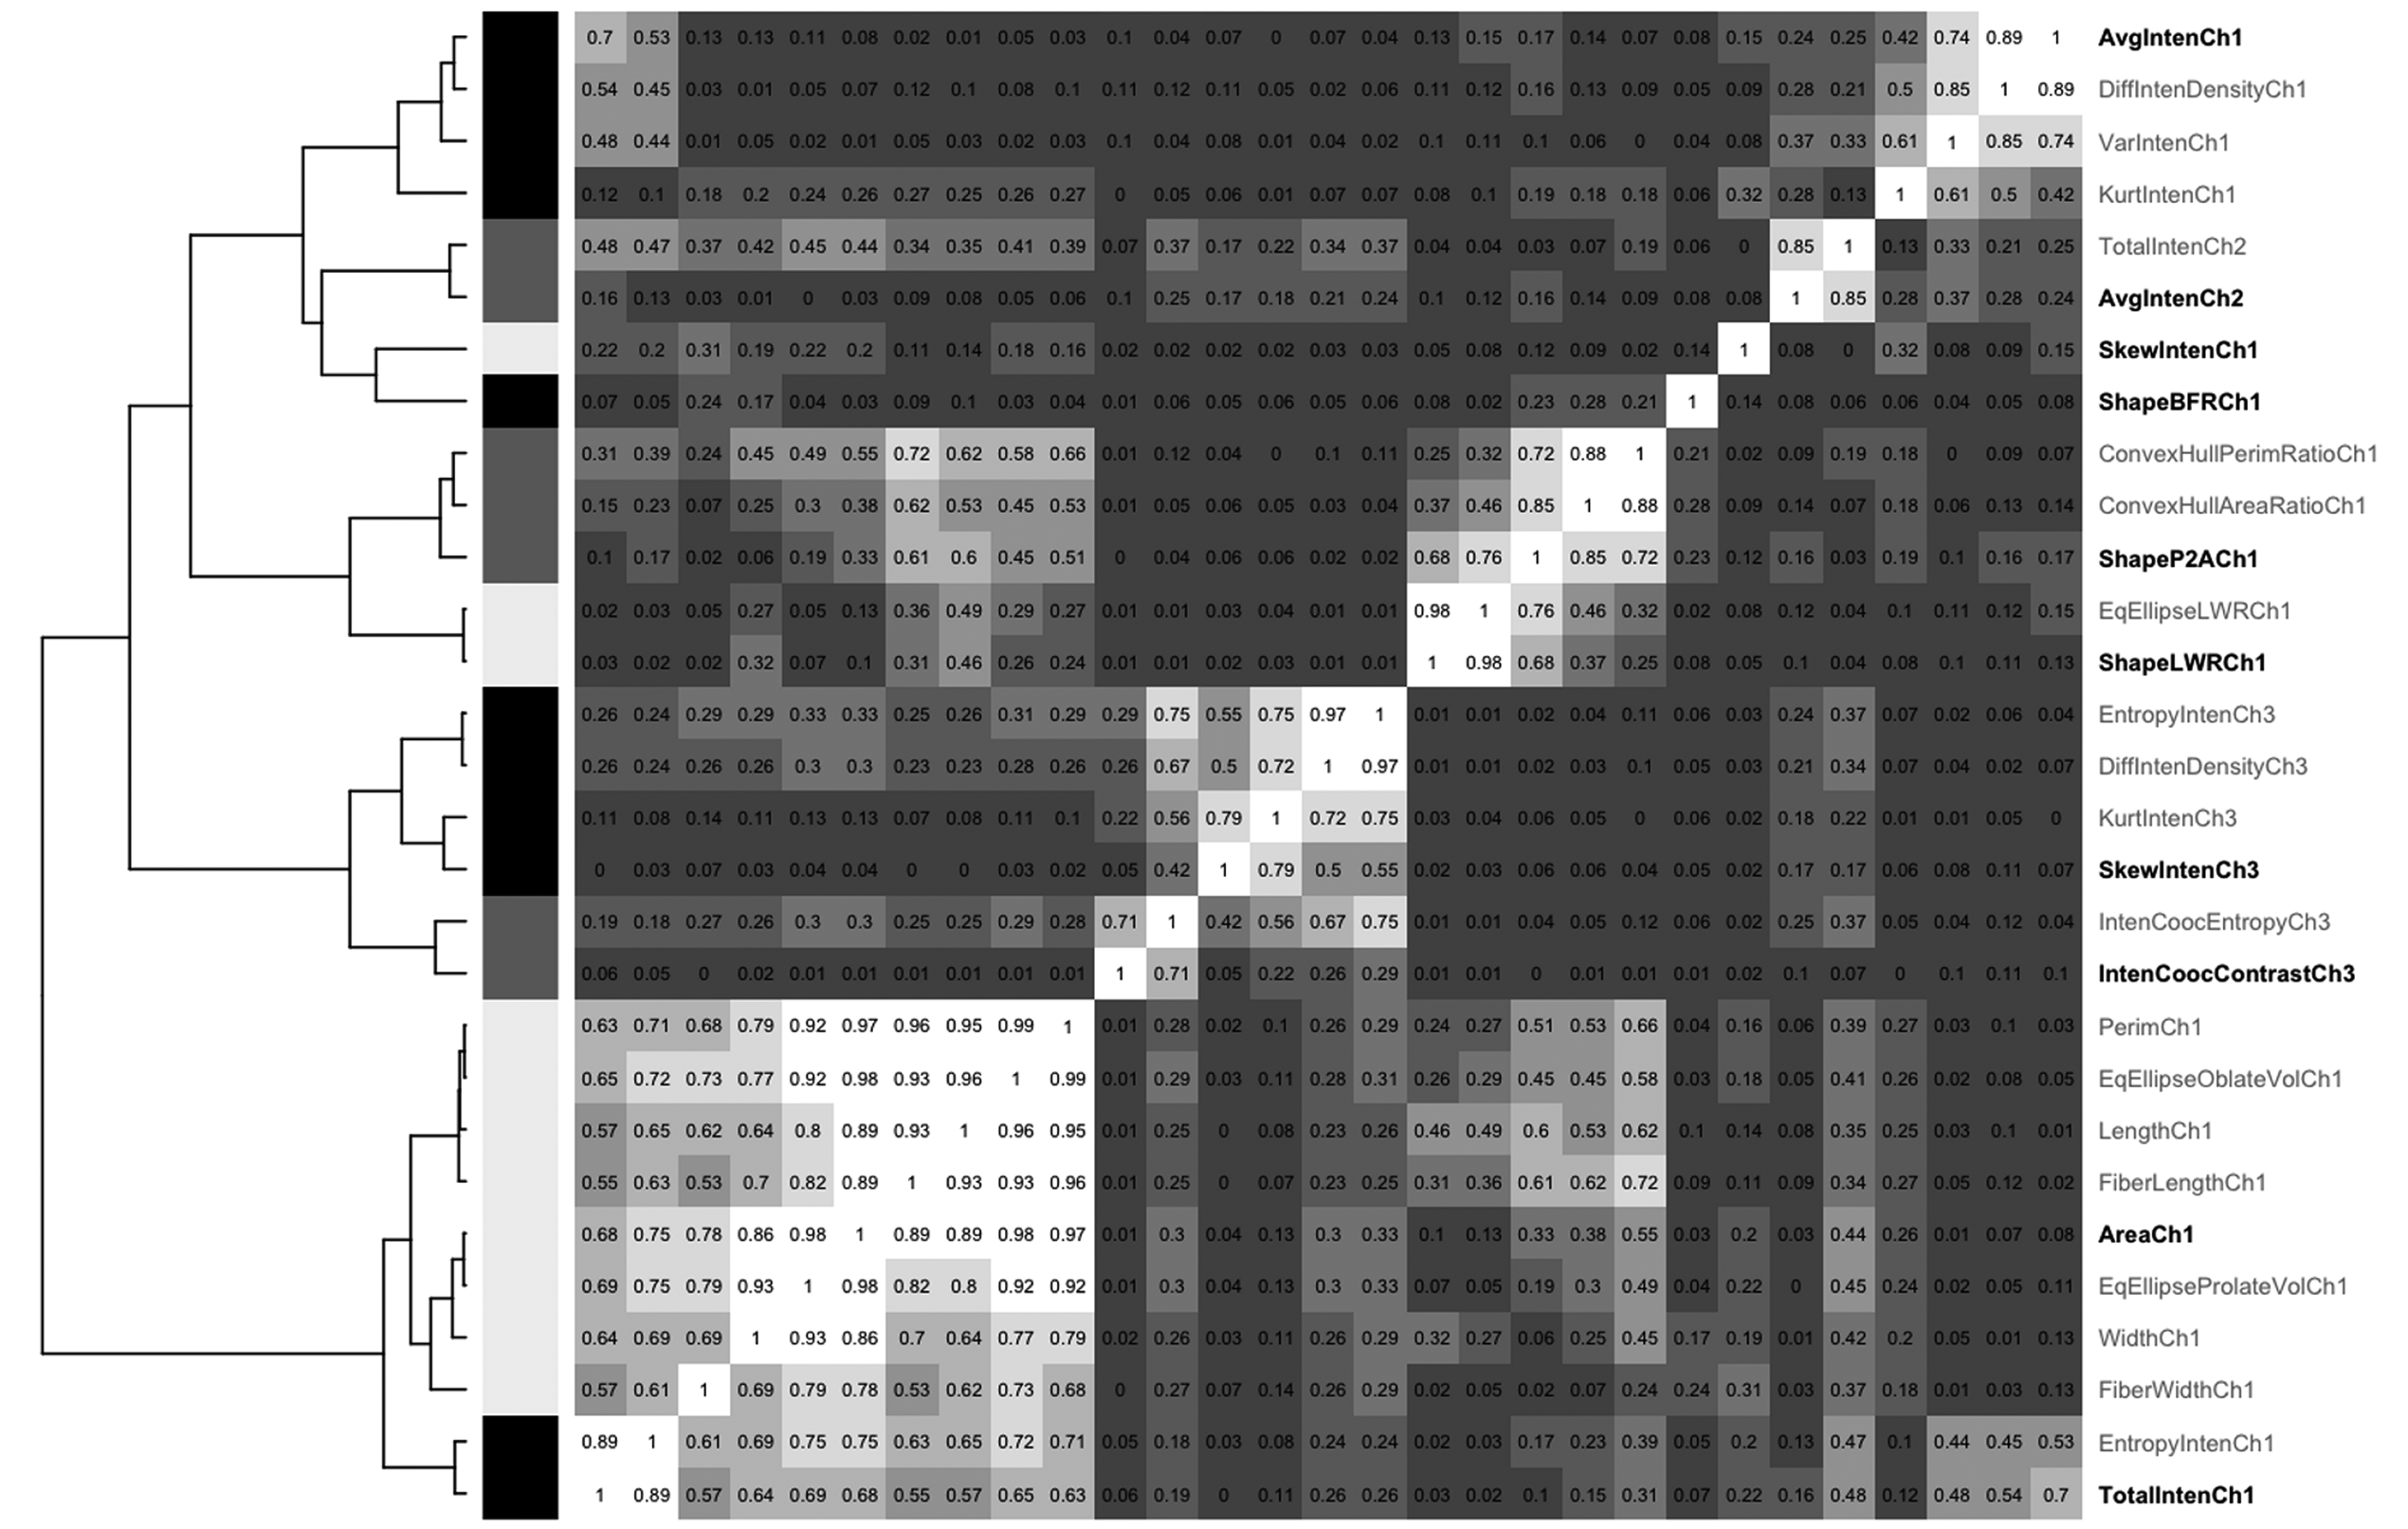
Clustering of parameters based on their clustering. Based on hierarchical clustering (dendrogram on the left) and their correlation coefficient (values in the heatmap matrix). the parameters are grouped as indicated by the black/grey/white bars left of the matrix. From each group one parameter was manually selected (highlighted on the right-hand side).
In summary, for the data set analyzed in this report, the interactive approach (manual selection assisted by clustering) to reduce the dimensions maintains the information content to a large extent, and it has the advantage that the user has control over the selected set of parameters. Thus, this approach assists the biologist in selecting parameters that are intuitively meaningful and retaining the available information to a large extent. Therefore, we prefer this approach. Factor analysis might be an alternative, but one has to accept that some information is lost. For example, in the case of nocodazole, an important parameter was effectively neglected. Likewise, PCA gives similar results to factor analysis (as would be expected) because these techniques are closely related (data not shown). Applying transformation prior to factor analysis can lead to a better presentation of the latent factors but does not necessarily result in better control discrimination.
Comparison of well summary approaches
The simplest way to summarize a well population is by one characteristic value; in this report, the median has been used so far. Obviously, this approach will not detect all changes. For example, if only a small subpopulation with a parameter value higher than the main population shifts to even higher values, the median will remain the same. To better reflect the distribution of parameter values within a well, percentile values (here: 5%, 25%, 50%, 75%, and 95%) or parameters to describe the shape of the distribution (here: mean, standard deviation, kurtosis, and skewness) can be used. Another approach is the KS statistic, which compares the population of each well with a reference (untreated) population.
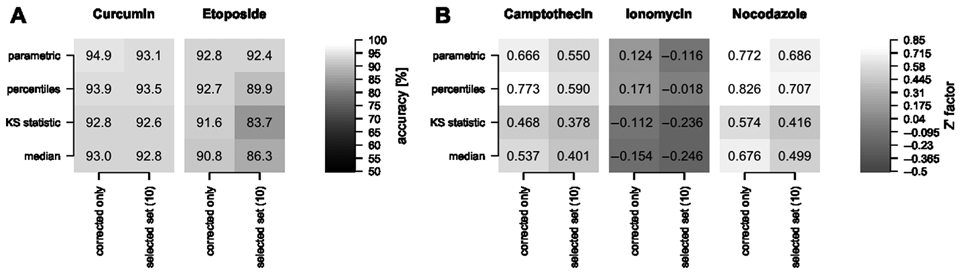
In terms of classification accuracy, the well median and the KS statistic perform very similarly ( Fig. 7A ). Using 5 percentile values or the parametric summary to describe the cell population in a well leads to better discrimination when used to train an LDA classifier. The cell population in a well is in these cases described by a larger number of parameters, and thus more parameters are available based on which controls can be distinguished. For example, using only the well median, the total intensity of phosphorylated histone 3 staining did not contribute to the discrimination of ionomycin-treated controls. However, the 75% percentile value for this intensity has the highest absolute weight (i.e., importance for discrimination) when using percentile values of the interactively selected parameters. In this example, the Z′ factor increased from –0.246 to –0.018. The biological interpretation of this behavior, however, is not obvious. Hence, a drawback of the percentile approach, as well as the parametric summary, can be that comprehension of the results may be nonintuitive.
(
Discussion
This report describes a modular data-processing pipeline for the analysis of multiparametric data sets. To evaluate a number of different data-processing strategies, the discrimination of control compounds was used, as is usually done in HTS or HCS for quality control, by using the Z′ factor. In particular, the pipeline has been used to evaluate the respective impact of data transformation, dimension reduction, and well summary approaches to a cell cycle data set.
The automated Box-Cox transformation did not generally lead to an improvement of the discrimination of control samples. One example for a positive effect was an improved discrimination of nocodazole-treated samples using factor-reduced data. To manipulate the data only as much as necessary, we do not recommend using Box-Cox transformation for routine and automatic application.
To reduce the number of parameters, factor analysis has the advantage that the set of factors generated combines the image readouts in biologically meaningful sets. For example, the first factor is related to nuclear size because it is a combination of image readouts, such as nuclear area, length, and width (
To gain high classification accuracies with LDA, the dimension reduction is not necessary but yields more stable results with respect to parameter weights. Thus, dimension reduction can be helpful to better understand the data as there are fewer parameters to look at and the reported importance of the parameters for discrimination (i.e., the weights) is more reliable.
Comparing alternative ways to summarize the cellular population of each well, the KS statistic and the well median perform equally well for this data set. Two reports in the literature assessed topoisomerase inhibition and mitotic arrest of known control compounds based on a KS statistic calculated based on the DNA intensity labeling. 19,20 There was, however, no comparison whether in those cases the median value would have been inferior. From the work reported here, the KS statistic does not seem to be, per se, a better method to assess effects on DNA staining.
In contrast, a percentile summary is able to better capture the differences in populations treated with control compounds, and it often outperforms the parametric summary. Moreover, parameters such as standard deviation and kurtosis might not be suitable to properly describe populations that heavily deviate from normal behavior (e.g., multimodal distributions). The generated set of well-level parameters can again be correlated, and a second dimension reduction step may be applied (see
This article focuses on unbiased and, as far as possible, automatic processing steps for transformation, dimensions reduction, and well summary. For reducing the number of parameters describing the cell images, supervised methods have been used and reviewed in the literature. 10,25,26 Such methods select parameters based on whether a given set of control samples can be classified correctly. This limits the use of these methods to cases for which control samples are available and when one seeks to identify compounds exactly leading to the same phenotype as displayed in the positive controls. A supervised approach to a well summary is to classify the cells into predefined subpopulations. A number of software packages have been developed that enable screeners to manually select cells from acquired images to define subpopulations of cells. 27-30 It has been shown that this is very useful for screens where known subpopulations are monitored. 31 A drawback of supervised methods is that unanticipated and novel phenotypes might be lost. Supplement 1 (gives in example where 2 parameters that are selected in order to discriminate nocodazole-treated samples are not able to sufficiently capture the effect of ionomycin and vice versa.)
The data analysis pipeline described here can be used as a rational framework for data processing. Analogous to experimental assay development, it allows alternative data-processing and analysis steps to be tested and compared. It is also conceivable to change the order of some steps in the pipeline. In the setup depicted here, the well summary comes at the end of the process so that dimension reduction from the single-cell readouts can be used to capture their characteristics as far as possible. However, if a well median summary is sufficient to be used for phenotype characterization, there is no need to process single-cell data but well-level data. This would mean that the well summary needs to be the first step in the pipeline.
The conclusions drawn in this work are valid for the analyzed data set only. In particular, which well-level descriptors generated from the single-cell data are most suitable is very much dependent on the biology. For example, a cell population can behave uniformly or can comprise subpopulations that have distinct behaviors. Although an average value could be sufficient in the first case, a more detailed description of the subpopulations is necessary in the latter. Some of the observations made here on dimension reduction methods presumably present general trends. For example, dimension reduction based on parameter correlation only always should result in a lower ability to discriminate control samples because of the loss of information. In this work, a correlation threshold of 0.7 appeared to be suitable to limit the information loss, but this threshold might need to be adjusted for other data sets. A general advantage of the interactive selection is that the users select parameters by themselves, which can raise the acceptance and interpretability of the results.
To facilitate the application of multivariate data analysis and introduce the findings presented here into a productive screening environment, an in-house Web tool was implemented. The tool provides correction of well and plate experimental errors. The parameters are clustered to facilitate the interactive selection of a parameter set based on which subsequent hit identification tasks are performed. Although the data manipulation itself is performed using R, the process handling, visualization, and user interaction are based on a combination of Perl and Oracle. The modular design provides both high flexibility and extensibility as well as extensive user interaction where necessary. Expert users can implement alternative processing modules, and the rigid framework of the Web tool, with its predefined user interactions, enables the application for nonexpert users during ongoing screening campaigns.
HCS is able to monitor diverse processes in 1 assay, such that different biological effects can be discriminated by generating a multiparametric data set. The 5 control compounds used in the data set and analyzed in this report have diverse effects on the cell cycle. This results in different parameter weights for discriminating the respective control compound responses from untreated samples. For example, although the area of the nucleus is important for camptothecin discrimination, the skewness of the pixel intensity distribution of the DNA staining can be used to distinguish nocodazole. These observations match the expected biological effect (see
Footnotes
Acknowledgements
The authors acknowledge Yan Feng for providing the data set and Nicolas Fay for helpful discussions. The NIBR Education Office funds the postdoctoral fellowship of A.K.
References
Supplementary Material
Please find the following supplemental material available below.
For Open Access articles published under a Creative Commons License, all supplemental material carries the same license as the article it is associated with.
For non-Open Access articles published, all supplemental material carries a non-exclusive license, and permission requests for re-use of supplemental material or any part of supplemental material shall be sent directly to the copyright owner as specified in the copyright notice associated with the article.