
Abstract
Background:
Angiogenesis and regenerative wound healing rely on the promotion of distinct endothelial cell phenotypes exhibiting increased migratory capacity. Monitoring of these hallmark events in vitro is invaluable for discovering novel therapeutics. However, respective methods often lack a high-throughput character or accurate analysis tools, which are essential for effective screening suitability.
Methods and results:
We stained nuclei of confluent human umbilical vein endothelial cells with Hoechst33342 prior to induction of an artificial scratch wound. Treatments with various growth factors and several concentrations of nintedanib were performed to microscopically evaluate impacts on wound closure. We developed 2 tools for automated analysis of wound closure image sets. Utilizing cell-free area measuring or cellular density evaluation, respectively, migration behavior was assessed well-wise for each time point. We identified pro-migratory effects of interleukin 1β as well as inhibitory actions of nintedanib. Hoechst33342 staining allowed for cell counting which was excluded as a contributing factor to wound closure in our assay.
Conclusion:
We developed a cost-effective, high-throughput pipeline for monitoring cell migration in vitro. We believe that our protocol will accelerate pre-clinical screenings not only for medications targeting endothelial wound closure but also drug discovery research in a broad range of diseases involving cellular migration.
Keywords
Introduction
Many pathological and physiological processes largely depend on cellular migration.1-6 Highlighting the importance of endothelial cell (EC) migration, angiogenesis, involving differentiation of a selected ECs to a migrating tip cells guided for example, by vascular endothelial growth factor (VEGF)7,8 and followed by proliferating and migrating stalk cells, 9 is indispensable for successful development of functional organs, reperfusion of infarcted areas, but also cancer growth.10-12 Apart from angiogenesis, migratory behavior of ECs has been observed in wound healing processes, for example, after injury of the endothelial wall of blood vessels.13,14
Scratch wound assays are a cost-effective method to assess migratory behavior of cells in vitro and have been established for many cell types over the past decades facilitating frequent use in biomedical research.15-17 Cells are cultured in multi-well plates, which have been coated with extracellular matrix components beforehand to enhance migration, 14 until a confluent monolayer is achieved. Subsequently, an artificial scratch wound is introduced, for instance by scratching with a pipette tip, and wound closure is monitored microscopically over time. 14 Alternatively, culture-insert systems, for example, from ibidi®, can be utilized in which removal of the insert simulates wound induction. While these systems may be gentler to the cells and enhance reproducibility of the wounding process, they are more expensive and scalability is limited.
Such assays rarely generate manageable datasets suitable for manual analysis. For example, drug screening approaches usually comprise a multitude of candidates that need to be evaluated, thus requiring expeditious automated analysis methods. Over the recent years, different automated tools have been developed for commercially available softwares or freewares such as ImageJ/Fiji. 18 While some of these algorithms allow for analysis of migratory behavior of single cells, for example, the Chemotaxis tool for ImageJ, 19 others rather focus on quantification of collective migration by tracing leading edges of the monolayer. Suarez-Arnedo et al 20 recently published an easy-to-use ImageJ plugin that can be used for automatic assessment of wound healing assay images. They utilized pixel-to-pixel variance analysis coupled with hole filling to segment the image into occupied and cell-free areas. Output measurements allow for quantification of migration based on wound area or average wound width. In contrast, Bobadilla et al 21 applied GrowCut algorithm to delineate leading edges in images and propose a different analysis method called “monolayer edge velocimetry.” Here, the leading edge is further segmented into smaller windows in which the movement speed of the edge is quantified individually.
In general, one major drawback of in vitro scratch assay protocols is the incapability of distinguishing the influence of proliferative and migratory behavior on wound closure.22,23 Therefore, mostly combined effects are considered or proliferation has to be assessed in a separate assay.
In this report, we attempted to generate a user-friendly protocol for assessment of migratory behavior of endothelial cells cultured in vitro. To account for the proliferative factor, we labeled cell nuclei with Hoechst33342 enabling cell counting. A high-throughput character was achieved by combining a 96-well cell culture plate format with automated microscopy. We provide 2 alternative approaches, an ImageJ macro and a python-based application, for expeditious analysis of the acquired images and compare those to the earlier described ImageJ plugin.
Methods and Algorithms
General cell culture
Human umbilical vein endothelial cells (HUVECs, Lonza, Basel, Switzerland) were cultivated at 37°C and 5% CO2 in EBM™-2 Basal Medium (Lonza) supplemented with Hydrocortisone, hFGF-B, VEGF, R3-IGF-1, Ascorbic Acid, hEGF, and GA-1000, all from EGM™-2 SingleQuots™ Supplement Pack (Lonza) as well as 10% fetal bovine serum (FBS, Thermo Fisher Scientific, Waltham, MA, USA). Medium was regularly exchanged and cells were passaged weekly. In brief, medium was aspirated and cells were washed with Dulbecco’s phosphate buffered saline (PBS, Invitrogen, Waltham, MA, USA). Subsequently, 0.05% Trypsin-EDTA solution (Invitrogen) was used to detach adherent cells for 5 minutes. Cells were spun down for 5 minutes at 4°C and 300° × g and resuspended in fresh culture medium. Counting of cell concentration was performed with Countess II (Thermo Fisher Scientific) and 300 000 cells per flask were seeded for maintenance culture in T75 flasks (Sarstedt, Nümbrecht, Germany).
Migration assay
HUVECs were seeded at a density of 30 000 cells per well in a 96-well plate (TPP, Trasadingen, Switzerland) that had been coated a priori with 0.1% gelatin solution (Sigma-Aldrich, St. Louis, MO, USA) for 30 minutes at 37°C. After 24 hours, HUVECs were stained with 5 μM Hoechst33342 (Thermo Fisher Scientific) at 37°C for 20 minutes. Immediately afterward, scratches were introduced to the cell layer using a 20 µL pipette tip (Sarstedt). Scraped-off cells were washed away with PBS and 100 µL culture medium or starvation medium with treatments or respective controls were added. Subsequently, cellular migration was imaged for 24 hours at 37°C and 5% CO2 using a Cytation1 with Gen5 (BioTek, Winooski, VT, USA). Background in images was subtracted with Gen5 selecting a rolling ball radius of 40. To ease automatization of analysis, image files contained well name, imaging channel, and time point.
Treatment of cells
HUVECs were either kept in culture medium as control or treated with EBM™-2 Basal Medium supplemented with 0.1% FBS and 1% PenStrep (Gibco). Following concentrations of treatments or respective controls were applied: 10 ng/mL transforming growth factor beta (TGF-β, R&D Systems, Minneapolis, MN, USA) dissolved in 0.1% bovine serum albumin (BSA, Sigma-Aldrich) in 4 mM HCl, 10 ng/mL interleukin 1 beta (IL-1β, PeproTech, Cranbury, NJ, USA), 25 ng/mL VEGF (R&D Systems) both dissolved in 0.1% BSA in PBS, 3 µg/mL polyinosinic:polycytidylic acid (polyI:C, Sigma-Aldrich) dissolved in PBS. Media containing cytokines as described above were applied 24 hours before scratch wound infliction and during image acquisition. Nintedanib (Selleckchem, Planegg, Germany) treatment was applied either alone or in combination with growth factors following the wound infliction. Here, 1× CellTox™ Green Dye (Promega, Madison, WI, USA) was added to label necrotic cells.
Image analysis using Wound Healing Size Tool
Images were analyzed with the “Wound Healing Size Tool” by Suarez-Arnedo et al. 20 To expedite the analysis, images were stacked and the stack analysis mode of the plugin was utilized with following parameters: variance window radius, 20; threshold value, 50; percentage of saturated pixels, 0.3; set scale global, “yes”; scratch is diagonal, “yes.”
Migration Assay Analysis Macro
For automated quantification of wound closure in acquired images sets with Fiji (v1.52p or higher), we developed a macro combining several image modification steps with intensity plot assessment for wound identification. For adjustment of settings for image analysis, a user interface was created (Figure S1A).
Next to a username and an experiment title, user is asked to set the following 6 parameters image analysis. Selection of the wound orientation determines whether images are rotated at the beginning. Background intensity and minimal cell size are used to selectively exclude signals in the image that are below these thresholds. Wound detection accuracy inversely proportionally determines the height of the rectangles drawn to generate the intensity plots over the image width. This parameter should be adjusted proportionally to the cell density. Initially detected wound borders are subjected to a correction for putative outliers, the stringency of which can be adjusted with the maximal deviation angle. Optionally, a Gaussian blur step can be added to the image processing by inputting a number that is used to set the radius. This function is opted out by default but should be considered if images show high background noise. The last 2 checkboxes encircled in red (Figure S1A) determine whether images are either analyzed individually or well-wise. If image names contain well and time point identifiers, which are clearly distinguishable by a separator, image names can be disassembled accordingly and identifiers can be assigned. Additionally, if the dataset contains more than one image channel, the user is also asked to specify the channel in which wounds should be detected (Figure S1B). In case of more than one imaged channel, it is also possible to subtract a second channel from the analyzed one to avoid false positive signal detection. Lastly, specification of the starting time point of a sequence is necessary; the rest is analyzed according to default array sorting by Fiji.
Per well, scratch wounds are initially determined in the image of the selected reference time point. In our Fiji pipeline, the image is first rotated to orient the scratch wound vertically and cropped in height to avoid errors caused by artefacts at image borders. Background signals are subtracted using a rolling ball radius of twice the “minimal cell size”-input and brightness and contrast of the image are adjusted (saturated pixels = 0.35). To reduce data size, the image is converted into an 8-bit format. If defined in the user interface, Gaussian blur with the given sigma radius is applied, enhancing the effectiveness of the following pixel-to-pixel variance assessment step. Here, comparable to the Wound Healing Size Tool, 20 Fiji’s variance filter function is applied using a radius based on the “minimal cell size”-input to achieve an image contrasting high pixel intensities in the cell layer versus low pixel intensities in the cell-free wound (Figure S2A). In the processed image, a rectangle with a respective height is drawn from the top left to right image border (Figure S2B). The profile plot of this rectangle is then screened for edges indicating potential wound borders where intensity drops over the input background threshold are tagged as left and subsequent intensity rises as appurtenant right borders. If the pixel distance from the right border of one pair to the left border of the following pair is smaller than the defined “minimal cell size,” the values are excluded creating a new pair consisting of the left border of pair one and the right border of the following pair. The border pair with the maximal left to right distance is then selected for wound outline. This process is repeated with the next image spanning rectangle starting at the bottom of the previous one until the whole height of the image is covered. All preliminarily determined left and right border coordinates are screened for outliers. To set a threshold, X-coordinates of left and right borders are sorted in arrays and the respective median values are returned, from or to which a tolerance value T is subtracted or added, respectively. T for image k is calculated according to equation (1) with h being the height of image k in pixels and α being the angle in degree of the maximal deviation specified in the user interface.

In case outliers have been identified, new borders are searched at respective spots between tolerance thresholds. Eventually, the scratch wound is outlined and the area is measured. Along the timeline, wound borders identified in the previous image are used as boundaries for respective rectangles for edge identification based on the assumption that wounds will not enlarge over time. However, to cope with smaller local expansions of the cell-free area which might occur as a result of single cell motion, a deviation factor based on “minimal cell size” and “accuracy” parameters is added. In case of individual assessment, images are handled as described above for the reference time point.
Finally, a text file containing the input parameters as well as the calculated wound areas organized well-wise in a comma separated matrix is created and saved to the same directory as chosen for the analyzed images.
For the analysis of our image dataset, we used following parameters: background, 50; minimal cell size, 20; accuracy, 8; deviation angle, 20; additional blur, 0. We enabled timeline-based correction of wound areas. If included, CellTox™ Green Dye signals were subtracted from analyzed images.
Relative areas covered (RAC) of well i at time point j were calculated form the acquired wound area measurements A according to equation (2) with Ai0 being the wound area of well i at the initial time point.

Image analysis using Python application
We developed a python-based application for automated cell migration analysis. The program utilizes the open-source frameworks open-cv and NumPy for image analysis and data processing. It integrated into a graphical user interface (GUI) using the tkinter library (Figure S3A). Tracked in real time in the preview window, users can easily adjust relevant parameters for optimal scratch detection.
The workflow of the application encompasses 3 primary modules: data import, scratch-detection, and migration calculation (Table S1 and Figure S3). The program automatically discerns the number of timelines and the corresponding number of images within each timeline in the selected working folder. To ensure consistency, the images are then cropped to match the dimensions of the smallest image in each timeline. To correct for uneven illumination, a top hat transformation is applied, mathematically defined as
Instead of measuring distances or areas between wound borders, calculation of migration progress is based on the cellular density within the gap. As such, the second module of the analysis pipeline is responsible for determining the position of the initial scratch for each timeline. The module starts by converting the greyscale image into a binary image through the application of a threshold by Otsu’s method. This effectively separates the cells from the background and enables the subsequent dilation operation. The outcome is an enlargement of the cells, consequently leading to reduced intercellular gaps. To ensure complete closure of these cell spaces, a smoothing operation is implemented, utilizing an appropriate kernel size and averaging technique. Following a final thresholding step, the Suzuki contour finding algorithm is employed to identify the largest contour. In order to counteract the artificial shrinkage of the initial wound caused by previous image processing steps, we have added a linear scaling function. The resulting contour is subsequently used to generate a binary mask, where the initial scratch is white (ones) and cell layers black (zeros).
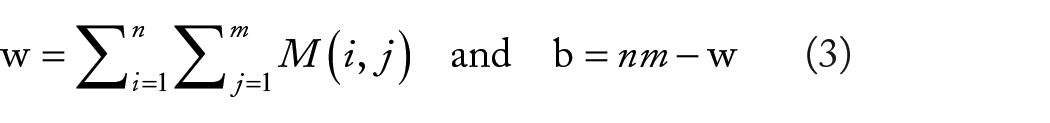
In the final module of the pipeline, all images within the series are employed to calculate the migration progress. Initially, the starting wound area w and background area b are computed according to equation (3) with
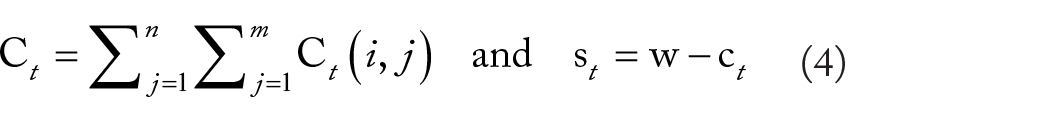
Subsequently, on each image in the time series, the threshold algorithm is once again applied specifically within the region of the wound. The resulting segmented areas correspond to cells that have already migrated into the wound. With the defined binary masks of the migrated cells
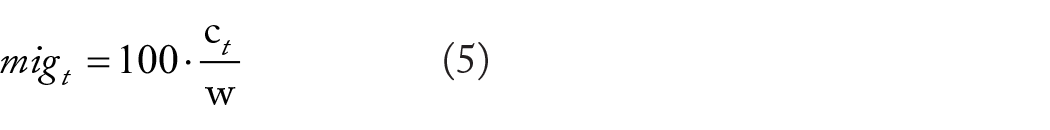
Finally, the absolute migration progress mig is defined as the ratio of the area occupied by migrated cells in the scratch to the initial scratch area, calculated as a percentage using equation (5).
However, it is difficult to estimate the true rate of migration progress based on this ratio, since 100% would mean that the whole scratch is populated with cells, without any intercellular space. To address this limitation, we have implemented a linear correction step based on the background cell density. The corrected value is determined using equation (6), where bd represents the background cell density at time point zero.

The computed migration value table is saved as a comma-separated text file. Additionally, for visualization and as a control, the first images of each timeline are saved in the output folder, with the calculated initial scratch area appropriately highlighted.
Furthermore, a save and load option of the settings is implemented, which simplifies transferability to different datasets. For demonstration purposes, it is also possible to generate a gif animation, which visualizes the workflow and the calculated wound healing progress.
Cell counting
We utilized the CellProfiler 24 image analysis platform to count cells in the acquired images. The pipeline consisted of the IdentifyPrimaryObjects module with diameter restrictions of 8 pixels to 40 pixels and default thresholding parameters. Identified objects outside the diameter range or those touching image borders were excluded.
Statistics
Statistical analysis was done with R (version 4.2.2). Data are presented as means ± 95% confidence intervals (CIs). Shapiro-Wilk test was consulted to verify normal distribution and Levene test was applied to evaluate homoscedasticity. Two-way analysis of variance with post hoc Dunnett-corrected multiple comparisons to respective controls was chosen to analyze the generated datasets. Statistical significances (P ⩽ .05) and are plotted above respective comparisons. All experiments were performed with n = 3 biological replicates with 3 to 4 technical replicates each.
Results
Generation of a comprehensive image dataset
To evaluate wound closure detection accuracy of the different tools, we generated a dataset containing 216 sequences (18 conditions, n = 3) of 13 images by introduced known pro- and anti-migratory conditions to HUVEC cultures. We utilized VEGF, a frequently used factor to trigger angiogenic activity of endothelial cells,25,26 TGF-β, shown to modulate migratory activity of several cell types,27,28 and putatively pro-angiogenic IL-1β.29-31 To assess whether effects of IL-1β were mediated via triggered pro-inflammatory pathways, we also included polyI:C, a viral double-stranded RNA analog activating toll-like receptor 3 (TLR3). To block migration, we kept HUVECs in starvation medium and again introduced previously described cytokines to screen for potential rescue effects. Of the resulting 216 image sequences, 3 had to be excluded due to experimental errors prior to analysis.
Fiji Wound Healing Size Tool
First, we analyzed obtained images with the previously described Wound Healing Size Tool. 20 We observed an accurate detection in the earlier stages of wound healing when the left and right layers in wells were fully separated by the cell-free area. However, with partial wound closure the algorithm was unable to detect the entire wound but rather chose the biggest cohesive cell-free area (Figure 1a), which was also represented by high 95% CIs in RAC graphs (Figure 1b and c). The analysis suggested only IL-1β as a potential migration promoting factor as cells exposed to either IL-1β in combination with TGF-β or VEGF showed faster wound closure (Figure 1b and c). HUVECs exposed to IL-1β alone or a mixture of all assessed growth factors (GFs) also showed a tendency toward higher migratory capacity (P = .0910 and P = .0954, respectively). However, the missing statistical confirmation of pro-migratory action of IL-1β alone might ensue from the high deviation within the control and IL-1β datasets caused by the incomplete wound detection. Expectedly, HUVEC migration was significantly reduced under starvation conditions. IL-1β rescued HUVEC migration partly when applied either alone or in combination with other GFs (Figure 1b and c). We utilized a CellProfiler pipeline to count Hoechst33342-labeled nuclei in the images and counts were normalized to the respective first image of the time sequence (Figure S4). We observed no increase in cell counts over time in any condition indicating that the contribution of cellular proliferation to wound closure can be neglected in our assay.

Analysis of migration images with Wound Healing Size Tool: (a) representative images of human umbilical vein endothelial cells 0 and 12 hours after scratch wound induction analyzed with the Wound Healing Size Tool. Identified wounds are demarcated in red. Filled arrowheads indicate wound parts that have not been recognized by the algorithm. Scale, 500 µm. (b) Graphs show relative areas covered (RAC) calculated according to equation (2) over time in growth medium (top panel) and starvation medium conditions (bottom panel). Colored dashed lines demarcate upper and lower limits of respective 95% CIs. (c) Area under curve (AUC) calculated from respective graphs in (b).
Fiji Migration Assay Analysis Macro
Our Migration Assay Analysis Macro pipeline should be able to circumvent the issue of incomplete wound area detection. Partially closed wounds were successfully identified throughout the full image span (Figure 2a). While the Wound Healing Size Tool includes a hole-filling step deleting any singularized particles of a certain size from the image, our tool evaluates the intensity and width of such objects and draws the wound border accordingly. The advantage here is that single cells within or migrating into the wound are also accounted for (arrows) while a disadvantage is a higher risk for false positive identification (filled arrowheads). In this analysis, RAC curves had much smoother courses and 95% CIs were smaller (Figure 2b and c). Therefore, migration influencing conditions that have been identified in the previous analysis could not only be confirmed with a higher confidence, but also IL-1β and the mixture of all tested GFs now showed statistically significant impacts on HUVEC migration.

Analysis of migration images with Migration Assay Analysis Macro: (a) Representative images of human umbilical vein endothelial cells 0 and 12 hours after scratch wound induction analyzed with the Migration Assay Analysis Macro. Identified wounds are demarcated in red. Filled arrowheads point out falsely identified objects within the wound area. In contrast, arrowhead outlines highlight correctly excluded particles. Arrows show single cells migrated into wound area and not being excluded by the algorithm. Scale bar, 500 µm. (b) Graphs show relative areas covered (RAC) calculated according to equation (2) over time in growth medium (top panel) and starvation medium conditions (bottom panel). Colored dashed lines demarcate upper and lower limits of respective 95% CIs. (c) Area under curve (AUC) calculated from respective graphs in (b).
Python Scratch-Assay-Tool
We demonstrated the usability of our GUI on our image dataset, first analyzing cellular migration without background scaling (Figure 3d and e). In the resulting curves (Figure 3d), we noticed that cellular density within the scratch wound in growth medium receiving HUVECs slightly declined after reaching the maximum. This might be due to the fact that staining intensity slightly declines over time as it is also partly reflected in the decrease in cell counts (Figure S4). Nevertheless, we could reproduce the results from the Fiji Migration Assay Analysis Macro in cells kept in growth medium as significant increase in HUVEC migration under IL-1β exposure was observed. However, while both of the other tools identified the same effects of IL-1β in the starvation medium conditions, cellular densities within the wound scratch apparently did not differ among the investigated groups.

Analysis of migration images with the python pipeline. (a and c) Graphs show cellular density over time in growth medium (top panels) and starvation medium conditions (bottom panels) in the identified scratch wound relative to confluent remote cell layer calculated as described in the methods section either without (a) or with scaling (c) according to equation (6). Colored dashed lines demarcate upper and lower limits of respective 95% CIs. (b and d) Area under curve (AUC) calculated from respective graphs in (a and c).
Applying background scaling corrected for the decline in cellular density for later time points (Figure 3f). In contrast to results reported for analyses excluding background scaling, effects of IL-1β were significant solely when applied in combination with TGF-β. Interestingly, unlike analysis of the unscaled data from starved HUVECs, scaling lead to statistical significance of impacts of IL-1β on HUVEC migration when administered in combination with other GFs but not alone (Figure 3g).
Nintedanib reduces HUVEC migration
To validate our models for drug screening purposes, we treated HUVECs with the receptor tyrosine kinase inhibitor nintedanib, which is used to combat idiopathic pulmonary fibrosis. 32 The direct inhibition of various GF receptors, including VEGFR, leads to reduced endothelial cell proliferation and angiogenesis. 33 Applying our high throughput approach, we could identify a significant reduction of HUVEC migration upon exposure to 0.6 µM nintedanib or higher (Figure 4a and b). Interestingly, simultaneous application of the previously used GF cocktail doubled the calculated EC50. Comparable results were achieved upon analysis of images with our second tool using either unscaled (Figure 4c and d) or scaled (Figure 4e and f) approaches. Scaling significantly reduced the variance of data within groups enabling a more robust detection of active concentrations in this experimental design. The highest applied concentration of nintedanib (15 µM) led to excessive cell death (Figure S5), which is also represented in the aberrant migration curves and high 95% CIs (Figure 4).

Nintedanib reduces endothelial cell migration. (a, c, e) Graphs show relative areas covered (RAC) or cell density in wounds over time in scratch assays with human umbilical vein endothelial cells treated with nintedanib in different concentrations with or without growth factors (GFs). Colored dotted lines demarcate upper and lower limits of respective 95% CIs. Analysis was performed with Migration Assay Analysis Macro (a) and the python pipeline either without (c) or with scaling (e). (b, d, f) Area under curve (AUC) calculated from respective RAC or cell density graphs in dependence of the applied nintedanib concentration. Dashed and dotted lines represent respective control means and 95% CIs. Solid lines show fitted 4-parameter logistic model.
Discussion
Influence of various GFs and nintedanib on HUVEC migration
The observed influence of IL-1β on HUVECs is comparable to previously published results in different cell types. As such, exposure to IL-1β has been shown to stimulate migratory behavior of corneal endothelial cells in a scratch wound healing assay via induction of fibroblast growth factor 2.34,35 Apart from two dimensional migration, IL-1β has been reported to also enhance trans-well migration in murine 36 and human 37 mesenchymal stem cells, various human peripheral blood leukocytes 37 and rat cortical neurons. 38 Considering a missing effect of polyI:C on HUVEC migration, it is likely that the pro-migratory effect of IL-1β is not mediated via downstream pathways shared by IL-1 receptor 1 and TLR3. Concordantly, lipopolysaccharide (LPS) and polyI:C exerted differential effects on mouse primary microglia migration which was accredited to discrepancies in treatment-elicited cytokine expression involving IL-1β and IL-6. 39
Even though being widely used to enhance endothelial cell migration in wound healing assays,40-42 we could not see an effect of VEGF. Cultivation of HUVECs over longer time in growth medium might have rendered the cells irresponsive to additional VEGF stimulation. An increase in the applied concentration might resolve this issue or alternatively, endothelial cells specifically tested for VEGF responsiveness could be used.
TGF-β, a hallmark factor of fibrosis, is broadly known to cause activation of proliferation and migration in fibroblasts in vivo. 43 However, in vitro cultivation of fibroblasts can reflect pro-fibrotic gene expression changes after TGF-β treatment to some degree 27 but clearly lacks to display behavior of activated fibroblasts on a functional level due to their rapid activation and myofibroblast transition. 44 The role of TGF-β in the context of endothelial cells seems to be contradictory in literature. On the one hand, a reduction in trans-well migration of HUVECs caused by TGF-β through phosphatidylinositol 3-kinase catalytic subunit type 3 has recently been described. 45 In line, medium transferred from TGF-β-treated dental pulp stem cells to HUVECs reduced their migratory activity. 46 On the other hand, Wang et al 47 show an increase in HUVEC migration, both in scratch wound as well as trans-well migration assays in response to TGF-β. The discrepancies might result from the differences in concentrations and time periods of the treatment. However, the former studies used comparatively high concentrations or long exposure times potentially resulting in an over-stimulation of the cells eliciting a negative feedback loop 48 suppressing migration and proliferation.
For demonstration of usability of the herein proposed tools for pharmacological research, we screened for effective concentrations of nintedanib. The triple RTK inhibitor is a promising substance for interference with cellular migration, a process largely reliable on intercellular communication via cytokines and GFs. Kataria et al 49 could show a significant effect of nintedanib on cellular response to IL-1β and tumor necrosis factor α stimulation as expression of various cytokines decreased compared to control cells. In line, multiple studies have proven that low concentrations (⩽1 µM) were able to reduce wound healing capacity of various cell types.49-51 Comparably, we could show that HUVEC migration could be reduced upon application of similar dosages even in the presence of wound closure promoting GFs.
Comparison of methods
We discovered several advantages and disadvantages of the herein applied tools (Table 1). A major advantage of the Wound Healing Size Tool 20 is the possibility to analyze bright field images. However, we propose an assay protocol that includes Hoechst33342 which simplifies wound identification and has been described to have anti-proliferative effects in various cell types while not interfering with viability 52 thereby removing the confounding influence of cellular proliferation. In doubt, remaining proliferative activity can be estimated as we demonstrated in this report utilizing CellProfiler. Occasionally, DNA fragments or cellular debris remain attached to the plate surface after introducing the wound which could ensue in signals within the cell free area. These unwanted signals are removed by the hole filling step in the Wound Healing Size Tool reducing false detection of migratory activity. The major drawback of this tool, however, is the incapability of whole wound detection when wounds are already partially closed. This could lead to high variations challenging reproducibility and accurate reflection of actual migratory behavior. For proper high throughput utilization of the Fiji plugin, additional measures are necessary such as stacking the images that should be analyzed or automating single image analysis via a supplemental macro.
Advantages and disadvantages of applied migration analysis tools.
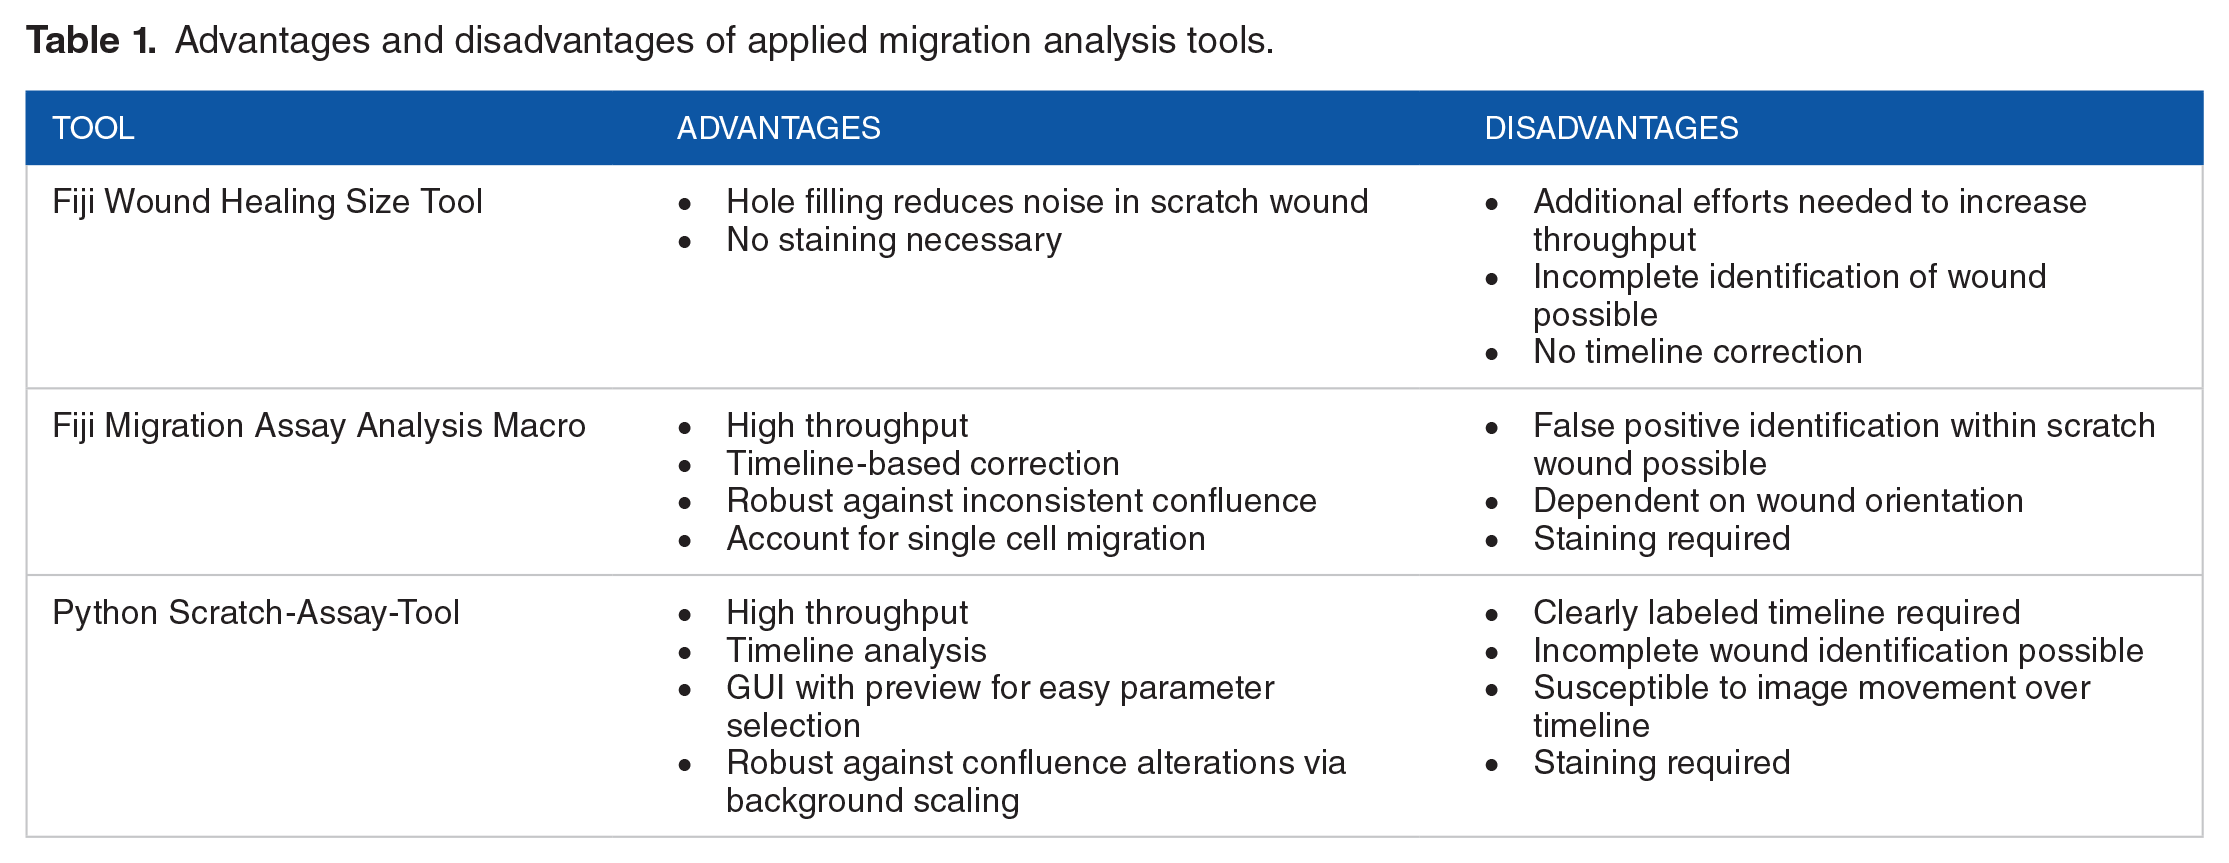
We created a Fiji-based analysis module that offers timeline-corrected migration measurements. Here, wound identification in subsequent images is assisted by the analyses performed in previous ones drastically reducing the risk of false wound identification. The algorithm is based on assessment of pixel intensities plotted across the image rather than selecting the largest cohesive cell-free area. This avoids incomplete recognition of wounds that already have been partially closed and increases robustness against deviations in cell layer confluence. A disadvantage of this approach is the dependency on the wound angle in the image as profiles are always plotted horizontally. Therefore, most accurate results can only be obtained in case of perfectly vertical or horizontal scratch wounds. Omission of a hole-filling step on the one hand allows for taking single cell migration into account but increases the risk for false identification. Lastly, to maximize throughput, we included the option to deconvolve image file names for automated classification of time points, well positions, and imaging channels.
We finally present a Python-based application and propose an alternative way of wound closure quantification. Unlike in previous approaches, we estimated the cellular density within the initial wound area for each time point to reflect migratory behavior. While this model still accounts for both, single cell and collective migration, normalization to the background of the remote area removes the bias of inconsistency in cellular confluence and corrects for proliferation influencing wound closure rates. For this approach to work however, unambiguous delineation of coherent timelines in file names is necessary because images are evaluated based wound outlining at the initial time point. While this approach is error prone in case of image position changes along the timeline, it greatly minimizes the risk of incomplete wound identification. Performing the analysis runs with Fiji tools, we noticed that finding optimal parameters can be time consuming. Therefore, we incorporated a preview window into the GUI for live tracking of parameter influences remarkably expediting the analysis process.
Conclusion
In this report we created a protocol that enables high throughput assessment of cellular migration in vitro. For this, we developed 2 novel approaches for automated image-based wound closure calculation and validated these in scratch assays performed with HUVECs, where we discovered a pro-migratory effect of IL-1β as well as anti-migratory actions of nintedanib. While this report is confined to the endothelial context, we speculate that our pipeline is easily transferable to other cell types such as fibroblasts or epithelial cells as well and will therefore simplify expeditious pre-clinical screenings not only for medications targeting the vasculature but also various other drug discovery objectives for a broad range of pathological conditions.
Supplemental Material
sj-docx-6-bec-10.1177_11795972241295619 – Supplemental material for Automated High-Throughput Live Cell Monitoring of Scratch Wound Closure
Supplemental material, sj-docx-6-bec-10.1177_11795972241295619 for Automated High-Throughput Live Cell Monitoring of Scratch Wound Closure by Kevin Schmidt, Dominik Lerm, Arne Schmidt, Nicholas Dickel, Jan Fiedler, Thomas Thum and Meik Kunz in Biomedical Engineering and Computational Biology
Supplemental Material
sj-docx-7-bec-10.1177_11795972241295619 – Supplemental material for Automated High-Throughput Live Cell Monitoring of Scratch Wound Closure
Supplemental material, sj-docx-7-bec-10.1177_11795972241295619 for Automated High-Throughput Live Cell Monitoring of Scratch Wound Closure by Kevin Schmidt, Dominik Lerm, Arne Schmidt, Nicholas Dickel, Jan Fiedler, Thomas Thum and Meik Kunz in Biomedical Engineering and Computational Biology
Supplemental Material
sj-jpg-1-bec-10.1177_11795972241295619 – Supplemental material for Automated High-Throughput Live Cell Monitoring of Scratch Wound Closure
Supplemental material, sj-jpg-1-bec-10.1177_11795972241295619 for Automated High-Throughput Live Cell Monitoring of Scratch Wound Closure by Kevin Schmidt, Dominik Lerm, Arne Schmidt, Nicholas Dickel, Jan Fiedler, Thomas Thum and Meik Kunz in Biomedical Engineering and Computational Biology
Supplemental Material
sj-jpg-2-bec-10.1177_11795972241295619 – Supplemental material for Automated High-Throughput Live Cell Monitoring of Scratch Wound Closure
Supplemental material, sj-jpg-2-bec-10.1177_11795972241295619 for Automated High-Throughput Live Cell Monitoring of Scratch Wound Closure by Kevin Schmidt, Dominik Lerm, Arne Schmidt, Nicholas Dickel, Jan Fiedler, Thomas Thum and Meik Kunz in Biomedical Engineering and Computational Biology
Supplemental Material
sj-jpg-3-bec-10.1177_11795972241295619 – Supplemental material for Automated High-Throughput Live Cell Monitoring of Scratch Wound Closure
Supplemental material, sj-jpg-3-bec-10.1177_11795972241295619 for Automated High-Throughput Live Cell Monitoring of Scratch Wound Closure by Kevin Schmidt, Dominik Lerm, Arne Schmidt, Nicholas Dickel, Jan Fiedler, Thomas Thum and Meik Kunz in Biomedical Engineering and Computational Biology
Supplemental Material
sj-jpg-4-bec-10.1177_11795972241295619 – Supplemental material for Automated High-Throughput Live Cell Monitoring of Scratch Wound Closure
Supplemental material, sj-jpg-4-bec-10.1177_11795972241295619 for Automated High-Throughput Live Cell Monitoring of Scratch Wound Closure by Kevin Schmidt, Dominik Lerm, Arne Schmidt, Nicholas Dickel, Jan Fiedler, Thomas Thum and Meik Kunz in Biomedical Engineering and Computational Biology
Supplemental Material
sj-jpg-5-bec-10.1177_11795972241295619 – Supplemental material for Automated High-Throughput Live Cell Monitoring of Scratch Wound Closure
Supplemental material, sj-jpg-5-bec-10.1177_11795972241295619 for Automated High-Throughput Live Cell Monitoring of Scratch Wound Closure by Kevin Schmidt, Dominik Lerm, Arne Schmidt, Nicholas Dickel, Jan Fiedler, Thomas Thum and Meik Kunz in Biomedical Engineering and Computational Biology
Footnotes
Acknowledgements
K.S. acknowledges support by the Hannover Biomedical Research School (HBRS).
Funding:
The author(s) disclosed receipt of the following financial support for the research, authorship, and/or publication of this article: This work was supported by the DFG [SFB 1470 Project-ID 437531118 to T.T.]; and by Fraunhofer CIMD. M.K. and D.L. were supported by grants SFB TRR221/project number 324392634 (INF) and RTG 2740/447268119 (project B2B within the Research Training Group “Immunomicrotope”) of the German Research Foundation (DFG), and M.K. and N.D. were supported by the German Federal Ministry of Education and Research (BMBF), CompLS programme grant 031L0262C.
Declaration Of Conflicting Interests:
The author(s) declared the following potential conflicts of interest with respect to the research, authorship, and/or publication of this article: T.T. is a founder and CSO/CMO of Cardior Pharmaceuticals GmbH, a wholly owned subsidiary of Novo Nordisk A/S (outside of the content of this manuscript). M.K. is the founder and shareholder of BioInf4Life UG. All other authors declare no conflict of interest.
Author Contributions
K.S. developed analysis software, performed cell culture experiments and wrote the initial draft of the manuscript as well as subsequent versions. D.L. developed analysis software and contributed to writing the initial draft. A.S. performed cell culture experiments and revised the manuscript. N.D. assisted in analysis software development. J.F., T.T., and M.K. supervised the project and assisted in manuscript writing and revision. All authors read and approved the manuscript.
Data Availability
The source code for the Fiji Migration Assay Analysis Macro is available here: https://github.com/schmikev/Migration-Assay-Analysis-Macro. The Python Scratch-Assay-Tool and a test dataset can be downloaded here: ![]() .
.
Supplemental Material
Supplemental material for this article is available online.
References
Supplementary Material
Please find the following supplemental material available below.
For Open Access articles published under a Creative Commons License, all supplemental material carries the same license as the article it is associated with.
For non-Open Access articles published, all supplemental material carries a non-exclusive license, and permission requests for re-use of supplemental material or any part of supplemental material shall be sent directly to the copyright owner as specified in the copyright notice associated with the article.