
Abstract
Methylthioadenosine phosphorylase (MTAP), a key enzyme in the methionine salvage pathway, is inactivated in a variety of human cancers. Since all human tissues express MTAP, it would be of potential interest to identify compounds that selectively inhibit the growth of MTAP-deficient cells. To determine if MTAP inactivation could be targeted, the authors have performed a differential chemical genetic screen in isogenic MTAP+ and MTAP− Saccharomyces cerevisiae. A low molecular weight compound library containing 30,080 unique compounds was screened for those that selectively inhibit growth of MTAP− yeast using a differential growth assay. One compound, containing a 1,3,4-thiadiazine ring, repeatedly showed a differential dose response, with MTAP− cells exhibiting a 4-fold shift in IC50 compared to MTAP+ cells. Several structurally related derivatives of this compound also showed enhanced growth inhibition in MTAP− yeast. These compounds were also examined for growth inhibition of isogenic MTAP+ and MTAP− HT1080 fibrosarcoma cells, and 4 of the 5 compounds exhibited evidence of modest but significant increased potency in MTAP− cells. In summary, these studies show the feasibility of differential growth screening technology and have identified a novel class of compounds that can preferentially inhibit growth of MTAP− cells.
Introduction
A
MTAP functions as the first enzyme in the methionine salvage pathway that converts the by-product of polyamine synthesis, 5′-deoxy-5′-methylthioadenosine (MTA), into adenine and methionine. This pathway is not essential at the cellular level as demonstrated by the fact that inhibition of MTAP function either by mutation has no effect on cell growth under standard conditions. 17,18 However, often in highly conserved pathways, biochemical redundancies explain why loss of a single gene does not give an obvious phenotype. In such situations, it is often possible to create a novel phenotype by inhibiting 2 pathways at the same time. In genetics, such interactions are termed synthetic lethal or synthetic sick interactions. In addition to gene-gene synthetic interactions, it is also possible to create such interactions using small molecules (chemical genetic lethality). 19
In this study, we set out to determine if it was possible to identify small molecules that preferentially inhibit the growth of MTAP− cells. As a test for the feasibility, we performed a chemical genetic screening in S. cerevisiae to identify compounds that can preferentially inhibit the growth of MTAP− (meu1Δ) cells with a relatively simple screening methodology. Using this approach, we have identified a novel class of compounds that can preferentially inhibit the growth of MTAP− yeast and an MTAP− human cell line.
Materials and Methods
Yeast strains
The base strain used in these experiments was RDY84 (Mata, pdr1ΔKAN, pdr3ΔHIS3, ade2, trp1, his3, leu2, ura3, can1). To create a meu1Δ version of this strain, it was transformed with a MEU1Δ::LEU2 knockout cassette using primers sense (5′-ATC AAA TCC GAT CAG CTT ACT GTG TTG ACG-3′) and antisense (5′-CAC GTT CAG TTG GTT GAA TGC AGA ACT TC-3′) to amplify the cassette from yeast strain AS3-2a. 18 The PCR product was sequenced and introduced into RDY84 using lithium acetate transformation. The transformed yeast was plated on synthetic complete media lacking leucine. The presence of the mutation was confirmed in 2 different ways: loss of MTAP enzyme activity and growth in adenine-free medium supplemented with MTA. Basic yeast procedures were all performed as described previously. 20
Yeast extract preparation and enzyme assay
Yeast extracts and MTAP enzyme assays were performed as described previously. 18 One unit of MTAP activity is defined as the enzyme amount that catalyzes the formation of 1 µmol of adenine per minute under the conditions of the assay described.
Compound library
The collection of compounds used for screening was obtained from a commercial provider (Chemical Diversity, Inc., San Diego, CA). The compounds have been selected for maximum structural diversity while largely meeting Lipinski’s empirically derived “rule of 5” for drug-like properties. 21 The compounds were solubilized in DMSO to a final concentration of 5 mM, formatted in 384-well microplates, and stored at −80°C.
Screening methodology
Isogenic strains of yeast (MEU1+ and meu1Δ) were grown in synthetic complete (SC) media overnight; concentration was determined by measuring OD600, and then the strains were diluted to OD600 0.003 and 0.0015, respectively. The difference in starting cell number is to compensate for the slightly faster doubling time of the meu1Δ strain. Using an automated dispenser, 40 µL of culture was added to 384-well plates (Corning, Inc., Corning, NY). For each plate of the compound library tested, 4 yeast plates were made (2 MEU1 and 2 meu1Δ). To each plate, compound was added from the library using a 384-pin transfer apparatus (Scinomix lab, Earth City, MO). These pins are designed to transfer 20-nL compounds in each transfer, resulting in a final compound concentration of 2.5 µM. Plates were sealed with Thermowell sealing tape (Fisher Scientific, Waltham, MA) and incubated at 30°C without shaking. Each plate had a column of untreated wells that were used to normalize between plates. A total of 30,080 compounds were tested for each strain in duplicate. After 18 h, cells were resuspended by vortexing, plates were read at 570 nm by a plate reader, and statistical computation was done.
Data processing
The OD570 for compound-treated well was normalized by dividing with the average of the untreated wells on the same plate. The average of the normalized meu1Δ values were divided by normalized MEU1 values to get a meu1Δ/MEU1 ratio. Hits were selected based on this ratio. A meu1Δ/MEU1 ratio of less than 0.5 (growth inhibition more than 50%) was set as a cutoff point. There were 118 compounds that showed at least 2-fold increased growth inhibition in the meu1Δ strain compared with MEU1. In addition, we excluded those compounds that exhibited more than a 50% reduction in growth in MEU1 cells or exhibited a marked difference in OD between duplicate wells (SD >30%).
Dose-response analysis
To determine IC50 concentrations, meu1Δ and MEU1 yeast were plated in 100 µL of SC complete media in 96-well plates. Drug was added at concentrations ranging from 0 to 300 µM in 25-µM increments for compounds to each well in triplicate. For some compounds (3A and 7C), 10-µM increments were used. Growth was measured by OD570 after 18 h. Dose-response curve and IC50 were calculated using nonlinear regression analysis using GraphPad Prism 4.0 software (GraphPad Software, Inc., La Jolla, CA).
HT1080 studies
HT1080 cells are a human fibrosarcoma-derived cell line that is known to lack MTAP expression. 22 Stable MTAP-expressing HT1080 cells were created by stable transformation with pTRE2:MTAP. This plasmid was created by inserting the hMTAP-containing BamHI/EcoRV fragment from pCR:s MTAP 22 into pTRE2hyg (Clontech, Palo Alto, CA). HT1080 cells (Clontech) were cultured in Dulbecco’s modified Eagle’s medium (DMEM) supplemented with 2 mM glutamine, 100 µg/mL penicillin, 100 µg/mL streptomycin, 10% fetal bovine serum (FBS), and 250 µg/mL G418. Transformations were performed using Fugene6 reagent (Roche, Indianapolis, IN), a nonliposomal transformation agent, according to the manufacturer’s instructions. Four micrograms of pTRE2:MTAP were used for each transformation, and pTRE2hyg was used as vector control. Clones were selected using 250 µg/mL hygromycin from a 50-mg/mL stock solution in phosphate-buffered saline (PBS; Sigma-Aldrich, St. Louis, MO). Twenty-four individual clones transfected with pTRE2:MTAP were isolated and examined for MTAP expression by Western blot, and all were found to express MTAP at similar levels. The pTRE2:MTAP and pTRE2 transfected cells were then pooled together in equal numbers to create 2 new pooled cell lines (called HT1080M+ and HT1080M–, respectively) to control for non-MTAP-related clonal variation.
For dose-response curves, HT1080M+ and HT1080M− cells were seeded onto a 96-well cell culture plate in the medium mentioned above, at 3000 cells/0.2 mL per well. After seeding for 24 h, testing agents were added at final concentration range from 0 (vehicle only) to 200 µM for an additional 48 h. Cell viability was determined by CellTiter 96 Aqueous One Solution (MTS assay, Promega, Madison, WI) following the manufacturer’s instructions. Each treatment was carried out in triplicate. At the end of treatment, media were replaced by 100 µL regular media containing 15% Cell Titer 96 Aqueous One Solution, and the plate was incubated at 37°C for 3 h. The optical absorbance of the MTS metabolite formazin at a 492-nm wavelength was recorded immediately by using an automated plate reader, the Multiskan Ascent (Thermo Bioanalysis, Santa Fe, NM). Dose-response analysis was performed identically to the yeast analysis described above.
Synthesis of compounds
Each of the compounds was generated using a 2-step procedure in which the first step is the creation of the appropriate bromopropiophenone, and the second step reacts to this compound with thiosemicarbazide to produce the 1,3,4-thadiazine ring. 23 Details are described below.
Materials
4-Chloropropiophenone, 3′,4′-dichloropropiophenone, thiosemicarbazide hydrochloride, and anhydrous DMF were purchased from Acros Organics (available from VWR International, West Chester, PA). 2-Bromopropiophenone and 3′-chloropropiophenone were purchased from Sigma-Aldrich. Chloroform was dried by storage over CaCl2. Ethanol was distilled from calcium hydride and stored over molecular sieves. All other reagents were from stock and were dried in vacuo for several hours prior to use. 1H nuclear magnetic resonance (NMR) analysis was performed on a Bruker Avance 300-MHz wide-bore instrument (Bruker, Billerica, MA).
Step 1: preparation of a-bromopropiophenone
1. 2-Bromo-4′-chloropropiophenone
Exactly 11.1 g (0.0658 moles) of 4′-chloropropiophenone and 60 mg (0.00045 moles) of aluminum chloride were dissolved with stirring in 30 mL of chloroform under a nitrogen atmosphere at room temperature. Bromine (10.5 mL; 0.0658 moles) was added dropwise over 45 min. Then, the solution was stirred for 60 min and analyzed by thin-layer chromatography (TLC; 10% toluene and 90% hexanes). HBr gas was removed with a nitrogen stream. The product was dried under reduced pressure (16.073 g; 98% yield). 1H NMR (CDCl3): d 1.90 (d, 3H, 6.3 Hz); 5.22 (q, 1H, 6.3 Hz); 7.46 (d, 2H, 8.1 Hz); 7.97 (d, 2H, 8.1 Hz).
2. 2-Bromo-3′-chloropropiophenone
Exactly 5.53 g of 3′-chloropropiophenone and 30 mg of aluminum chloride were dissolved with stirring in 20 mL of chloroform under a nitrogen atmosphere. Bromine (1.68 mL; 3.366 g) was added dropwise over 30 min at room temperature. Then, the solution was stirred for 2 h and analyzed by TLC (10% toluene and 90% hexanes). HBr gas was removed with a nitrogen stream. The product was dried under reduced pressure to give an orange liquid (7.73 g, 95% yield). 1H NMR (CDCl3): d 1.90 (d, 3H, 6.6 Hz); 5.23 (q, 1H, 6.6 Hz); 7.41 (t, 1H, 8.1 Hz); 7.54 (d, 1H, 8.1 Hz); 7.88 (d, 1H, 8.1 Hz); 7.98 (s, 1H).
3. 2-Bromo-3′,4′-dichloropropiophenone
Exactly 1.125 g of 3′,4′-dichloropropiophenone and 6 mg of aluminum chloride were dissolved with stirring in 20 mL of chloroform under a nitrogen atmosphere. Bromine (0.284 mL) was added dropwise over 30 min at room temperature. Then, the solution was stirred for 2 h and analyzed by TLC (10% toluene and 90% hexanes). HBr gas was removed with a nitrogen stream. The product was dried under reduced pressure (1.654 g; 100% yield). 1H NMR (CDCl3): d 1.91 (d, 3H, 6.6 Hz); 5.23 (q, 1H, 6.6 Hz); 7.59 (d 1H, 8.4 Hz); 7.86 (dd, 1H, 2.1 and 8.4 Hz); 8.12 (d, 1H, 8.4 Hz).
4. 2-Bromo-4′-chlorovalerophenone
Exactly 4.84 g of 4′-chlorovalerophenone and 30 mg of aluminum chloride were dissolved with stirring in 20 mL of chloroform under a nitrogen atmosphere. Bromine (3.934 g; 1.262 mL; 0.024622 moles) was added dropwise over 30 min at room temperature. The product obtained was 7.004 g (100% yield) after the usual workup. 1H NMR (CDCl3): d 0.99 (t, 3H, 7.2 Hz); 1.50 (m, 2H); 2.14 (m, 2H); 5.09 (t, 1H, 7.2 Hz); 7.46 (d, 2H, 8.7 Hz); 7.97 (d, 2H, 8.7 Hz).
Step 2: preparation of 1,3,4-thiadiazine hydrochlorides
1. 2-Amino-5-(4-chlorophenyl)-6-methyl-1,3,4-thiadiazine hydrochloride (65 1A)
Exactly 500 mg (0.00548 moles) of thiosemicarbazide and 976 mg (0.00394 moles) of 2-bromo-4′-chloropropiophenone were stirred in 20 mL of dry ethanol under a nitrogen stream. The solution was stirred for 1 h at room temperature, followed by 2 h of reflux. It was allowed to cool to room temperature overnight. The solid was filtered, giving 988 mg (85% yield). 1H NMR (DMSO): d 2.39 (s, 3H); 7.50 (d, 2H, 8.1 Hz); 7.64 (d, 2H, 8.1 Hz).
2. 2-Amino-5-(3-chlorophenyl)-6-methyl-1,3,4-thiadiazine hydrochloride (91A)
Exactly 500 mg of thiosemicarbazide and 976 mg of 2-bromo-3′-chloropropiophenone were stirred in about 20 mL of dry ethanol under a nitrogen stream. The solution was stirred for 1 h at room temperature, followed by 2 h of reflux. It was allowed to cool to room temperature overnight. The slightly yellow solid was filtered (863 mg, yield 91%). 1H NMR (DMSO): d 2.46 (s, 3H); 7.45 (m, 2H); 7.62 (d, 2H, 7.8 Hz); 7.74 (s, 1H).
3. 2-Amino-5-(3,4-dichlorophenyl)-6-methyl-1,3,4-thiadiazine hydrochloride (3A)
Exactly 500 mg of thiosemicarbazide and 1.111 g of 2-bromo-3′,4′-dichloropropiophenone were stirred in 20 mL of dry ethanol under a nitrogen stream. The solution was stirred for 1 h at room temperature, followed by 2 h of reflux. It was allowed to cool to room temperature overnight. The resulting solid was filtered (334 mg; 31%; NMR). 1H NMR (DMSO): d 2.47 (s, 3H); 7.62 (dd, 1H, 1.8 and 8.4 Hz); 7.71 (d, 1H, 8.4 Hz); 7.90 (d, 1H, 1.8 Hz).
4. 2-Amino-5-phenyl-6-methyl-1,3,4-thiadiazine hydrochloride (93A)
Exactly 500 mg of thiosemicarbazide and 0.589 mL (840 mg) of 2-bromopropiophenone were stirred in about 20 mL of dry ethanol under a nitrogen stream. The solution was stirred for 1 h at room temperature, followed by 2 h of reflux. It was allowed to cool to room temperature overnight. A light yellow solid was filtered (604 mg, yield 75%). 1H NMR (DMSO): d 2.39 (s, 3H); 7.36 (m, 1H); 7.46 (t, 2H, 7.8 Hz); 7.61 (d, 2H, 7.8 Hz).
5. 2-Amino-5-(4-chlorophenyl)-6-propyl-1,3,4-thiadiazine hydrochloride (7C)
Exactly 500 mg of thiosemicarbazide and 1.086 g of 2-bromo-4′-chlorovalerophenone were stirred in 20 mL of dry ethanol under a nitrogen stream. A solid was filtered and the filtrate was reduced in vacuo. The residue was taken up in chloroform and filtered, and the filtrate was evaporated in vacuo to a yellow solid (1.22 g; 100% yield) and analyzed by NMR. 1H NMR (DMSO): d 0.90 (t, 3H, 7.5 Hz); 1.59 (m, 2H, 7.5 Hz); 2.76 (t, 2H, 7.5 Hz); 7.54 (d, 2H, 8.7 Hz); 7.61 (d, 2H, 8.7 Hz).
Results
Creation and characterization of isogenic MEU1 and meu1Δ strains
To facilitate small-compound screening in S. cerevisiae, we first created isogenic MEU1 and meu1Δ strains by single-step gene replacement in a strain background deleted for the multidrug resistance genes PDR1 and PDR5. 24 Characterization of meu1Δ::LEU2-containing cells shows that they lack MTAP activity ( Fig. 1A ) and are unable to use MTA instead of adenine to complement their ade2 mutation ( Fig. 1B ). Thus, MTAP activity is effectively lost in meu1Δ cells. Growth rates between the 2 strains were only slightly different, with meu1Δ::LEU2 growing slightly faster that MEU1 cells ( Fig. 2 ).
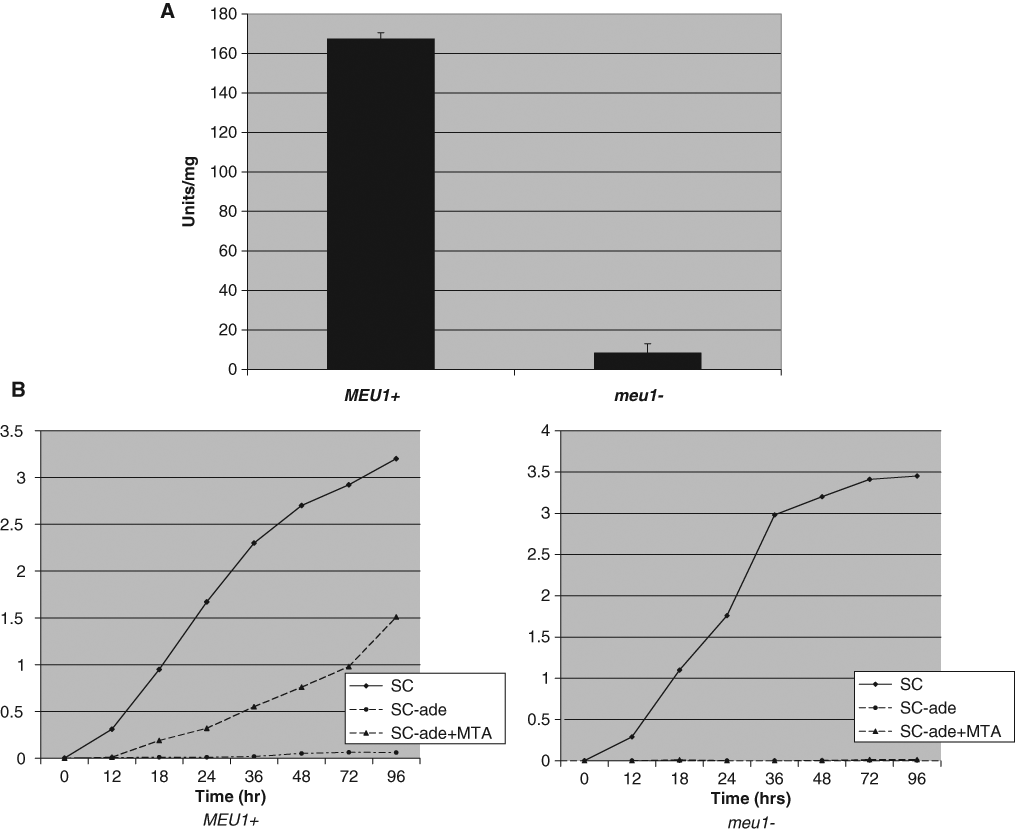
Characterization of methylthioadenosine phosphorylase (MTAP) status in isogenic MEU1 and meu1Δ cells. (
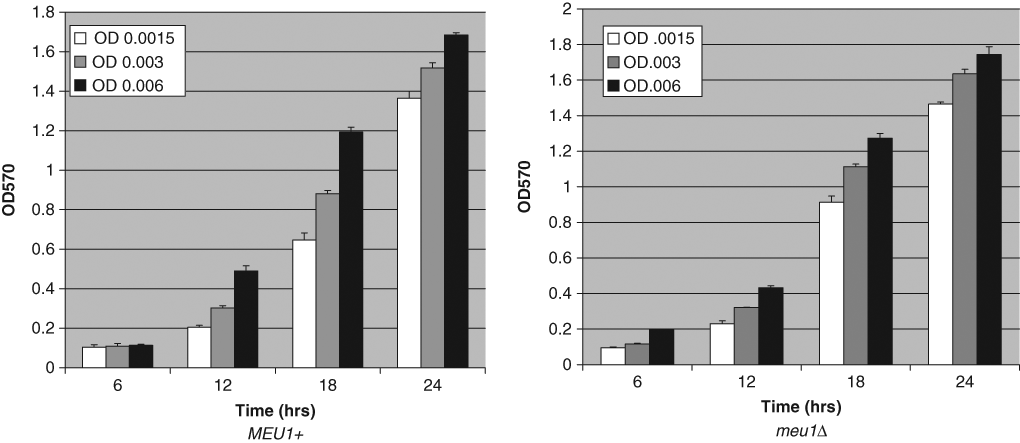
Growth rate comparison of MEU1 and meu1Δ cells. Saturated cultures of isogenic MEU1 and meu1Δ strains were diluted to the indicated OD570 in 3 mL of synthetic complete (SC) media in test tubes and grown with aeration at 30°C. OD570 and growth was monitored every 6 h. Experiment was performed in quadruplicate, and standard deviation is shown.
Screening
The basis of our screen was to identify compounds that preferentially inhibited the growth of MEU1 cells versus meu1Δ cells. Our screening strategy involved growing isogenic MEU1 and meu1Δ cells in 384-well microplates and testing all compounds in duplicate plates ( Fig. 3 ). Each plate had a total of 320 wells that were exposed to drug, 48 wells that were not exposed to drug, and 16 wells that contained media but no cells. Examination of the growth in untreated wells containing cells revealed that the intraplate coefficient of variation (CV) was 11.8% in MEU1 cells and 12.5% in meu1Δ cells. The interplate CV for untreated cells was slightly higher, 17.1% for MEU1 cells and 14.5% for meu1Δ cells. To control for this increased plate-to-plate variability, the data on each plate were normalized by dividing each of the compound-treated well’s OD570 value by the average of the untreated wells on the same plate.
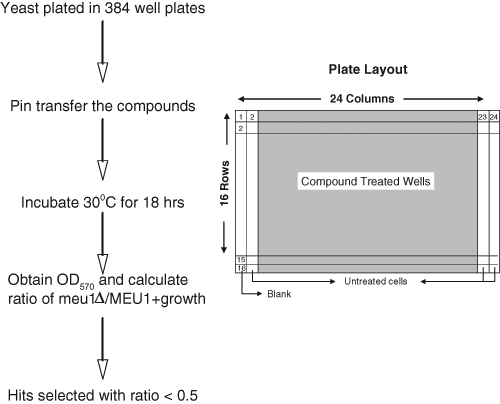
Outline of methodology used for screening. On the left is a flowchart describing the screening methodology. On the right is a diagram showing the setup of each 384-well plate.
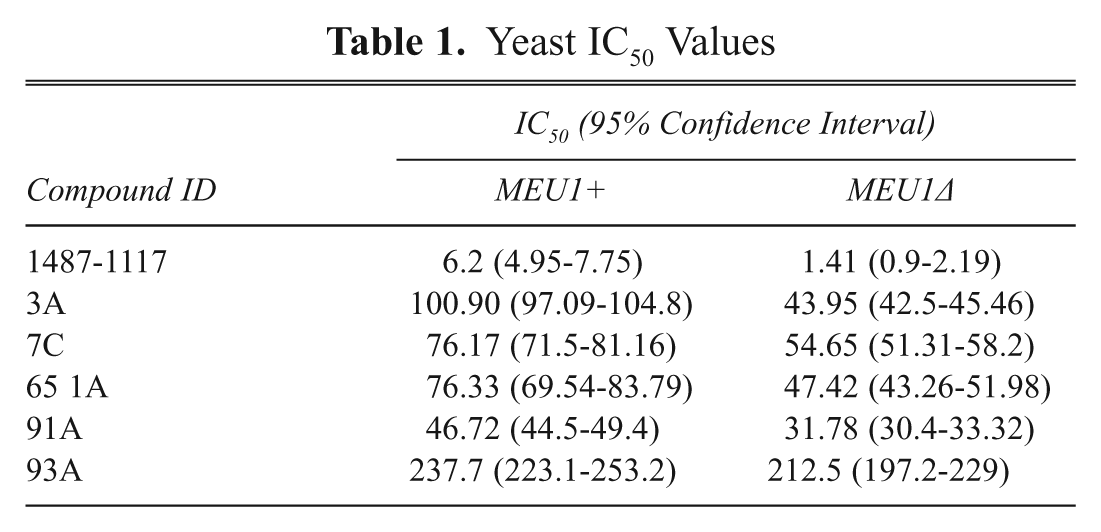
In the primary screen, we examined the growth effects of 30,080 compounds added to each well at a final concentration of 2.5 µM. In general, the vast majority of compounds tested had no effect on yeast cell growth for either strain. Using a 50% reduction in mean growth as a cutoff, we found that 1.8% of the compounds exhibited growth inhibition in MEU1 cells, and 2.1% of the compounds exhibited growth inhibition in meu1Δ cells. Searching for compounds that exhibited at least a 2-fold increased growth inhibition in MEU1 versus meu1Δ cells identified 218 compounds, giving a hit rate of ~0.72%. Of 218 compounds, 80 met the criteria that they had less than 50% inhibition in MEU1 cells and had a CV between the 2 replicates of <30%. These 80 compounds were then retested using that 5 times the original concentration of drug, and 11 showed differential growth upon retest ( Fig. 4A ). We then used these 11 compounds for dose-response experiments to determine the relative IC50 of each compound for each strain. Only 1 compound (1487-1117, containing a 1,3,4-thiadiazine ring) exhibited a dose-response curve in which a statistically significant difference between MEU1 and meu1Δ cells could be observed ( Fig. 4B and Table 1 ). Unfortunately, the supplier of the compound library (Chemical Diversity, Inc.) was unable to resynthesize this compound despite several attempts. Because we suspected the 1,3,4-thiadiazine ring might be important for function, and this part of the molecule was relatively simple to produce, we examined the effect of a series of 1,3,4-thiadiazine compounds that were produced in house on cell growth. These compounds all contained a 2-amino-1,3,4-thiadiazine ring and a phenol ring with modifications at either the 3 or 4 position ( Fig. 5 ). We found that loss of MTAP resulted in increased growth inhibition for all but 1 of the compounds examined. The calculated IC50s for each compound are shown in Table 1 . Interestingly, the 1 compound that failed to show differential effect was compound 93A, which was the only compound to lack a halogen modification of the phenol ring.
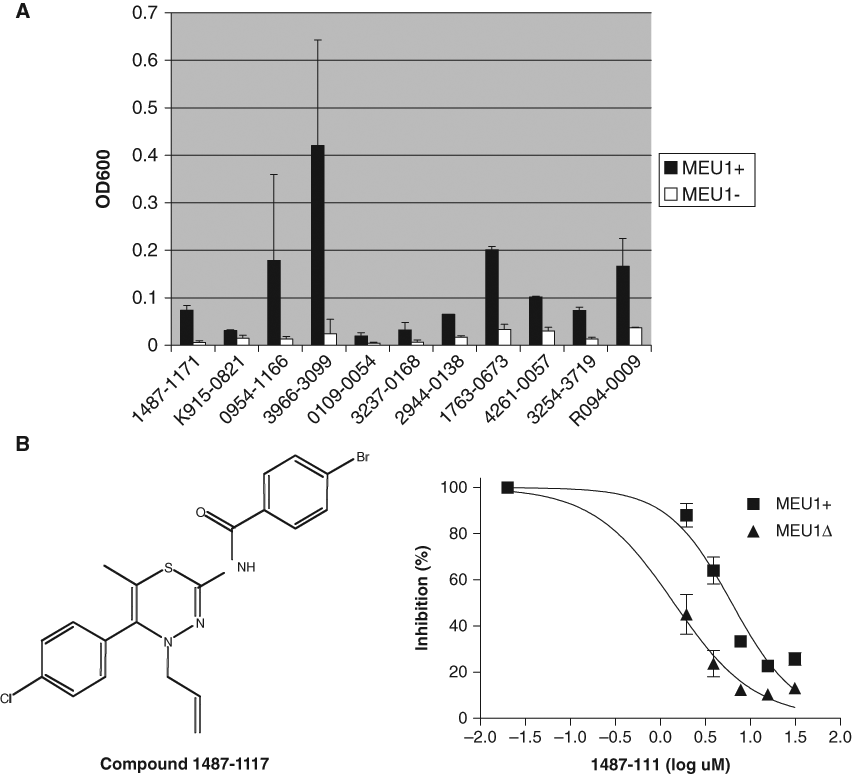
Effect of compounds in MEU1 and meu1Δ cells in secondary screening. (
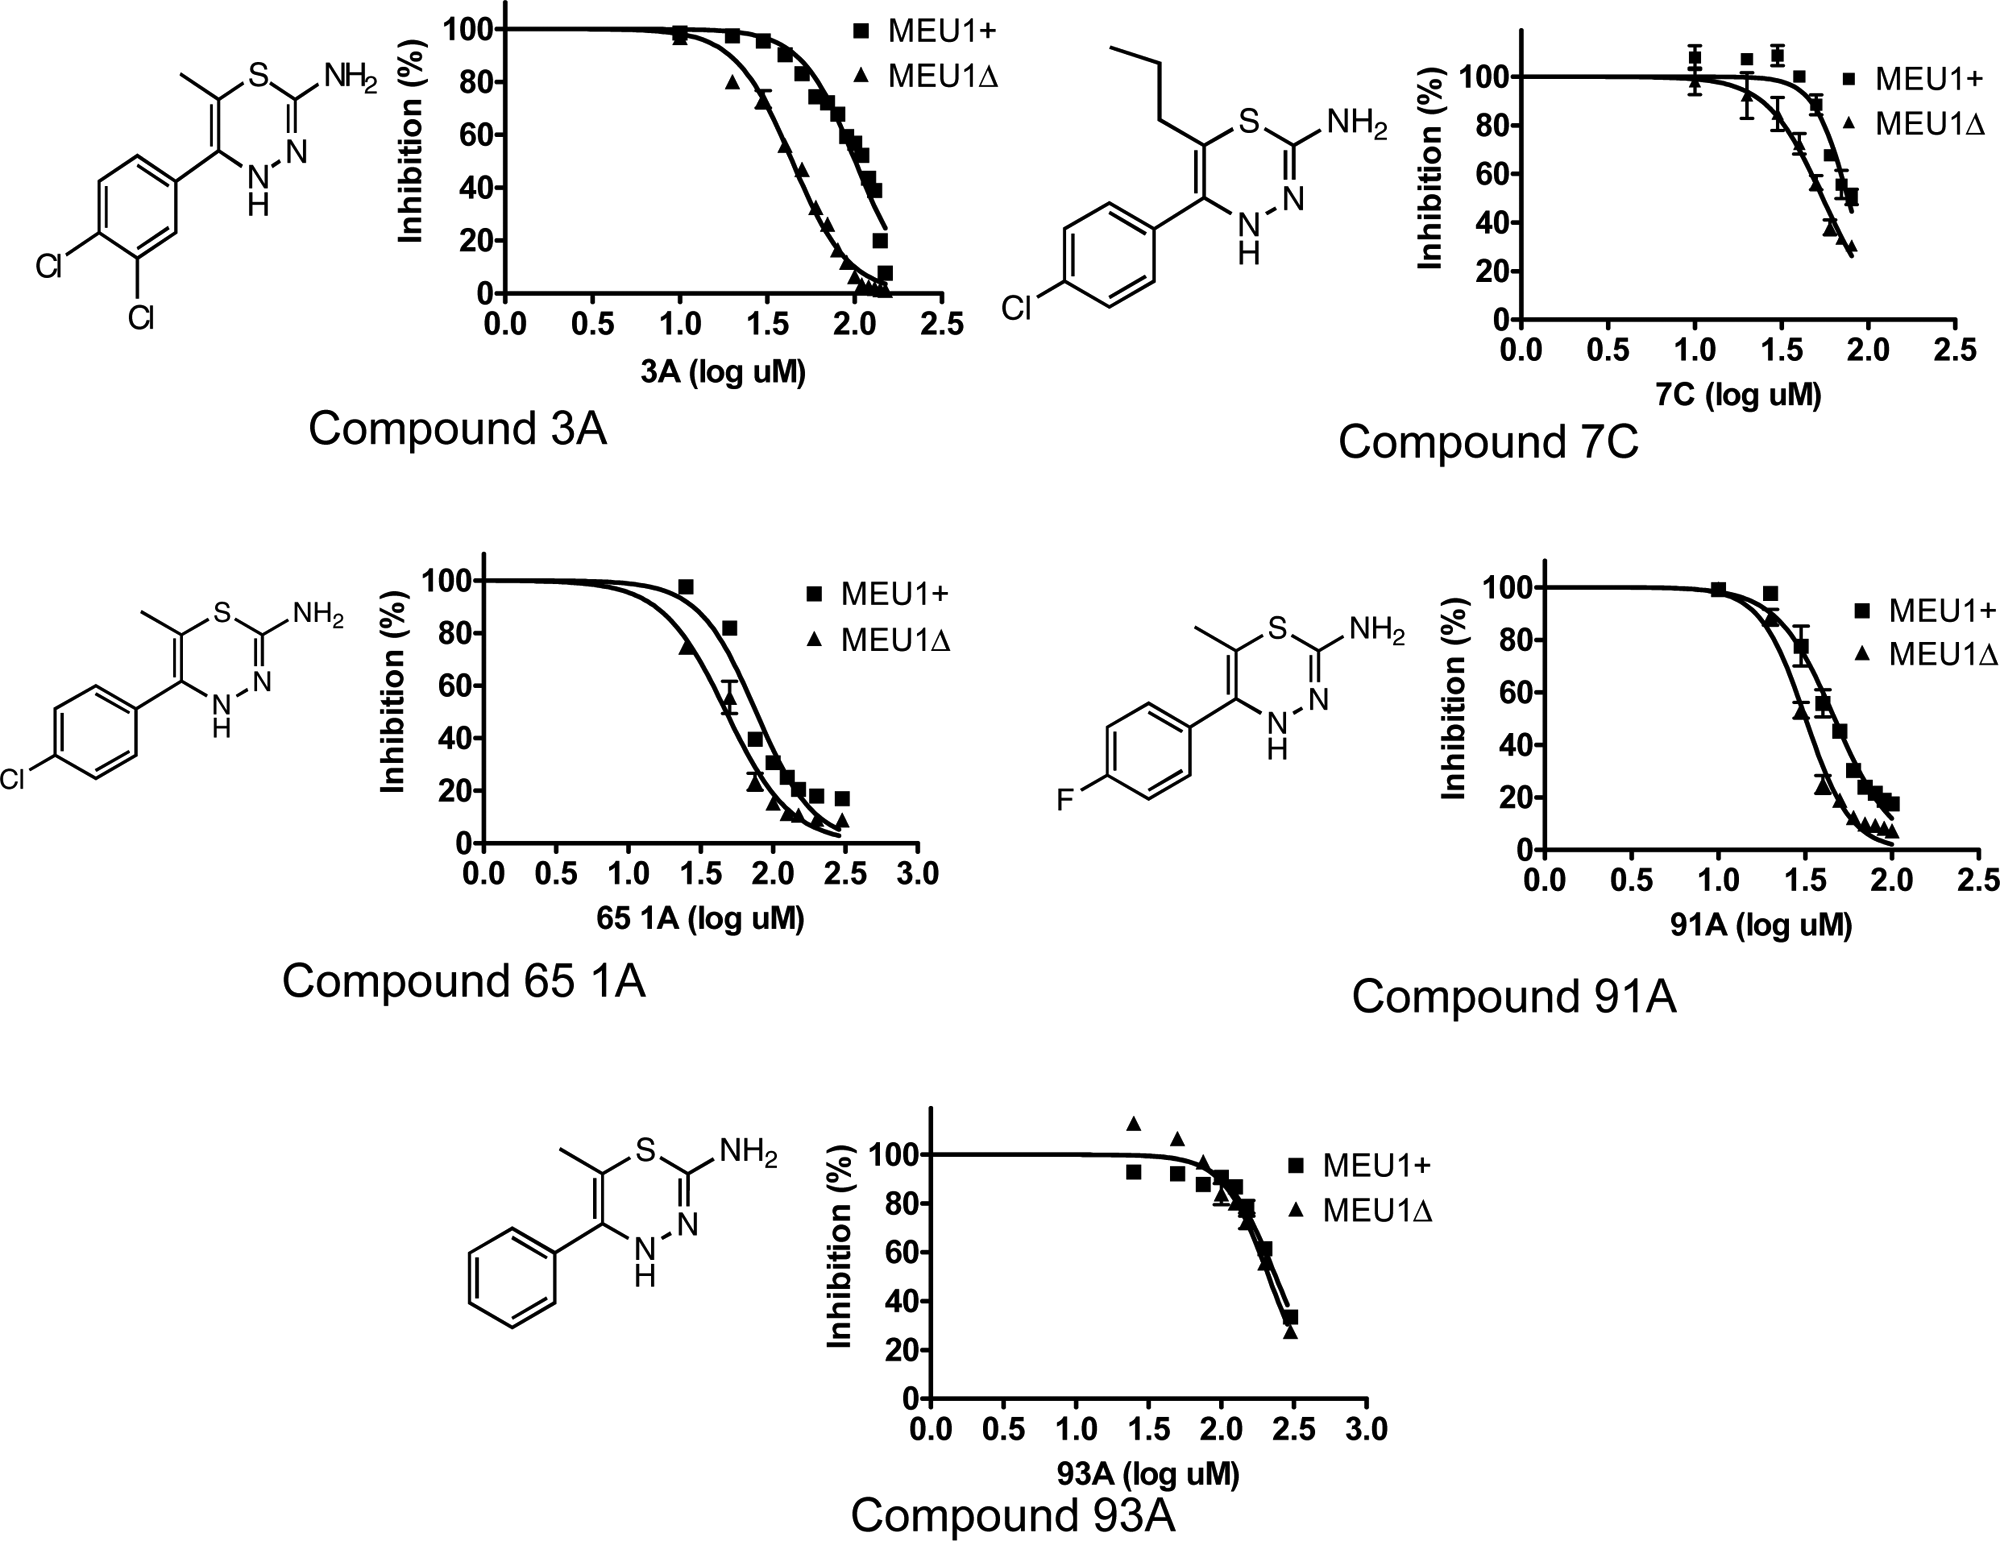
Dose-response curves in MEU1 and meu1Δ cells for the indicated 2-amino-1,3,4-thiadiazine ring containing compounds. Dose-response curves were constructed as described in Materials and Methods. Structures are shown in each panel on the left.
Yeast IC50 Values
Studies in isogenic MTAP+ and MTAP− human cells
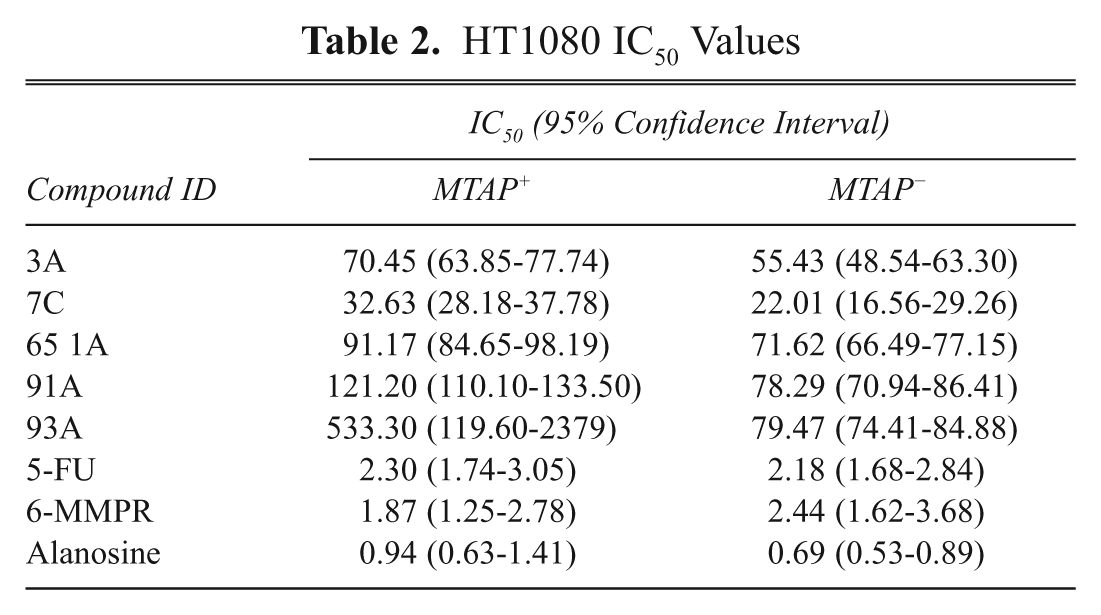
We next tested the compounds identified as having differential growth inhibition in yeast in isogenic MTAP+ and MTAP− human cell lines. These cells were created by expressing MTAP in a MTAP-deleted HT1080 fibrosarcoma cell line (see Materials and Methods). For each compound, we performed dose-response experiments and calculated IC50. In addition, we tested 3 other cytotoxic agents used to target de novo nucleotide biosynthesis, including 5-flurouracil, 6-methylmercaptopurine ribonucleotide (6-MMPR), and alanosine ( Table 2 ). All of the experimental compounds tested had reduced IC50 values in MTAP− versus MTAP+ cells, with 4 of the 5 compounds having no overlap within the 95% confidence interval. None of the control compounds showed statistically significant differences in IC50.
HT1080 IC50 Values
Discussion
In the work described here, we have performed a chemical genetic screen designed to find compounds that can preferentially inhibit the growth of yeast cells deleted for MTAP. Using this screen, we have identified a series of compounds containing a 1,3,4-thiadiazine ring that have enhanced growth inhibition in both yeast and human cells lacking MTAP activity. The technology used to perform the screening was simple and did not require large amounts of expensive robotic equipment. To differentially screen 30,080 compounds in duplicate required approximately 200 plates and could be performed by a single person in a few weeks. However, there are some limitations to the approach. First, there was a high rate of false positives in the primary screen, and it was essential to include secondary and tertiary screens to confirm potential hits. We suspect that the high rate of false positives may be related to the variability of drug transferred to each well by the disposable pin transfer units. A second limitation of the approach is that only 1 concentration of the starting compound was tested. Since most of the compounds tested have relatively steep dose-response curves, compounds that may be differentially effective may be missed either due to too high or too low drug concentrations. A third limitation concerns the ease of resynthesis of “hit” compounds. It is sometimes difficult to resynthesize the compound in larger quantities, as was the case in our initial hit compound, 1487-1117. A final limitation of this approach is that the actual molecular targets of the drug molecules identified are unknown, and determination of the target(s) would not be trivial.
The compounds identified as having increased growth inhibition in meu1Δ yeast contained a 1,3,4-thiadiazine ring and a phenol ring. Compounds containing these moieties have been shown to have a variety of biological effects, including antimicrobial and anti-inflammatory activity, and act as phosphodiesterase and metalloprotease inhibitors. 23,25-27 In yeast, the halogenation of the phenol ring appeared to be important, as the 1 compound lacking halogenation, 93A, did not show differential growth inhibition. Interestingly, halogenation of the same position of the phenol was shown to increase the effectiveness of related compounds in both an anti-inflammatory assay and as an inhibitor of matrix metalloproteases. 23,27 It should also be noted that the parent compound, 1487-117, was the most potent with regards to growth inhibition in yeast in both MEU1 and meu1Δ cells. This compound is distinguishable from the other compounds in the series by 2 modifications: (1) the addition of a brominated phenol group attached to the amino group hanging off C2 of the thiadizaine ring and (2) alkylation of the N4 position of the same ring. Further studies will be required to understand the importance of these modifications with regards to the increased potency of this compound.
The reason for the increased sensitivity of MTAP− cells to these compounds is unknown. MTAP is highly conserved in evolution but at the cellular level seems to be entirely dispensable for growth. MTAP’s known enzymatic activity is to provide the cell with adenine and methionine from MTA. However, in the yeast assay described here, adenine and methionine are supplemented in the media, so interference with the de novo production of these metabolites is not likely to result in a growth phenotype. However, it may be that MTAP has other as yet undescribed functions. Interestingly, the yeast MTAP orthologue, MEU1 (multicopy enhancer of UAS1), was initially identified in a genetic screen designed to identify transcription factors regulating the Adh2 gene. 16 Also, microarray experiments show that more than 300 transcripts are differentially regulated between MTAP+ and MTAP− HT1080 cells (W. D. Kruger, in preparation). Taken together, these observations suggest that loss of MTAP may have more wide-ranging effects on cellular physiology than previously thought. It is possible that the compounds described here have increased sensitivity in MTAP− cells because it affects one of these other MTAP-regulated pathways.
Even though the screening system described here was successful in identifying compounds that had some increased potency in inhibiting the growth of MTAP− yeast and mammalian cells, the differential IC50 of these compounds was relatively modest. Furthermore, in HT1080 cells, none of the compounds had IC50 values less than 10 µM. However, it is possible that further optimization of the compounds may lead to increased potency and potential usefulness. Alternatively, screening a much larger compound library using isogenic MTAP+ and MTAP− human cell lines may reveal new compounds with greater selectivity and potency. The feasibility of this approach is strengthened by the findings presented here.
Footnotes
Acknowledgements
This work was supported by grants for the National Institutes of Health (CA131024), the American Cancer Society (RSG-03-157-01-GMC), and an appropriation from the Commonwealth of Pennsylvania. We also acknowledge the contribution of the Fox Chase Cancer Center DNA sequencing facility.